Comparative Study
. 2023 Jul;619(7968):129-134.
doi: 10.1038/s41586-023-06203-4. Epub 2023 Jun 28.

Wake-like skin patterning and neural activity during octopus sleep

Affiliations
Comparative Study

Wake-like skin patterning and neural activity during octopus sleep

Aditi Pophale et al. Nature. 2023 Jul.

Abstract

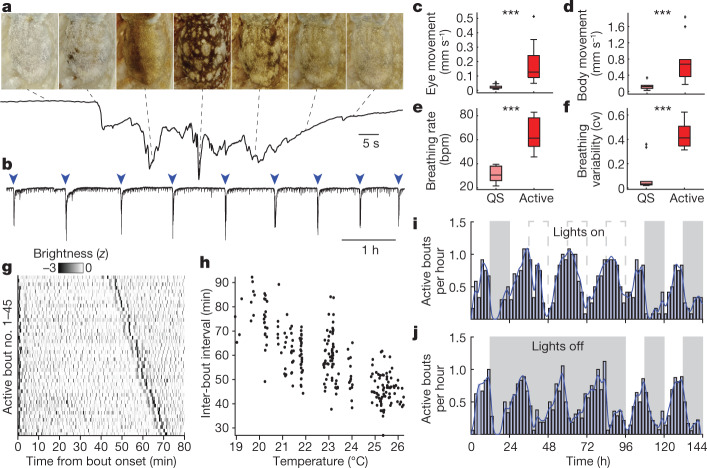
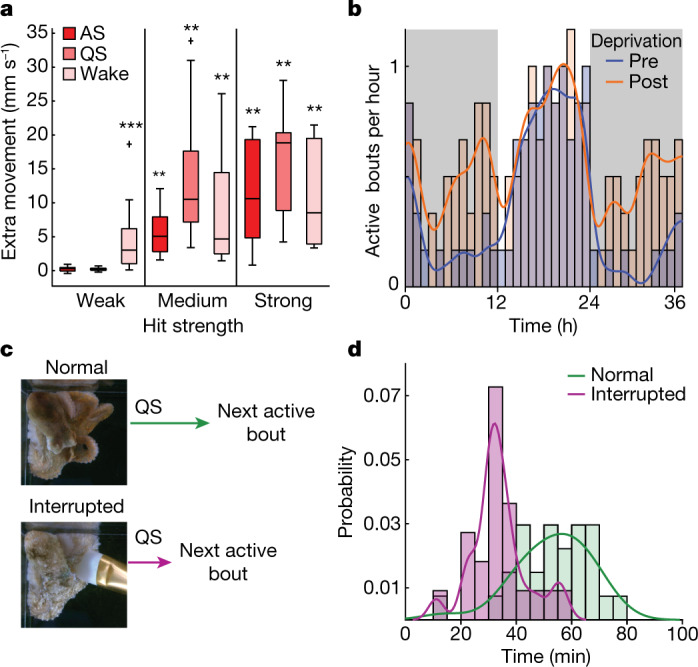
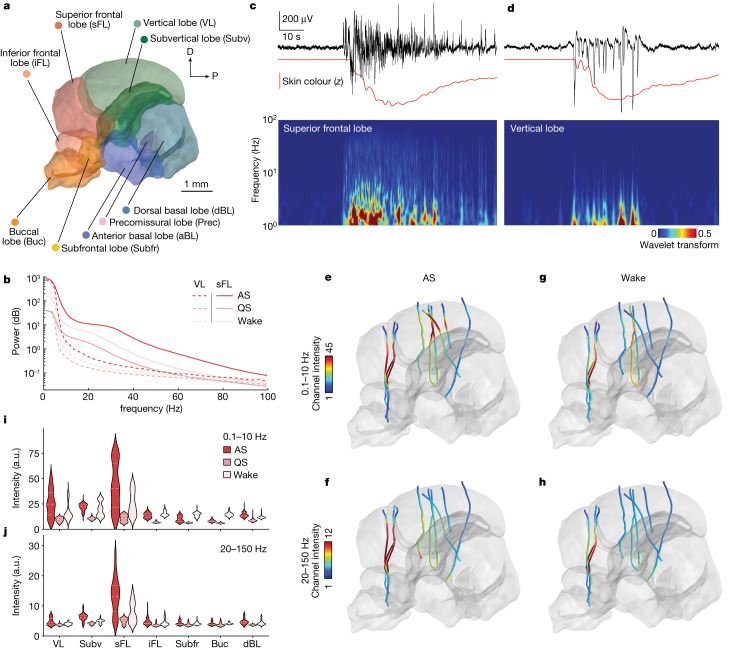
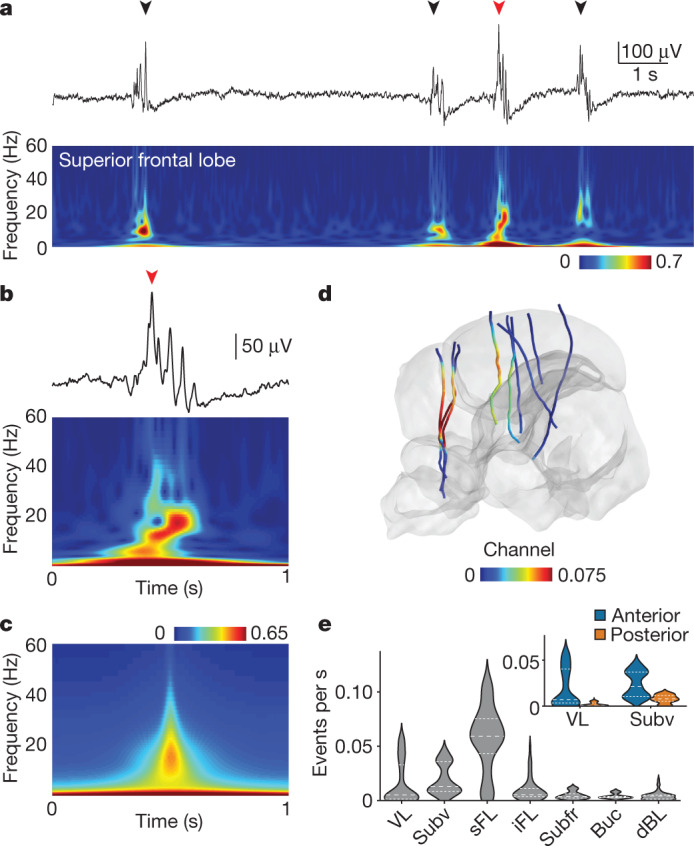
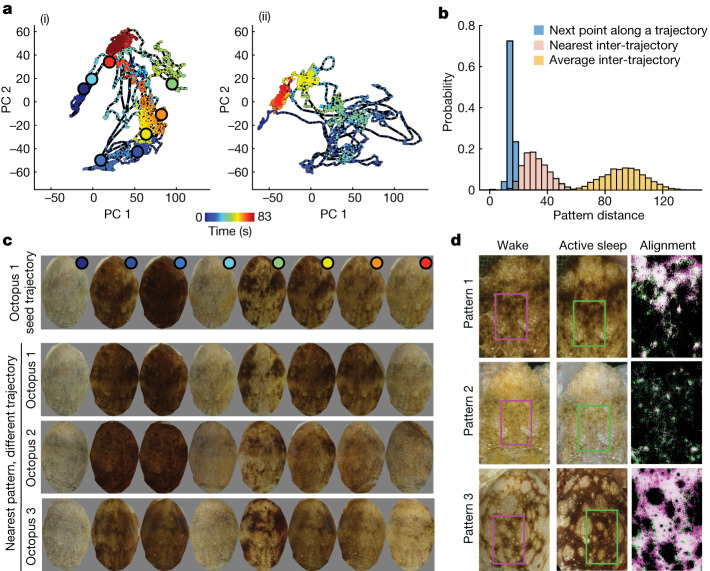
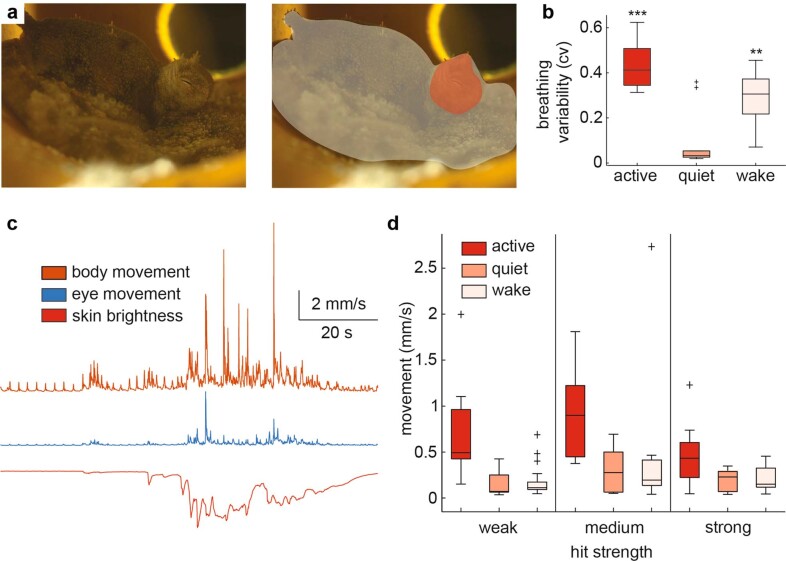
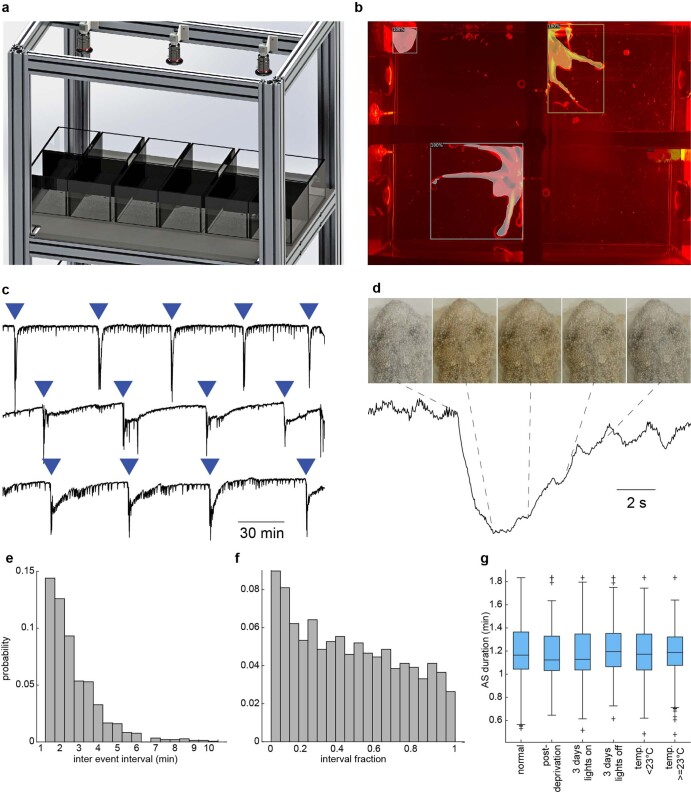
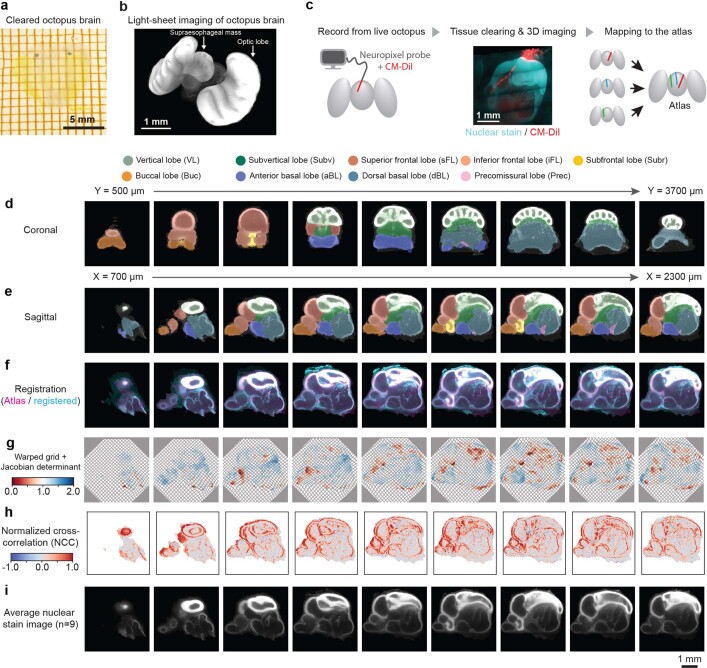
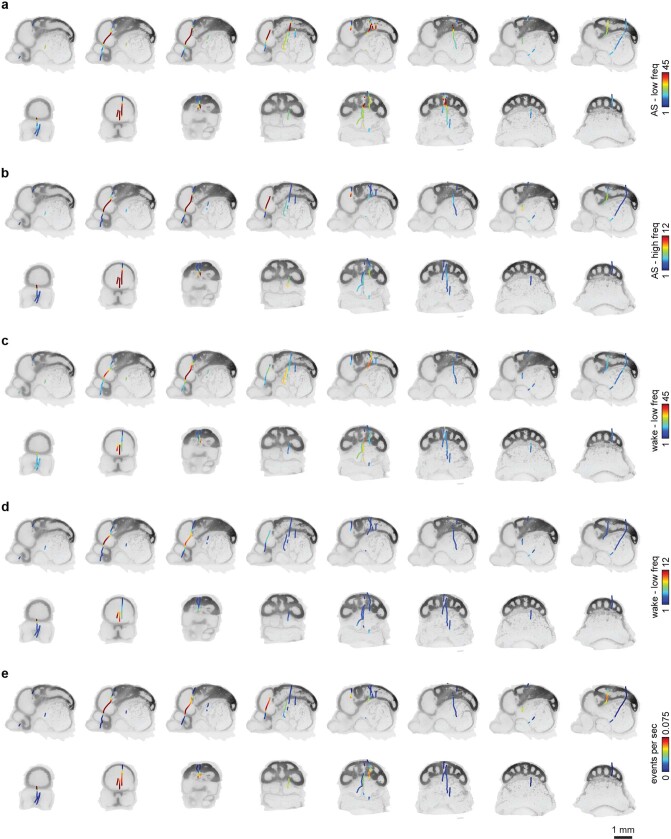
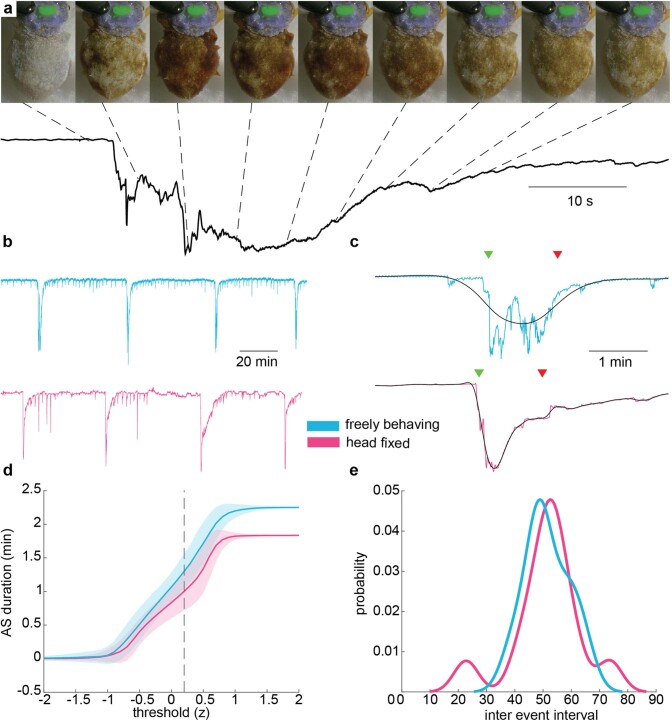
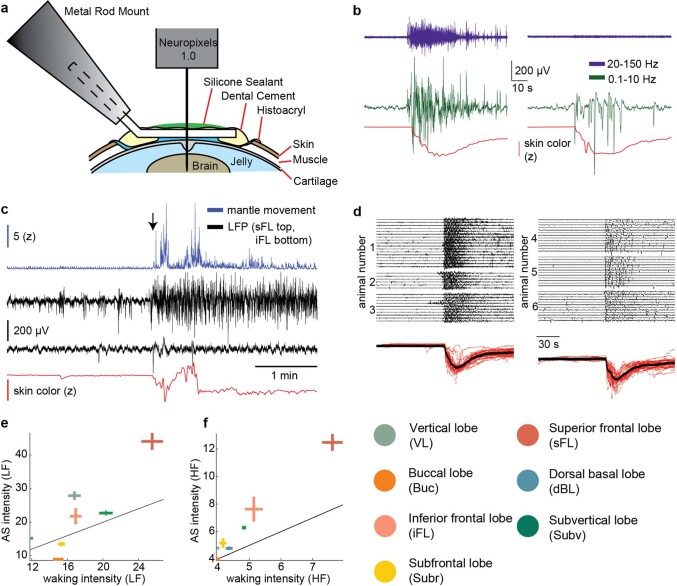
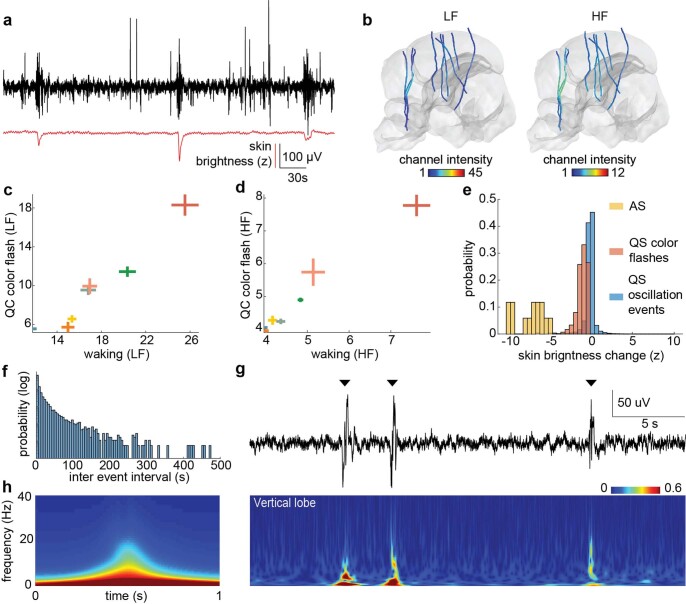
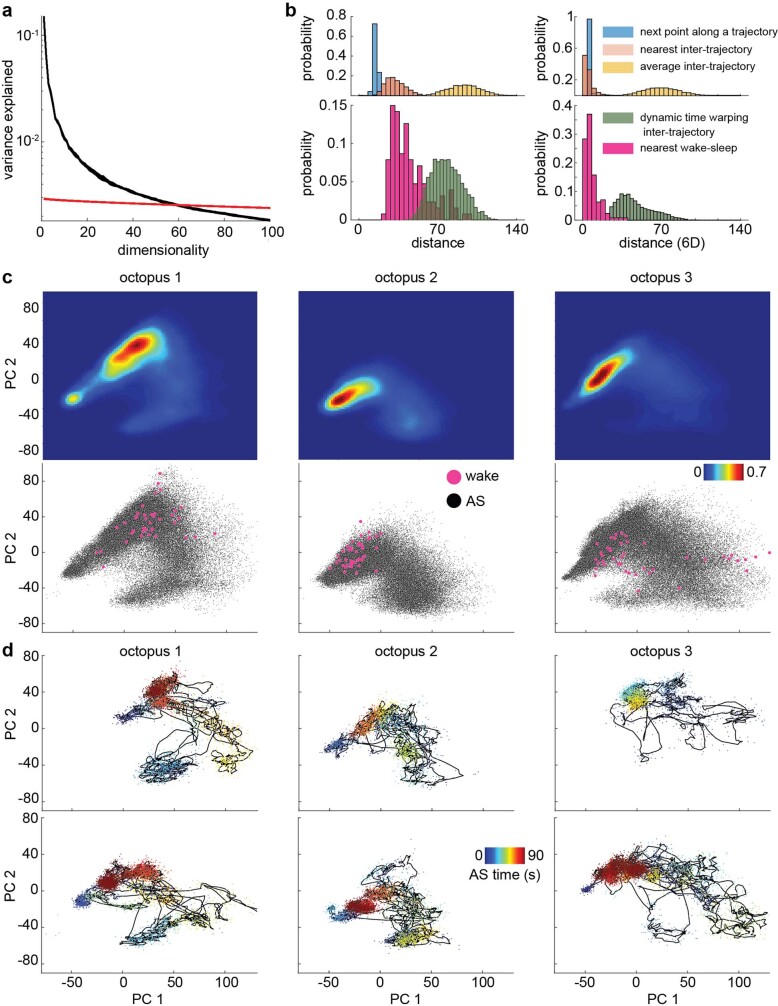
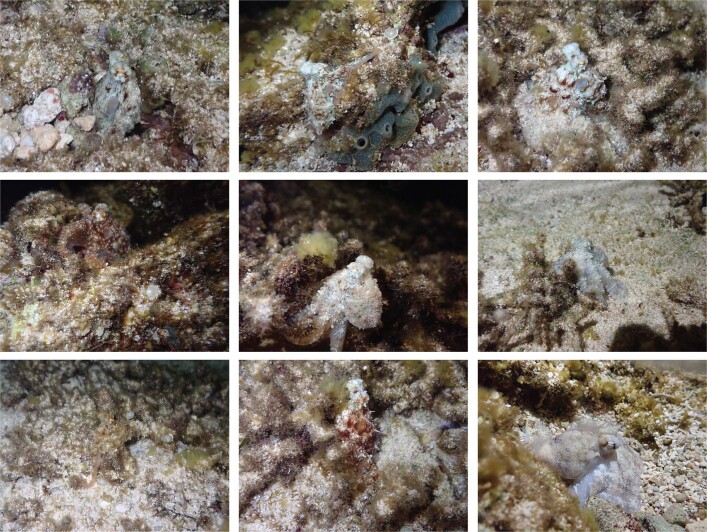
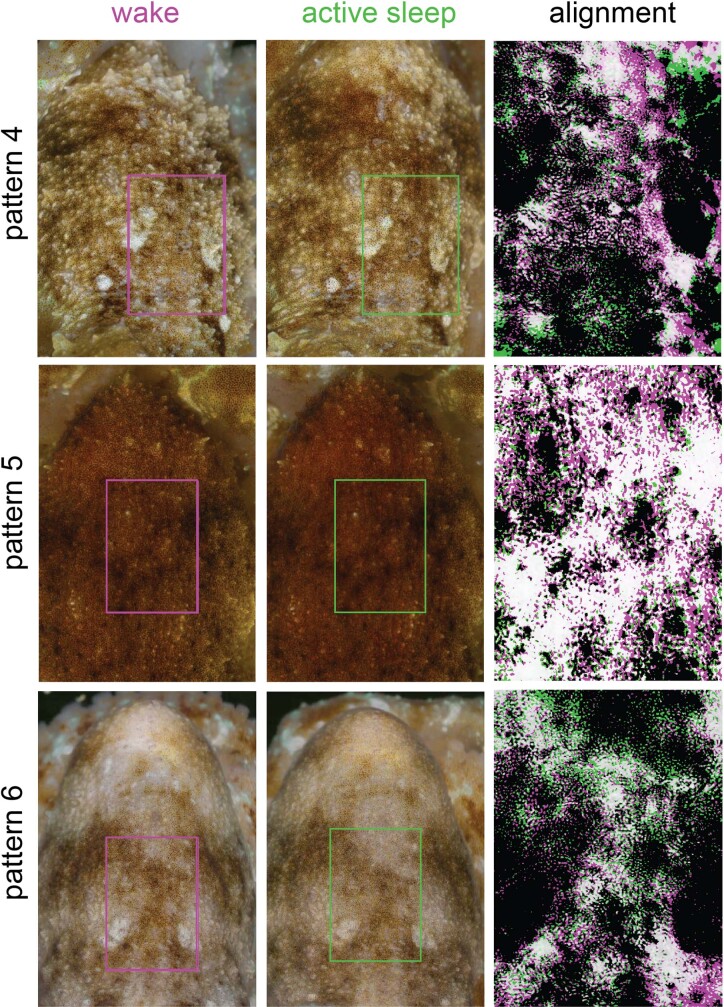
While sleeping, many vertebrate groups alternate between at least two sleep stages: rapid eye movement and slow wave sleep1-4, in part characterized by wake-like and synchronous brain activity, respectively. Here we delineate neural and behavioural correlates of two stages of sleep in octopuses, marine invertebrates that evolutionarily diverged from vertebrates roughly 550 million years ago (ref. 5) and have independently evolved large brains and behavioural sophistication. 'Quiet' sleep in octopuses is rhythmically interrupted by approximately 60-s bouts of pronounced body movements and rapid changes in skin patterning and texture6. We show that these bouts are homeostatically regulated, rapidly reversible and come with increased arousal threshold, representing a distinct 'active' sleep stage. Computational analysis of active sleep skin patterning reveals diverse dynamics through a set of patterns conserved across octopuses and strongly resembling those seen while awake. High-density electrophysiological recordings from the central brain reveal that the local field potential (LFP) activity during active sleep resembles that of waking. LFP activity differs across brain regions, with the strongest activity during active sleep seen in the superior frontal and vertical lobes, anatomically connected regions associated with learning and memory function7-10. During quiet sleep, these regions are relatively silent but generate LFP oscillations resembling mammalian sleep spindles11,12 in frequency and duration. The range of similarities with vertebrates indicates that aspects of two-stage sleep in octopuses may represent convergent features of complex cognition.


Conflict of interest statement

The authors declare no competing interests.

Figures

Fig. 1
Fig. 1. Behavioural correlates of octopus two-stage sleep.
a, Mean skin brightness over time during an active rest bout. The top shows images of octopus body, viewed from the top with head facing up, from throughout the active bout. b, Recording mean skin brightness over longer timescales reveals rhythmic alternation between AS and QS. cf, Relative to QS, AS bouts see an increase in eye movements (c), body movements (d), breathing rate (breaths per minute) (e) and breathing variability (coefficient of variation) (f). Two-sided Wilcoxon sign rank tests (quiet versus active), P = 0.00025, 0.00033, 0.00018, 0.00077, n = 10 bouts, three animals. g, QS between two active bouts is characterized by repeated flashes of colouration. Rows begin at active bout start, ordered by time to the following active bout (n = 6 animals, high-pass filtered 0.005 Hz for display). h, Active bout inter-event interval is temperature dependent (n = 243 bouts, ten animals). i,j, Circadian rhythm in active bout rate persists over 3 days of constant light (i) or darkness (j) (n = 6 animals, Methods).
Fig. 2
Fig. 2. Testing behavioural criteria of sleep.
a, Relative to waking, animals show heightened arousal threshold to mechanical stimulation during QS and AS bouts. Weak (6 dbV), medium (40 dbV) and strong (86 dbV) hit strengths. Two-sided Wilcoxon sign rank tests, P = 0.19, 0.27, 0.0001, 0.0039, 0.0039, 0.0002, 0.0078, 0.002 and 0.002, n = 13, 12, 21, 9, 9, 13, 8, 10 and 10 trials (left to right), from n = 5 animals. b, Increase in active bout rate following 2-day deprivation. Wilcoxon rank sum tests, P = 0.0065, 0.0216 for night 1 and night 2, following deprivation. n = 15/37 and 8/31 bouts (pre-/post-), from six animals. c, Schematic of AS bout interruption experiment. d, The period of QS separating two active bouts shortens following active bout interruption. Wilcoxon rank sum test, P = 3.0 × 10−6, n = 22/27 bouts (normal/interrupted) from three animals.
Fig. 3
Fig. 3. Neural correlates of AS.
a, Atlas of the supra-oesophageal mass, onto which all Neuropixels recordings were mapped. b, LFP power spectrum during AS, QS and wake taken from sFL (solid lines) and VL (dashed lines). c,d, Representative LFP signals from sFL (c) and VL (d) at the onset of AS are shown as the top black lines. The red lines underneath represent mean skin brightness, showing the behavioural onset of AS. The bottom shows spectrograms of the corresponding LFP signals (normalized 0–1, Methods) e,f, LFP signal during AS. n = 9 Neuropixels recordings were mapped to the atlas. Each probe is coloured with the intensity of low (0.1–10 Hz) (e) and high (20–150 Hz) (f) frequency oscillations. g,h, LFP signal during the wake phase: low, 0.1–10 Hz (g) and high, 20–150 Hz (h). i,j, Violin plots showing the intensity of low- (i) and high- (j) frequency oscillations during AS, QS and wake phases. All channels from n = 9 probes were pooled together.
Fig. 4
Fig. 4. Neural correlates of QS.
a, The top shows the LFP recorded in the sFL during QS, showing oscillatory events (arrow heads) and reduced activity relative to other behavioural states. The bottom shows a spectrogram of top LFP (normalized 0–1, Methods). b, Expanded view of burst in (a) (red arrow head). c, Average spectrogram of oscillatory events (n = 3,268, single recording). d, Oscillatory events during QS. n = 9 Neuropixels recordings were mapped to the atlas. Probe colour relates to the average oscillatory event rate. e, Violin plot showing the oscillatory event rate averaged over electrodes in each area. The inset shows that VL and Subv was divided anterior-posteriorly (Methods), showing higher oscillatory event rates anteriorly.
Fig. 5
Fig. 5. Dynamics of AS skin patterning.
a, Two example AS bout trajectories ((i) and (ii)) projected onto the first two principal components of AS pattern space. Large dots in (i) show points sampled every 10 s from throughout the trajectory. b, Histograms showing distributions of pattern distances between (blue) nearest points in time along a trajectory, (pink) nearest points between trajectories, and (yellow) inter-trajectory distance at 0 time lag. Values are averages over AS bouts. c, The top row shows octopus 1 skin patterns at 10-s intervals along the trajectory in a (i). The bottom rows show nearest skin patterns to each image in the top seed trajectory, for other trajectories of octopus 1 and for other octopuses. d, Example pairs of similar waking and sleeping patterns. The right column shows non-linear alignment of rectangular regions in the left and middle columns, with brightness thresholded to show pattern match (white colour, Methods).
Extended Data Fig. 1
Extended Data Fig. 1. Movements during active bouts.
a) Example image of an octopus during active sleep, and manual segmentation of body regions for movement tracking. b) QS shows decreased variability in breathing rate (coefficient of variation) compared to active bouts/wake. Two-sided Wilcoxon rank sum tests, p = 0.00077 (QS-active), 0.0076 (QS-wake), N = 10,10,9 bouts (active, QS, wake) from 3 animals. c) Time course of increased movements (optic flow magnitude, Methods) during an active bout, identified by changes in skin brightness. d) Baseline movements preceding arousal threshold experiments (1s before hit time). N = 13, 12, 21, 9, 9, 13, 8, 10, 10 trials (left to right), from N = 5 animals.
Extended Data Fig. 2
Extended Data Fig. 2. Coloration changes during sleep.
a) Rendering of experimental filming setup. b) Example image, taken at night under red lighting, with octopuses segmented using a Mask R-CNN. 100% refers to the network’s confidence of correct identification. c) Time series of mean skin brightness of three octopuses, simultaneously recorded and automatically segmented using a Mask R-CNN. Blue arrowheads: active rest bouts (manually detected, Methods). d) An example flash of coloration during QS, recorded at high resolution. Top: example images throughout the event. Bottom: mean skin brightness. e) QS colour flash inter-event interval. 3/1437 intervals omitted for display. f) QS colour flash occurrence rate decreases as a function of the fraction of time to the next active bout (linear regression R^2 = 0.77, F = 61.8, p = 0, N = 20 histogram bins from 1482 events, 6 animals). g) Active bout duration remains constant through manipulations other than decreasing the temperature. N = 528, 131, 316, 317, 164, 178 bouts from N = 6, 6, 6, 6, 10, 10 animals.
Extended Data Fig. 3
Extended Data Fig. 3. Octopus brain atlas and Neuropixels mapping.
a) Adult O. laqueus brain, cleared with CUBIC (Methods). b) 3D rendering of the cleared octopus brain imaged with a light sheet microscope. c) Neuropixels mapping workflow. Neuropixels probe was coated with CM-DiI to leave fluorescent labelling of penetration track in the brain. The brain was cleared and imaged using a light sheet microscope with dual channels (nuclear staining and CM-DiI). Using the nuclear staining channel, we computed the mapping to atlas space. d) Coronal sections of O. laqueus brain atlas. e) Sagittal sections of O. laqueus brain atlas. f) Representative result of brain registration, where atlas (magenta) and a registered brain (cyan) are overlaid. g) Representative warp field generated by registration, overlaid with corresponding Jacobian determinant. h) Voxel-wise normalised cross-correlation map between the atlas nuclear staining image and registered brain. (Methods) i) An average nuclear staining image generated by N = 9 brains independently mapped to the atlas.
Extended Data Fig. 4
Extended Data Fig. 4. Visualisation of Neuropixels probes after brain registration.
a,b) Sagittal (top) and coronal (bottom) slices through 3D reference brain volume, showing mapped Neuropixels probe locations (Methods). Probes are coloured by low (0.1 - 10 Hz, a) and high (20 - 40 Hz, b) frequency oscillation of LFP signal during AS. c,d) Same plot as in a) and b) for wake. e) Oscillatory bursts during QS.
Extended Data Fig. 5
Extended Data Fig. 5. Head fixed vs freely moving active sleep.
a) Top: Images of an octopus taken throughout the AS bout (top-down view, images taken 5 s apart). Bottom: mean skin brightness over time during the bout. b) Mean skin brightness over time shows QS punctuated rhythmically by AS bouts in freely behaving animals (top) and during head fixation (bottom). c) Zoomed in view of single AS bouts, showing filtered data used for calculating AS duration (black), start and end times (green and red arrowheads) for freely behaving and head fixed animals. Qualitative differences between experimental conditions possibly reflect different levels of sleep depth, or recording differences (whole body vs mantle). d) AS bout duration is similar in head fixed (N = 76 bouts from 9 animals) and freely behaving (N = 478 bouts from 6 animals) conditions under a range of detection thresholds (Methods). Error band: ±1 SD. e) Kernel density estimates of AS bout inter-event intervals are similar in head fixed and freely behaving animals (Normal distribution kernel, freely behaving animal data (N = 14) temperature matched to head fixed data (N = 12), >23.5 °C and <24.5 °C.
Extended Data Fig. 6
Extended Data Fig. 6. Neural correlates of active sleep.
a) Schematic of head fixation technique. b) LFP recordings from the sFL (left) and VL (right), as in Fig. 3b,c, filtered for low-frequency (LF) (0.1-10 Hz) and high-frequency (HF) (20-150 Hz) activity. c) Time around a sleep-wake transition (black arrow) demonstrating recording stability. Neural activity in the sFL (black, top) increases and mantle coloration (red) darkens upon waking. Activity in the iFL (black, bottom), remains quiet. There are two periods of transient large movements, which are not prominent in either LFP recording. d) LFP centred on AS start time (rows: different AS bouts), showing reliability in AS related LFP activity from sFL (left) and VL (right) across animals. e) Relationship between low-frequency (0.1-10 Hz) LFP activity strength during waking and AS. Crosses: mean ± 95% confidence interval for all electrodes located in a brain region. Line: Y = X. N = 583, 477, 85, 81, 84, 239, 395 electrodes from N = 8, 3, 3, 2, 3, 3, 6 animals for VL, sFL, iFL, Buc, Subr, dBL, Subv respectfully. f) As e) but for high-frequency (20-150 Hz) LFP activity strength.
Extended Data Fig. 7
Extended Data Fig. 7. Neural correlates of quiet sleep.
a) Example LFP recording from the sFL and skin brightness trace during QS, showing increases in neural activity at times of QS colour flashes. b) low-frequency (LF) (0.1-10 Hz) and high-frequency (HF) (20-150 Hz) activity across recording electrodes during QS. Colour scales as in Fig. 3e–h. c) Relationship between low-frequency LFP activity strength during waking and QS colour flashes. Crosses correspond to the mean ± 95% confidence interval for all electrodes located in a brain region. Colours denote brain regions, as in Extended Data Fig. 6. N = 583, 477, 85, 81, 84, 239, 395 electrodes from N = 8, 3, 3, 2, 3, 3, 6 animals for VL, sFL, iFL, Buc, Subr, dBL, Subv respectfully. d) As d) but for high-frequency LFP activity strength. e) Distributions of the magnitude of skin brightness change for AS bouts, QS colour flashes, and QS oscillation events. f) QS oscillation event inter-event interval distribution. g) Top: Example LFP recording (filtered 0.5-150 Hz for display) from the anterior VL during QS, showing detected QS oscillatory events (arrowheads). Bottom: Spectrogram of above VL LFP recording (normalised 0-1, Methods). h) Average spectrogram over QS oscillatory events detected in the anterior VL (N = 2111, single recording, colour scale as in h).
Extended Data Fig. 8
Extended Data Fig. 8. Dynamical landscape of skin pattern space.
a) Black traces: Variance explained as a function of principal component dimension for 10 random draws of 10,000 samples. (58±6% of variability explained at 60 dimensions, 285,986 images from 3 animals). Red traces: As black, after independent shuffling of features. b) Left Bottom: (Green) Average inter-trajectory distance distribution after dynamic time warping. (Magenta) Distribution of distances between waking patterns and the closest AS pattern. Top: Distance distributions as in Fig. 4b. Right: Similar results as left but for data projected onto top 6 PCs. Silhouette score: 0.076±3.148. c) Top: Histogram of occupancy within the top two principal components of AS pattern space, separated by octopus. Occupancy was normalised to the peak occupancy bin (Gaussian smoothing, sd = 2 bins). Bottom: Projection of AS (black) and waking (magenta) points onto the first two principal components. d) Two example AS trajectories from each of three animals, projected onto the first two principal components.
Extended Data Fig. 9
Extended Data Fig. 9. O. laqueus patterns in nature.
A collection of images of octopuses adopting different waking skin patterns in different background environments. Top left image shows an animal peeking out of its den, where it sleeps during the day.
Extended Data Fig. 10
Extended Data Fig. 10. Similar patterns during wake and AS.
Further example pairs of similar waking and sleeping patterns (see Fig. 4d). Right column shows nonlinear alignment of rectangular regions in left and middle columns, with brightness thresholded to display pattern match (white colour, Methods).

References

    1. Shein-Idelson M, Ondracek JM, Liaw H-P, Reiter S, Laurent G. Slow waves, sharp waves, ripples, and REM in sleeping dragons. Science. 2016;352:590–595. doi: 10.1126/science.aaf3621. - DOI - PubMed
    1. Aserinsky E, Kleitman N. Regularly occurring periods of eye motility, and concomitant phenomena, during sleep. Science. 1953;118:273–274. doi: 10.1126/science.118.3062.273. - DOI - PubMed
    1. Ookawa T, Gotoh J. Electroencephalographs study of chickens: periodic recurrence of low voltage and fast waves during behavioral sleep. Poult. Sci. 1964;43:1603–1604. doi: 10.3382/ps.0431603. - DOI
    1. Leung LC, et al. Neural signatures of sleep in zebrafish. Nature. 2019;571:198–204. doi: 10.1038/s41586-019-1336-7. - DOI - PMC - PubMed
    1. Wanninger, A. & Wollesen, T. The evolution of molluscs. Biol. Rev. Camb. Philos. Soc.10.1111/brv.12439 (2018). - PMC - PubMed

Publication types