. 2023 Jul;619(7969):371-377.
doi: 10.1038/s41586-023-06255-6. Epub 2023 Jun 28.

Phase separation of FSP1 promotes ferroptosis

Affiliations

Phase separation of FSP1 promotes ferroptosis

Toshitaka Nakamura et al. Nature. 2023 Jul.

Abstract

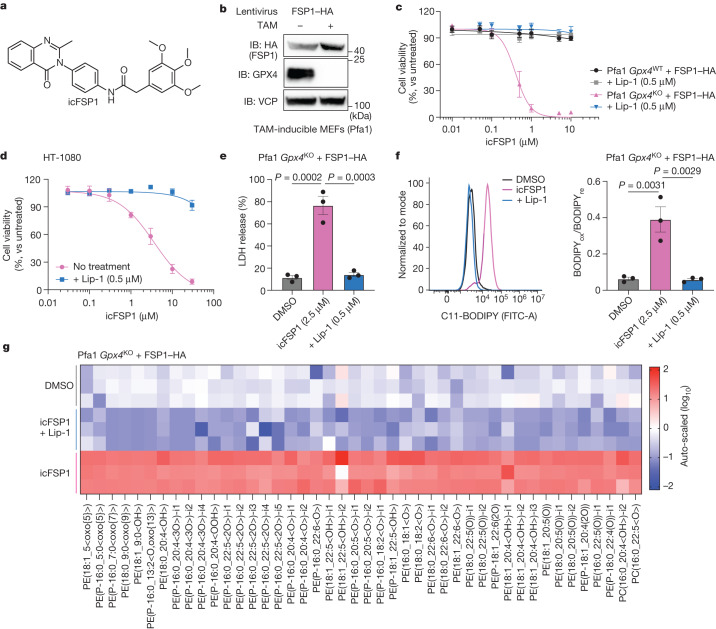
Ferroptosis is evolving as a highly promising approach to combat difficult-to-treat tumour entities including therapy-refractory and dedifferentiating cancers1-3. Recently, ferroptosis suppressor protein-1 (FSP1), along with extramitochondrial ubiquinone or exogenous vitamin K and NAD(P)H/H+ as an electron donor, has been identified as the second ferroptosis-suppressing system, which efficiently prevents lipid peroxidation independently of the cyst(e)ine-glutathione (GSH)-glutathione peroxidase 4 (GPX4) axis4-6. To develop FSP1 inhibitors as next-generation therapeutic ferroptosis inducers, here we performed a small molecule library screen and identified the compound class of 3-phenylquinazolinones (represented by icFSP1) as potent FSP1 inhibitors. We show that icFSP1, unlike iFSP1, the first described on-target FSP1 inhibitor5, does not competitively inhibit FSP1 enzyme activity, but instead triggers subcellular relocalization of FSP1 from the membrane and FSP1 condensation before ferroptosis induction, in synergism with GPX4 inhibition. icFSP1-induced FSP1 condensates show droplet-like properties consistent with phase separation, an emerging and widespread mechanism to modulate biological activity7. N-terminal myristoylation, distinct amino acid residues and intrinsically disordered, low-complexity regions in FSP1 were identified to be essential for FSP1-dependent phase separation in cells and in vitro. We further demonstrate that icFSP1 impairs tumour growth and induces FSP1 condensates in tumours in vivo. Hence, our results suggest that icFSP1 exhibits a unique mechanism of action and synergizes with ferroptosis-inducing agents to potentiate the ferroptotic cell death response, thus providing a rationale for targeting FSP1-dependent phase separation as an efficient anti-cancer therapy.


Conflict of interest statement

M.C., B.P. and T.N. hold patents for some of the compounds described herein, and M.C. and B.P. are co-founders and shareholders of ROSCUE Therapeutics GmbH. The other authors declare no competing interests.

Figures

Fig. 1
Fig. 1. icFSP1 induces ferroptosis in synergy with GPX4 inhibition.
a, Chemical structure of icFSP1. b, Representative immunoblot (IB) analysis of GPX4, HA (FSP1) and VCP expression in TAM-induced Gpx4-knockout mouse embryonic fibroblasts (MEFs; Pfa1 cells) stably overexpressing HA-tagged hFSP1 from one of two independent experiments. c, Cell viability of wild-type or knockout Gpx4 (Gpx4WT or Gpx4KO, respectively) Pfa1 cells stably expressing HA-tagged hFSP1 treated with icFSP1 alone or in combination with the ferroptosis inhibitor liproxstatin-1 (Lip-1; 0.5 µM) for 48 h. d, Cell viability of HT-1080 cells treated with icFSP1 and 0.5 µM Lip-1 for 72 h. e, Lactate dehydrogenase (LDH) release determined after treating Gpx4-knockout Pfa1 cells overexpressing HA-tagged hFSP1 with DMSO, 2.5 µM icFSP1, or 2.5 µM icFSP1 + 0.5 µM Lip-1 for 24 h. f, Lipid peroxidation evaluated by C11-BODIPY 581/591 staining after treating Gpx4-knockout cells stably overexpressing HA-tagged hFSP1 with DMSO, 2.5 µM icFSP1, or 2.5 µM icFSP1 + 0.5 µM Lip-1 for 3 h. Representative plots of one of three independent experiments (left) and quantified median values of three independent experiments (right) are shown. BODIPYox/BODIPYre, ratio of oxidized to reduced BODIPY. Data represent the mean ± s.e.m. of three (c,e,f) or four (d) independent experiments. P values were calculated by one-way ANOVA followed by Tukey’s multiple-comparison test (e,f). g, Lipid peroxidation profiles measured by liquid chromatography and tandem mass spectrometry (LC–MS/MS) after treatment of Gpx4-knockout Pfa1 cells stably overexpressing HA-tagged hFSP1 with DMSO, 5 µM icFSP1, or 5 µM icFSP1 + 0.5 µM Lip-1 for 5 h. The heat map shows three technical replicates from one of two independent experiments. Source data
Fig. 2
Fig. 2. icFSP1 indirectly inhibits FSP1 by inducing condensate formation.
a, Schematic representation of the FSP1 enzyme activity assay using resazurin as the substrate. b, Representative dose–response curves for the effect of iFSP1 and icFSP1 on hFSP1 activity using recombinant purified hFSP1 protein. Data represent the mean ± s.d. of 3 wells of a 96-well plate from one of three independent experiments. c, Representative time-lapse fluorescence images acquired immediately after treatment of wild-type Gpx4 Pfa1 cells stably overexpressing hFSP1–EGFP–Strep with 2.5 µM icFSP1. Scale bars, 10 μm. Representative results from one of three independent experiments. See also Supplementary Video 1. d, Number of condensates per cell quantified from time-lapse images at different time points (0, 60, 120, 180 and 240 min) after treatment obtained from one of two independent experiments. Dots represent each cell and n corresponds to cell number (n = 129, 124, 130, 130 and 134 (left to right)). P values were calculated by one-way ANOVA followed by Dunnett’s multiple-comparison test. e, Representative time-lapse fluorescence images before and after treatment of Gpx4-knockout Pfa1 cells stably overexpressing hFSP1–mTagBFP with 10 µM icFSP1 in FluoroBrite DMEM containing propidium iodide (PI; 0.2 µg ml–1). Cells were prestained with 5 µM Liperfluo for 1 h. Scale bars, 10 μm. Representative results from three independent experiments. Differential interference contrast (DIC) is displayed with refractive index (RI). See also Supplementary Video 2. Source data
Fig. 3
Fig. 3. FSP1 condensates are liquid droplets.
a, Representative time-lapse fluorescence images before and after treatment of wild-type Gpx4 Pfa1 cells stably overexpressing hFSP1–EGFP–Strep with 2.5 µM icFSP1. Representative results are shown from one of three independent experiments. Scale bars, 10 μm (2 µm for zoomed-in images). Arrowheads indicate fusion events of individual condensates. See also Supplementary Video 3. b, Reversibility of hFSP1 condensates. Representative time-lapse fluorescence images before and after treatment of wild-type Gpx4 Pfa1 cells stably overexpressing hFSP1–EGFP–Strep with 2.5 µM icFSP1. After treatment of cells with icFSP1 for 240 min, the medium was replaced with fresh medium without icFSP1 and recordings were restarted. Scale bars, 10 μm. Representative results from one of three independent experiments. See also Supplementary Video 4. c, FRAP assays after treatment of hFSP1–EGFP–Strep-overexpressing wlid-type Gpx4 Pfa1 cells with 2.5 µM icFSP1 for 120 min. Top, greyscale images corresponding to representative FRAP images immediately before and after photobleaching. Bottom, lookup table (LUT) images showing enlarged views of the areas in red rectangles in the top FRAP images. Scale bars, 10 μm. Representative results from one of three independent experiments. See also Supplementary Video 5. d, Quantified FRAP rate of each condensate. Data represent the mean ± s.d. of five condensates from c. Representative results from one of three independent experiments. e, FSP1 condensation in vitro. Representative fluorescence images of 1.5 µM EGFP–Strep and hFSP1–EGFP–Strep purified from transfected HEK29T cells were obtained immediately after mixing with or without 10% PEG. Scale bars, 10 μm. Representative results from one of three independent experiments are shown. Source data
Fig. 4
Fig. 4. Distinct structural features of FSP1 are required for phase separation.
a, Schematic diagram of the FSP1 mutants. b, Representative images of Pfa1 cells overexpressing hFSP1–EGFP–Strep mutants treated with 2.5 µM icFSP1. Scale bars, 10 μm. c, Representative images of Pfa1 cells overexpressing wild-type hFSP1–EGFP–Strep or the S187C, L217R or Q319K variant treated with 2.5 µM icFSP1. Scale bars, 10 μm. Data are shown as the mean ± s.d. of n = 3 or 4 different fields from one of three independent experiments (b,c). Statistical analysis was performed by one-way ANOVA followed by Dunnett’s multiple-comparison test (c). d, Representative immunoblot analysis of Pfa1 cells overexpressing hFSP1–HA from one of two independent experiments. e, Cell viability measured after treatment of Gpx4-knockout Pfa1 cells overexpressing wild-type hFSP1 or the S187C, L217R or Q319K variant with icFSP1 for 24 h. Data represent the mean ± s.d. of n = 3 wells from one of four independent experiments. f, icFSP1 inhibits tumour growth in vivo. hFSP1–HA-overexpressing Gpx4 and Fsp1 double knockout (Gpx4/Fsp1 DKO) B16F10 cells were subcutaneously implanted into C57BL/6J mice. At day 6, mice were randomized and treatment was started with icFSP1 (50 mg kg–1 intraperitoneally twice a day, n = 7) or vehicle (n = 6). Data represent the mean ± s.d. from one of two independent experiments. Statistical analysis was performed by two-way ANOVA followed by Bonferroni’s multiple-comparison test (left) or two-sided unpaired t test (right). g, Tumour samples from the end of the in vivo studies stained with anti-HA (hFSP1). h, Wild-type or Q319K hFSP1 tumour samples visualized with HA immunostaining. Representative zoomed-in images from Extended Data Fig. 8h are shown from one of three different tumour samples from one of two independent experiments (g,h). Arrowheads indicate FSP1 condensates (g,h). Scale bars, 20 µm (g) and 10 µm (h). i, Graphical abstract depicting icFSP1-induced FSP1 condensate formation, lipid peroxidation and ferroptosis. Image created using BioRender.com. Source data
Extended Data Fig. 1
Extended Data Fig. 1. Development of icFSP1 and synergistic effects of icFSP1 with ferroptosis inducers in a variety of human cancer cells.
a. Structure and EC50 values of icFSP1 derivatives. b. Cell viability was measured after treating Pfa1 Gpx4 KO cells stably overexpressing FSP1-HA with icFSP1 along with different cell death inhibitors against ferroptosis (Lip-1 and ferrostatin-1 [Fer-1] or an iron chelator deferoxamine [DFO]), apoptosis (z-VAD-FMK), necroptosis (Nec-1s), pyroptosis (MCC950), and parthanatos (Olaparib). Heatmaps represent the mean of 3 wells of a 96 well plate from one out of 2 independent experiments. c. Cell viability was measured after treating HT-1080, A375, 786-O, MDA-MB-436 and H460 cells with different ferroptosis inducers (RSL3, ML210, erastin, FIN56 and FINO2 for 48 h, BSO for 72 h). Heatmaps represent one out of 2 independent experiments. 0.5 µM Lip-1 was used as control. d. Cell viability was measured after treating HT-1080, HT-29 and THP-1 cells with icFSP1 and respective cell death inducers (staurosporine for apoptosis, TNFα + smac mimetic (S) + z-VAD-FMK (Z) for necroptosis, and nigericin for pyroptosis) for 4 h (in case of pyroptosis) or 24 h (others). Heatmaps represent one out of 2 independent experiments. 0.5 µM Lip-1, 30 µM z-VAD-FMK, 10 µM Nec-1s and 10 µM MCC950 were used as positive controls for each mode of cell death. e. Representative immunoblot analysis of GPX4, FSP1 (AMID), SLC7A11(3A12), ACSL4 and VCP expression in the different cell lines from one out of 2 independent experiments. f. Representative immunoblot analysis of GPX4, FSP1, Flag (Cas9) and actin expression in HT-1080 cells with doxycycline (Dox)-inducible expression of Flag-Cas9 and stably expressing different sgRNAs targeting FSP1 (sgFSP1) from one out of 2 independent experiments. g. Cell viability was measured after treating HT-1080 cells expressing dox-inducible Flag-Cas9 and stably expressing sgFSP1 with doxycycline for 72 h. 0.5 µM Lip-1 was used as a positive control for the prevention of ferroptosis. h. Cell viability in HT-1080 cells treated with iFSP1 or icFSP1 and 0.5 µM Lip-1 for 72 h. i. Cell viability in HEK293T cells treated with iFSP1 or icFSP1 and 0.5 µM Lip-1 for 72 h. j. Cell viability in human PBMC cells treated with iFSP1 or icFSP1 for 24 h. k. Representative immunoblot analysis of FSP1 and VCP expression in WT and FSP1 KO different cancer cell lines from one out of 2 independent experiments. l. Cell viability in FSP1 WT or FSP1 KO MDA-MB-436, 786-O, A375, H460 cells treated with 5 µM iFSP1 or icFSP1 for 48 h. Data represents the mean ± SD of 3 wells of a 96 well or 384 well plates from one out of 2 independent experiments (g-i, l) or a single experiment (j). Two-way ANOVA followed by Tukey’s multiple comparison tests (g, j). Source data
Extended Data Fig. 2
Extended Data Fig. 2. icFSP1 fails to inhibit mouse FSP1.
a. Cell viability was measured after treating 4T1 cells with icFSP1 and RSL3 for 48 h. b. Cell viability was measured after treating B16F10 cells with icFSP1 and RSL3 for 48 h. c. Cell viability was measured after treating Rat1 cells with icFSP1 and RSL3 for 48 h. d. Representative immunoblot analysis of GPX4, FSP1 (14D7), SLC7A11, ACSL4 and VCP expression in different cell lines from one out of 2 independent experiments. e. Representative immunoblot analysis of GPX4, FSP1, and VCP expression of 4T1 Gpx4 WT cells, 4T1 Gpx4 KO cells stably overexpressing hFSP1-HA or mFsp1-HA, B16F10 Gpx4 WT/Fsp1 WT cells, B16F10 Gpx4 KO/Fsp1 KO cells stably overexpressing hFSP1-HA or mFsp1-HA from one out of 2 independent experiments. f. Cell viability was measured after treating 4T1 Gpx4 WT cells, 4T1 Gpx4 KO cells stably overexpressing hFSP1-HA or mFsp1-HA with icFSP1 and 0.5 µM Lip-1 for 48 h. g. Cell viability was measured after treating B16F10 Gpx4 WT/Fsp1 WT cells, B16F10 Gpx4 KO/Fsp1 KO cells stably overexpressing hFSP1-HA or mFsp1-HA with icFSP1 and 0.5 µM Lip-1 for 48 h. h. Cell viability was measured after treating Pfa1 Gpx4 WT and Gpx4 KO cells stably overexpressing hFSP1-HA or mFsp1-HA with icFSP1 and 0.5 µM Lip-1 for 48 h. i. Lipid peroxidation was measured by C11-BODIPY 581/591 staining after treating Pfa1 Gpx4 KO cells stably overexpressing Fsp1-HA with DMSO or 2.5 µM icFSP1 and 0.5 µM Lip-1 for 3 h. Representative plots of one out of 3 independent experiments (left) and quantified median values (right, mean ± SEM) of 3 independent experiments are shown. j. Cell viability was measured after treating Pfa1 Gpx4 WT cells stably overexpressing FSP1 from different species (i.e., Homo sapiens (human), Mus musculus (mouse), Rattus norvegicus (rat), Gallus gallus (chicken), and Xenopus laevis (frog)) with RSL3 for 24 h. k. Representative immunoblot analysis of GPX4, HA (FSP1) and VCP expression in Pfa1 Gpx4 WT and Gpx4 KO cells stably overexpressing orthogonal FSP1 from one out of 2 independent experiments. l. Cell viability was measured after treating Pfa1 Gpx4 KO cells stably expressing FSP1 with icFSP1 for 24 h. Data represents the mean ± SD of 3 wells of a 96 well plate from one out of 2 independent experiments (f,g,h,j,l). Heatmaps represent the mean of 3 independent experiments (a-c). Source data
Extended Data Fig. 3
Extended Data Fig. 3. icFSP1 has no impact on FSP1 enzyme activity and expression.
a. Representative reaction curves of in vitro assay. iFSP1 toward recombinant hFSP1 activity was assessed by fluorescent (FL) intensity of reduced form of resazurin. b. Representative reaction curves of in vitro assay. icFSP1 toward recombinant hFSP1 activity was assessed by FL intensity of reduced form of resazurin. Data represents the mean of 3 wells of a 96 well plate from one out of 3 independent experiments (a,b). c. Schematic representation of the FSP1 enzyme activity assay using menadione as a substrate. d. NADH consumption assay in vitro. Representative reaction curves of the FSP1 enzyme activity assay for measuring NADH consumption. iFSP1 toward recombinant hFSP1 activity was assessed by determining the absorbance of NADH. e. NADH consumption assay in vitro. Representative reaction curves of the FSP1 enzyme activity assay for measuring NADH consumption. icFSP1 toward recombinant hFSP1 activity were assessed by determining the absorbance of NADH. Data represents the curve fitting line and an original single value of one well of a 96-well plate from one out of 3 independent experiments. 0 µM and DMSO samples represent the same samples (d,e). f. Schematic representation of the FSP1 enzyme activity assay using CoQ0 as the substrate. g. NADH consumption assay in vitro. Representative reaction curves of the FSP1 enzyme activity assay for measuring NADH consumption. iFSP1 toward recombinant hFSP1 activity was assessed by determining the absorbance of NADH. h. NADH consumption assay in vitro. Representative reaction curves of the FSP1 enzyme activity assay for measuring NADH consumption. icFSP1 toward recombinant hFSP1 activity were assessed by determining the absorbance of NADH. Data represents the curve fitting line and an original single value of one well of a 96-well plate from one out of 3 independent experiments. 0 µM and DMSO samples represent the same samples (g, h). i. Cell viability was measured after treating Pfa1 Gpx4 KO cells stably overexpressing hFSP1-HA with iFSP1 or icFSP1 for 24 h. j. Lactate dehydrogenase (LDH) release was determined after treating Pfa1 Gpx4 KO hFSP1-HA overexpressing cells with DMSO, 2.5 µM iFSP1 or icFSP1 or 0.5 µM Lip-1 for 24 h. Data represents the mean ± SD of 3 wells of a 96 well plate from one out of 3 independent experiments. P values were calculated by two-way ANOVA followed by Bonferroni’s multiple comparison test (i, j). k. Lipid peroxidation was evaluated by C11-BODIPY 581/591 staining after treating Gpx4 KO cells stably overexpressing hFSP1-HA with DMSO, 2.5 µM iFSP1 or icFSP1 and 0.5 µM Lip-1 for 3 h. Representative plots of one out of 3 independent experiments (left) and quantified median values of 3 independent experiments (right) are shown. Data represents the mean ± SEM of 3 independent experiments (k). one-way ANOVA followed by Tukey’s multiple comparison test. l. Representative immunoblot analysis of GPX4, FSP1 and VCP expression after treating H460 cells with iFSP1 or icFSP1 for 48 h. m. Representative immunoblot analysis of GPX4, FSP1 and VCP expression after treating HT-1080 cells with iFSP1 or icFSP1 for 48 h. n. Immunoblot analysis of GPX4, FSP1 and VCP expression after treating HT-1080 cells with iFSP1 or icFSP1 for 72 h. o. Confocal microscopy fluorescence images after treating Pfa1 Gpx4 WT cells stably overexpressing hFSP1-EGFP-Strep with 2.5 µM icFSP1 or iFSP1 for 4 h. Scale bars, 10 μm. p. Confocal microscopy fluorescence images after treating Pfa1 Gpx4 WT cells stably overexpressing hFSP1-EGFP-Strep or mFsp1-EGFP-Strep with 2.5 µM icFSP1 or iFSP1 treatment for 4 h. Scale bars, 10 μm. Representative results are from one out of 2 independent experiments (l-p). Source data
Extended Data Fig. 4
Extended Data Fig. 4. FSP1 condensates do not localize to specific organelles.
a. Confocal microscopy images of FSP1-EGFP-Strep overexpressing Pfa1 Gpx4 WT cells stained with ER, Golgi and lipid droplet markers under normal cell culture conditions. Scale bars, 5 μm. b. Confocal microscopy images of FSP1-EGFP-Strep overexpressing Pfa1 Gpx4 WT cells after treating with 2.5 µM icFSP1 for 120 min, and subsequently stained with markers for endosome, lysosome, Golgi, ER, lipid droplet, aggresome, ubiquitin and mitochondria. Scale bars, 5 μm. c. Confocal microscopy images of FSP1-EGFP-Strep and Scarlet-G3BP1 overexpressing Pfa1 Gpx4 WT cells after treating with 0 or 2.5 µM icFSP1 for 120 min. Scale bars, 5 μm. d. Confocal microscopy images of H460 or FSP1 KO H460 cells after treating with 0 or 10 µM icFSP1 for 4 h, following stained with FSP1 antibody (14D7). Scale bars, 10 μm. Representative results are from one out of 2 independent experiments (a-d). e. Representative immunoblot analysis of FSP1 and VCP expression in H460 cells and hFSP1-EGFP-Strep overexpressing Pfa1 Gpx4 WT cells from one out of 2 independent experiments. f. Representative immunoblot analysis of FSP1 and actin expression in H460 WT cells and Dox-inducible hFSP1-EGFP-Strep overexpressing H460 FSP1 KO cells after treating with Dox for 48 h from one out of 2 independent experiments. g. Confocal microscopy images of Dox-inducible hFSP1-EGFP-Strep overexpressing H460 FSP1 KO cells after treating with 0.1 µg/mL for 48 h and followed by treating with 0 or 10 µM icFSP1 for 4 h. Scale bars, 10 μm. Representative images from one out of 2 independent experiments (left) and quantified values (right, mean ± SD of 3 independent fields) are shown. One-way ANOVA followed by Dunnett’s multiple comparison test. h. Time-lapse fluorescent images of Pfa1 Gpx4 WT cells stably overexpressing hFSP1-EGFP-Strep before and immediately after treatment with 2.5 µM icFSP1 for the indicated time. Scale bars, 10 μm. Representative results are from one out of 2 independent experiments. Source data
Extended Data Fig. 5
Extended Data Fig. 5. FSP1 forms viscoelastic material.
a. Fluorescence recovery after photobleaching (FRAP) assay after treating Pfa1 Gpx4WT cells stably overexpressing hFSP1-EGFP-Strep with 2.5 µM icFSP1 for 240 min. Greyscale images show representative FRAP images right before and at indicated time points after photo-bleaching. Lookup Table (LUT) images show enlarged red rectangle areas of upper FRAP images. Scale bars, 5 μm. Representative results from one out of 2 independent experiments. See also Supplementary Video 6. b. Quantified FRAP rate of each condensate. Data represents the mean ± SD of 4 condensates from Extended Data Fig. 5a. Representative results from one out of 2 independent experiments are shown. c. FSP1 condensation in vitro. Representative confocal microscopy images of 1.5 µM EGFP-Strep and hFSP1-EGFP-Strep purified from transfected HEK29T cells were obtained immediately after mixing with 2.5 µM icFSP1 with or without 10% PEG. Scale bars, 10 μm. Representative results are shown from one out of 2 independent experiments. d. FRAP assay after incubating 0.5 µM hFSP1-EGFP-Strep with 10 % PEG. LUT images show enlarged red rectangle areas of FRAP images (left and below). Scale bars, 2 μm. Representative results from one out of 2 independent experiments. Quantified FRAP rate of each condensate (right). Data represents the mean ± SD of 4 independent condensates. e. Recombinant non-myristoylated FSP1 (non-myr-FSP1) condensation in vitro. Representative bright field images of 100 µM non-myr-FSP1 expressed and purified from E.coli right after mixing with or without 10% PEG in PCR tubes (top). Representative blight field images (bottom) were obtained using the microscope. Scale bars, 10 μm. Representative results are from one out of 2 independent experiments. f. Absorbance of 600 nm was measured for different concentrations of PEG and non-myr-FSP1. Heatmaps represent the mean of 2 independent experiments. g. Phase diagram of the presence of condensates was determined by microscopy after absorbance measurement (f). h. Absorbance of 600 nm was measured for different concentrations of PEG and icFSP1, non-myr-FSP1. Data represents the mean ± SD from 4 wells of 384 well plates from one out of 2 independent experiments. i. Sedimentation assay of non-myr-FSP1. Representative Coomassie brilliant blue (CBB) staining of non-myr-FSP1 fraction after centrifugation in the presence or absence of 10% PEG. S: supernatant, P: re-suspended pellet. Monomer (Mono, ~ 42 kDa) and estimated oligomerized FSP1 (Poly, ~ 90 kDa) can be observed. j. Immunoblot analysis of non-myr-FSP1 fraction after centrifugation in the presence or absence of 10% PEG. S: supernatant, P: re-suspended pellet. Monomer (Mono, ~ 42 kDa) and estimated oligomerized FSP1 (Poly, ~ 90 kDa) can be observed. The same samples but different gels were used for CBB staining (i) and immunoblot analysis (j). Representative results from one out of 2 independent experiments (i. j). Source data
Extended Data Fig. 6
Extended Data Fig. 6. Myristoylation, IDRs, and LCR are required for the anti-ferroptotic role of FSP1 as well as condensations.
a. IDR and LCR prediction from FSP1 sequence. From MobiDB-lite prediction (top), there are 2 IDRs (1–8, 366-373 amino acid [a.a.]) and one LCR (14–27 a.a.) in FSP1. IUPred2 scores are visualized, and the dashed line shows the threshold; 0.5 (bottom). b. Confocal microscopy images of hFSP1-EGFP-Strep overexpressing Pfa1 Gpx4 WT cells after pre-treating with or without 0.1 µM IMP-1088 for 24 h and subsequently treating with or without 2.5 µM icFSP1 for the indicated time. Scale bars, 10 μm. Representative results from one out of 2 independent experiments. c. FSP1 condensation in vitro. Fluorescent images of 1.5 µM EGFP-Strep and hFSP1-EGFP-Strep mutants purified from transfected HEK29T cells were obtained right after mixing with or without 10% PEG. Scale bars, 10 μm. Representative results from one out of 2 independent experiments of 3 different fields. Quantification results are shown as mean ± SD of n = 3 from one out of 2 independent experiments. Average sizes of condensates were calculated by Fiji/ImageJ. d. Mass spectrometry analysis of recombinant non-myristoylated FSP1-EGFP (non-myr-FSP1-EGFP) and myristoylated FSP-EGFP1 (myr-FSP1-EGFP) purified from E. coli. e. FSP1 condensation in vitro. Representative Fluorescent images represent 15 µM recombinant non-myr or myr-FSP1-EGFP with 0% or 2% PEG in 300 mM NaCl PBS or 10 µM recombinant myr-FSP1-EGFP with 150 mM NaCl in PBS as a lower salt from one out of 2 independent experiments. f. Phase diagram of the presence of condensates was determined by microscopy from one out of 2 independent experiments. g. Time-lapse fluorescent images of Pfa1 Gpx4 WT cells stably overexpressing hFSP1-EGFP-Strep;hFSP1-mTagBFP or hFSP1-G2A-EGFP-Strep;hFSP1-mTagBFP before and immediately after treatment with 2.5 µM icFSP1 for the indicated times. Scale bars, 10 μm. Representative results are from one out of 2 independent experiments. h. Cell viability was measured after treating Pfa1 Gpx4 WT cells stably overexpressing hFSP1 mutants with RSL3 for 24 h. The heatmap represents the mean of 3 wells of 96 well plates from one out of 2 independent experiments. i. Cell viability (top) was measured after treating Pfa1 Gpx4 WT cells stably overexpressing hFSP1 mutants with or without 1 µM TAM for 72 h TAM. Data were normalized by each group of non-treatment with TAM. Immunoblot analysis (bottom) of FSP1 and VCP expression in Pfa1 Gpx4 WT cells stably overexpressing hFSP1 mutants in cells from one out of 2 independent experiments. Data represents mean ± SEM of 3 independent experiments (i). P values were calculated by one-way ANOVA followed by Dunnett’s multiple comparison test (c,i). Source data
Extended Data Fig. 7
Extended Data Fig. 7. Mutational analysis of human FSP1 resistant to icFSP1.
a. Protein sequence alignment of human and mouse FSP1 using Jalview (v2.11.2.6). b. Schematic model of chimeric FSP1 mutants. From MobiDB-lite prediction, there are 2 IDRs (1–7, 366–373 a.a.) and one LCR (10–27 a.a.) in FSP1. Chimeric hmFsp1 was generated from human FSP1 (1–27 a.a.) and mouse Fsp1 (28–373 a.a., marked as blue). c. Confocal microscopy images after treating Pfa1 Gpx4 WT cells stably overexpressing FSP1-EGFP-Strep mutants with and without 2.5 µM icFSP1 for 240 min. Scale bars, 5 μm. Representative results from one out of 2 independent experiments. d. Summary of the viability assay using single point mutations (as indicated) from human to mouse in FSP1-EGFP-Strep expressing constructs. After treating cells with 2.5 µM icFSP1 for overnight, the presence of condensates was determined using a microscope. Human FSP1 is sensitive to icFSP1 (O), while mouse Fsp1 is resistant to icFSP1 (X). 3 mutants show complete resistance (X). This screening was performed once using a 96 well plate. e. Cell viability was measured after treating Pfa1 Gpx4 KO cells stably overexpressing hFSP1 mutants with icFSP1 for 24 h. Heatmaps represent the mean of 3 wells of 96 well plate from one out of 2 independent experiments. f. Saturation transfer difference (STD) spectra of WT hFSP1 or its mutants S187C, L217R and Q319K show binding of icFSP1 (bottom to top). Top spectrum shows a 1D 1H reference spectrum of icFSP1. g. Confocal microscopy images after treating Pfa1 Gpx4 WT cells stably overexpressing human and mouse FSP1-EGFP-Strep or the combination mutant (mFSP1-C187S/R217L/K319Q) with and without 2.5 µM icFSP1 for 240 min. Scale bars, 10 μm. Representative images (left) and quantitative results (right, mean ± SD of 3 different fields) from one out of 2 independent experiments. One-way ANOVA followed by Bonferroni’s multiple comparison test. h. Cell viability was measured after treating Pfa1 Gpx4 KO cells stably overexpressing human and mouse FSP1-HA or the combination mutant with icFSP1 for 24 h. Data represents the mean ± SD of 3 wells of a 96 well plate from one out of 2 independent experiments. i. Predicted cartoon structure of hFSP1 WT (yellow) S187C (green), L217R (cyan), and Q319K (magenta) by AlphaFold2 or ColabFold. Each mutant amino acid residue represents human FSP1 (orange) and mouse FSP1 (dark blue) as sticks. Source data
Extended Data Fig. 8
Extended Data Fig. 8. Targeting of FSP1 by icFSP1 as potential anti-cancer therapy using mouse cells.
a. Pharmacokinetic (PK) parameters of icFSP1 and iFSP1. Plasma concentration was measured after single i.p. administration (10 mg/kg). Data represents mean ± SD from 4 mice of one experiment. b. Summary of microsomal stability analysis of icFSP1 and iFSP1. c. Body weight of tumor-baring mice during the treatment of mice with icFSP1 (50 mg/kg i.p. twice a day, n = 7) and vehicle (n = 6) as a control. These mice are the same as in Fig. 4f. Data represents mean ± SD from one out of 2 independent experiments. d. At the end of the in vivo pharmacological studies, tumors were dissected, cryosectioned and stained with anti-HA to visualize hFSP1 and with anti-4-HNE to visualize the lipid peroxidation breakdown product. Representative confocal microscopy images are shown from one out of 2 independent experiments. Arrowheads indicate FSP1 condensates. Scale bars, 20 µm or 10 µm. e. Immunoblot analysis of HA (FSP1) and VCP expression of B16F10 Gpx4 KO/Fsp1 KO cells stably overexpressing FSP1-WT or the Q319K mutant. Representative results from one out of 2 independent experiments. f. Cell viability was measured after treating B16F10 Gpx4 KO/Fsp1 KO cells stably overexpressing FSP1-WT or Q319K mutants with icFSP1 for 48 h. Data represent mean ± SD of 3 wells from one out of 2 independent experiments. g. icFSP1 inhibits tumor growth of hFSP1 WT but not of FSP1-Q319K expressing cells in vivo. B16F10 Gpx4 KO/Fsp1 KO cells stably expressing hFSP1 WT or Q319K were subcutaneously implanted into C57BL/6J mice (n = 33, in total). Treatment with vehicle (n = 10 for WT and 8 for Q319K) or icFSP1 (50 mg/kg i.p. twice a day, n = 8 for WT and 7 for Q319K) was started from day 6 after randomization. Data represents the mean ± SEM from one out of 2 experiments. P values were calculated by two-way ANOVA followed by Tukey’s multiple comparison test. h. At the end of the in vivo pharmacological studies, tumors were dissected, cryosectioned and stained with anti-HA to visualize hFSP1 and with anti-4-HNE to visualize the lipid peroxidation breakdown product. Representative confocal microscopy images are shown from one out of 2 independent experiments. Arrowheads indicate FSP1 condensates. i. Immunoblot analysis of FSP1 and actin expression of H460 WT and FSP1 KO cells with doxycycline (Dox)-inducible FSP1-WT or the Q319K mutant after Dox induction with indicated concentrations for 48 h. The left part of the blot is already shown in Extended Data Fig. 4f. Representative results from one out of 2 independent experiments. j. Confocal microscopy images after treating H460 FSP1 KO cells with doxycycline-inducible FSP1-WT or the Q319K mutant with 1 µg/mL of Dox for 48 h, followed by treatment with and without 10 µM icFSP1 for 240 min. Scale bars, 10 μm. Representative images from one out of 2 independent experiments. Source data
Extended Data Fig. 9
Extended Data Fig. 9. Targeting of FSP1 by icFSP1 as potential anti-cancer therapy using human cells.
a. Immunoblot analysis of GPX4, FSP1 and VCP expression of A375 WT and GPX4 KO cells. Representative images from one out of 2 independent experiments. b. Cell viability was measured after Lip-1 withdrawal for 72 h in A375 WT and GPX4 KO cells. Data represent the mean ± SD of 3 wells from one out of 2 independent experiments. c. Cell viability was measured after treating A375 WT and GPX4 KO cells with icFSP1 for 48 h. Data represents the mean ± SD of 3 wells from one out of 2 independent experiments. d. icFSP1 inhibits tumor growth in vivo. A375 GPX4 KO cells (a human melanoma cell line) were subcutaneously implanted into the flanks of Athymic Nude mice. After tumors became palpable (day 3), mice were randomized and treatment was started with icFSP1 (50 mg/kg i.p. twice a day for beginning 4 days and once a day afterward, n = 7) or vehicle (n = 7). Data represents the mean ± SD from one experiment. P value was calculated by two-way ANOVA followed by Bonferroni’s multiple comparison. e. At the end of the in vivo pharmacological studies, tumors were dissected, cryosectioned and stained with anti-FSP1 (14D7) to visualize hFSP1 and with anti-4-HNE to visualize the lipid peroxidation breakdown product. Representative confocal microscopy images of 3 different samples from a single experiment are shown. f. Immunoblot analysis of GPX4, and VCP expression of H460 WT and GPX4 KO cells from one out of 2 independent experiments. g. Cell viability was measured after Lip-1 withdrawal for 72 h in H460 WT and GPX4 KO cells. Data represents the mean ± SD of 3 wells from one out of 2 independent experiments. Two-tailed unpaired t-test. h. Cell viability was measured after treating H460 WT and GPX4 KO cells with icFSP1 for 48 h. Data represents the mean ± SD of 3 wells from one out of 2 independent experiments. i. icFSP1 inhibits tumor growth in vivo. H460 GPX4 KO cells (a human lung cancer cell line) were subcutaneously implanted into the flanks of Athymic Nude mice. After tumors became palpable (day 8), mice were randomized and treatment was started with icFSP1 (50 mg/kg i.p. twice a day, n = 7) or vehicle (n = 7). Data represents the mean ± SD from one experiment. P value was calculated by two-way ANOVA followed by Sidak’s multiple comparison tests. Source data
Extended Data Fig. 10
Extended Data Fig. 10. FSP1 is a potential target in multiple cancer cells.
a. AIFM2 (FSP1) expression in different cancer cells from different origins. b. AIFM2 gene effect (CRISPR) in different cancer cells from different origins. c. AIFM2 gene effect (RNAi) in different cancer cells from different origins. Data were mined from https://depmap.org/portal/ and cell lines used in this study were highlighted with the names of cancer cell lines. d. Representative immunoblot analysis of GPX4, FSP1, ACSL4, XCT (SLC7A11) and actin expression of indicated cell lines from one out of 2 independent experiments. e. Cell viability in lymphoma (SUDHL5, SUDHL6, DOHH2, OCI-Ly19) cells treated with icFSP1 in the presence or absence of 0.5 µM Lip-1 for 72 h. Data represents the mean ± SD of 3 wells from one out of 2 independent experiments. P values were calculated by two-way ANOVA followed by Tukey’s multiple comparison tests. Source data

Comment in

  • FSP1 in cancer: not just a phase.
    Brewer G. Brewer G. Nat Rev Cancer. 2023 Sep;23(9):578. doi: 10.1038/s41568-023-00607-0. Nat Rev Cancer. 2023. PMID: 37491632 No abstract available.

References

    1. Dixon SJ, et al. Ferroptosis: an iron-dependent form of nonapoptotic cell death. Cell. 2012;149:1060–1072. doi: 10.1016/j.cell.2012.03.042. - DOI - PMC - PubMed
    1. Viswanathan VS, et al. Dependency of a therapy-resistant state of cancer cells on a lipid peroxidase pathway. Nature. 2017;547:453–457. doi: 10.1038/nature23007. - DOI - PMC - PubMed
    1. Hangauer MJ, et al. Drug-tolerant persister cancer cells are vulnerable to GPX4 inhibition. Nature. 2017;551:247–250. doi: 10.1038/nature24297. - DOI - PMC - PubMed
    1. Bersuker K, et al. The CoQ oxidoreductase FSP1 acts parallel to GPX4 to inhibit ferroptosis. Nature. 2019;575:688–692. doi: 10.1038/s41586-019-1705-2. - DOI - PMC - PubMed
    1. Doll S, et al. FSP1 is a glutathione-independent ferroptosis suppressor. Nature. 2019;575:693–698. doi: 10.1038/s41586-019-1707-0. - DOI - PubMed

Publication types

MeSH terms