. 2023 Jun 28;21(1):419.
doi: 10.1186/s12967-023-04294-1.

Intrahepatic macrophage reprogramming associated with lipid metabolism in hepatitis B virus-related acute-on-chronic liver failure

Affiliations

Intrahepatic macrophage reprogramming associated with lipid metabolism in hepatitis B virus-related acute-on-chronic liver failure

Bo Peng et al. J Transl Med. .

Abstract

Background: Acute-on-chronic liver failure (ACLF) is a severe syndrome with high short-term mortality, but the pathophysiology still remains largely unknown. Immune dysregulation and metabolic disorders contribute to the progression of ACLF, but the crosstalk between immunity and metabolism during ACLF is less understood. This study aims to depict the immune microenvironment in the liver during ACLF, and explore the role of lipid metabolic disorder on immunity.

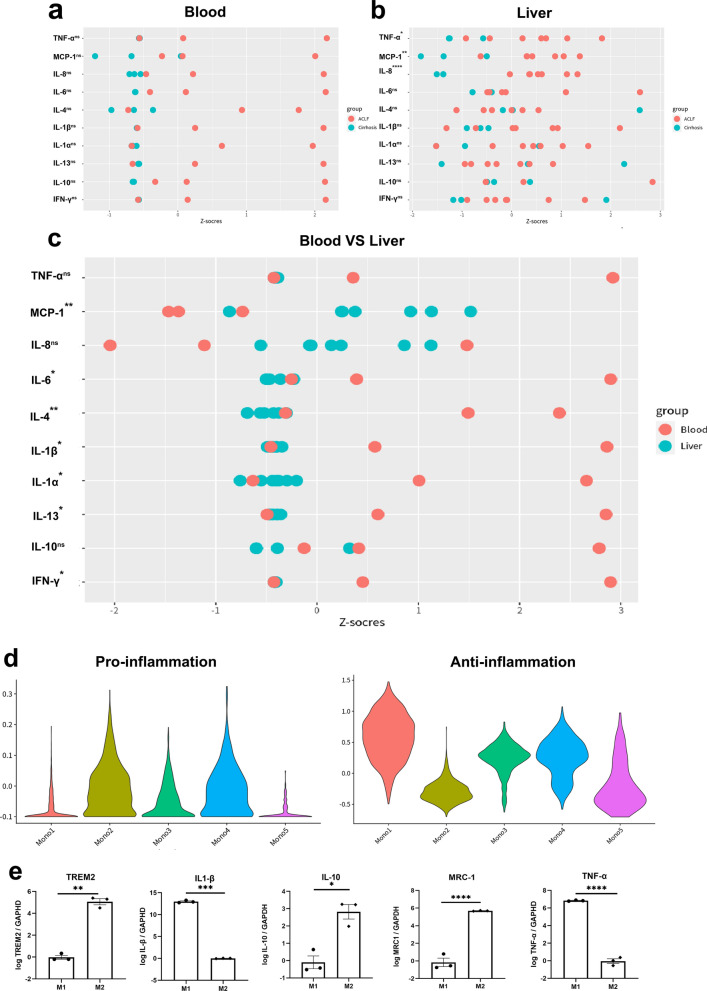
Methods: Single-cell RNA-sequencing (scRNA-seq) was performed using the liver non-parenchymal cells (NPCs) and peripheral blood mononuclear cells (PBMCs) from healthy controls, cirrhosis patients and ACLF patients. A series of inflammation-related cytokines and chemokines were detected using liver and plasma samples. The lipid metabolomics targeted free fatty acids (FFAs) in the liver was also detected.

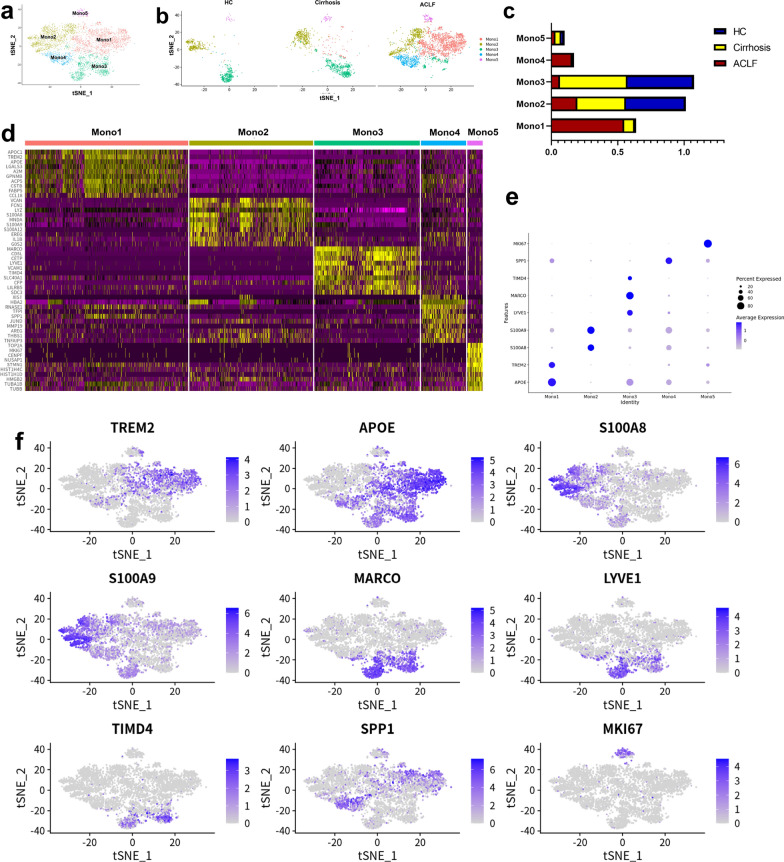
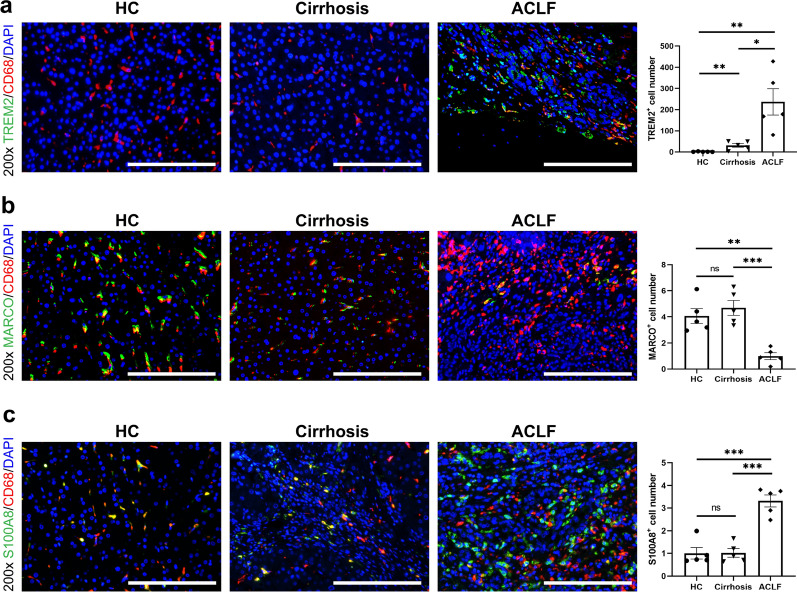
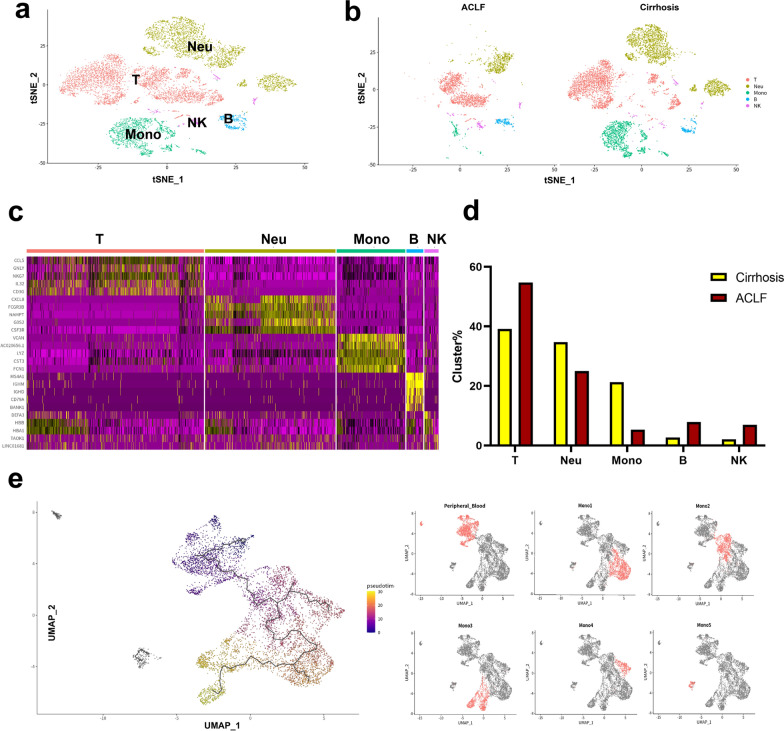
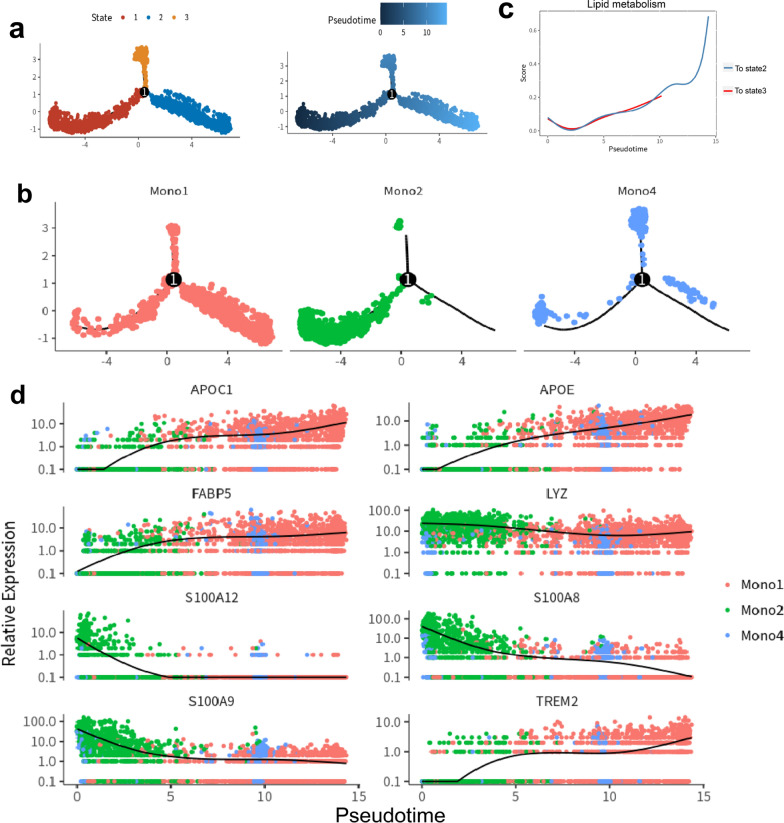
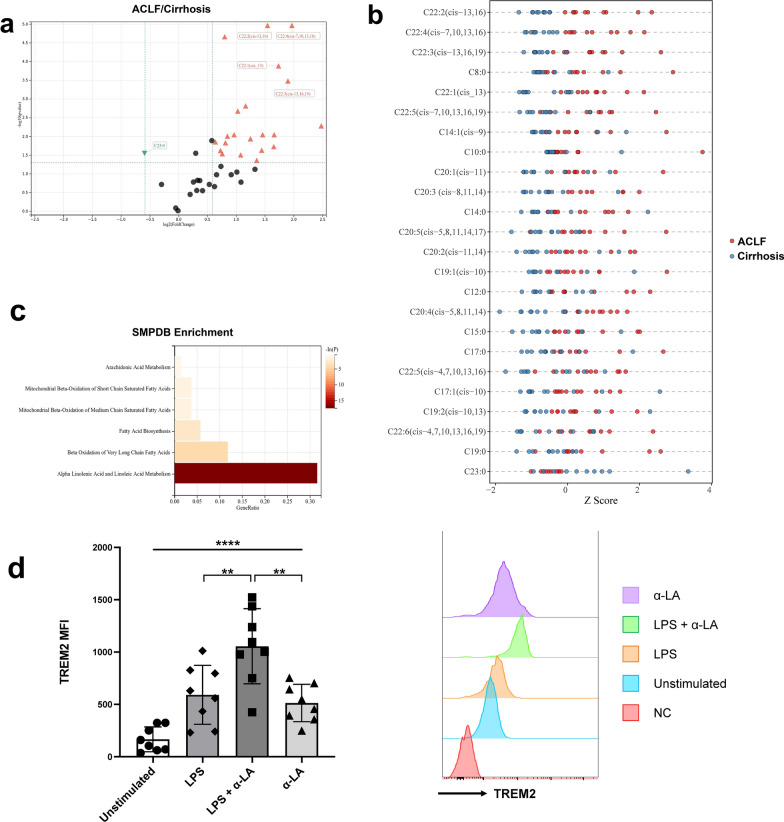
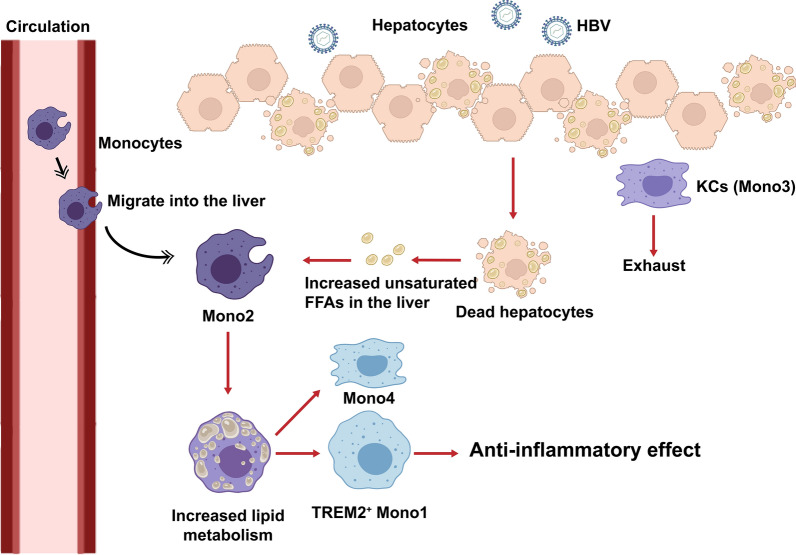
Results: The scRNA-seq analysis of liver NPCs showed a significant increase of monocytes/macrophages (Mono/Mac) infiltration in ACLF livers, whereas the resident Kupffer cells (KCs) were exhausted. A characterized TREM2+ Mono/Mac subpopulation was identified in ACLF, and showed immunosuppressive function. Combined with the scRNA-seq data from PBMCs, the pseudotime analysis revealed that the TREM2+ Mono/Mac were differentiated from the peripheral monocytes and correlated with lipid metabolism-related genes including APOE, APOC1, FABP5 and TREM2. The targeted lipid metabolomics proved the accumulation of unsaturated FFAs associated with α-linolenic acid (α-LA) and α-LA metabolism and beta oxidation of very long chain fatty acids in the ACLF livers, indicating that unsaturated FFAs might promote the differentiation of TREM2+ Mono/Mac during ACLF.

Conclusions: The reprogramming of macrophages was found in the liver during ACLF. The immunosuppressive TREM2+ macrophages were enriched in the ACLF liver and contributed to the immunosuppressive hepatic microenvironment. The accumulation of unsaturated FFAs in the ACLF liver promoted the reprogramming of the macrophages. It might be a potential target to improve the immune deficiency of ACLF patients through regulating lipid metabolism.

Keywords: Acute-on-chronic liver failure; Cirrhosis-associated immune dysfunction; Free fatty acids; Hepatitis B virus; Lipid metabolomics; TREM2; scRNA-seq.


Conflict of interest statement

The authors declare that they have no competing interests.

Figures

Fig. 1
Fig. 1
The scRNA-seq analysis of monocytes/macrophages in the livers. a 4738 monocytes/macrophages in the livers were re-clustered into 5 clusters according to their gene expression using Seurat v4.0 and the result was shown by tSNE. b The distribution of 5 monocytes/macrophages clusters among HCs, cirrhosis and ACLF patients. Clusters Mono1 and Mono4 were characteristically enriched in ACLF livers. c The proportions of 5 monocytes/macrophages clusters among HCs, cirrhosis and ACLF patients. The HCs and cirrhosis patients had similar proportions of each cluster, while the ACLF patients had high proportions of Mono1. d The heat map of the DE genes for each cluster. e The dotplot of the representative marker genes for each cluster. f The tSNE plots of marker genes for each cluster
Fig. 2
Fig. 2
The representative immunofluorescence images of monocytes/macrophages clusters in the livers of HCs, cirrhosis and ACLF patients. a The immunofluorescence images (n = 5) of CD68 (red), TREM2 (green) and DAPI (blue) in the livers. The ACLF patients had much higher number of TREM2+ cells in the livers compared with HCs and cirrhosis patients. b The immunofluorescence images (n = 5) of CD68 (red), MARCO (green) and DAPI (blue) in the livers. The HCs and cirrhosis patients had similar number of MARCO+ cells, while the ACLF patients showed significant decrease of them. c The immunofluorescence images (n = 5) of CD68 (red), S100A8 (green) and DAPI (blue) in the livers. The ACLF patients had higher number of S100A8.+ cells in the livers compared with HCs and cirrhosis patients. For all images, the positive signal number of each sample was determined by the mean value of the TREM2/MARCO/S100A8 positive signals in five random fields after data standardization. (ns not significant, *p < 0.05, **p < 0.01, ***p < 0.001, bar = 200 μm)
Fig. 3
Fig. 3
The function of TREM2.+ monocytes/macrophages. a The cytokines and chemokines detected in the peripheral blood of cirrhosis and ACLF patients using the Quantibody® array kit. The raw data was transformed into standard score and compared with Student’s t-test. b The cytokines and chemokines detected in the livers of cirrhosis and ACLF patients using the Quantibody® array kit. The raw data was transformed into standard score and compared with Student’s t-test. c The comparison of the cytokines and chemokines between the peripheral blood and livers of ACLF patients. d The functional assessment of monocytes/macrophages clusters with pro-inflammatory/anti-inflammatory macrophage genes using Seurat v4.0 R package. The associated genes were list in Additional file 1: Table S2. e RNA expression of TREM2, IL-1β, IL-10, MRC-1 and TNF-α in M1 and M2 induced from THP-1 cells in vitro. The expression of TREM2 was much higher in M2. (ns not significant, *p < 0.05, **p < 0.01, ***p < 0.001, ****p < 0.0001)
Fig. 4
Fig. 4
The scRNA-seq analysis of peripheral blood of cirrhosis and ACLF patients. a 10,268 PBMCs from cirrhosis and ACLF patients were divided into 5 clusters according to their gene expression using Seurat v4.0. Clusters were annotated as T cells (T), NK cells (NK), B cells (B), monocytes (Mono) and neutrophils (Neu) based on the classic marker genes. b The tSNE plot of the 5 clusters in cirrhosis and ACLF patients, respectively. c The heat map of representative marker genes of the 5 clusters in PBMCs. d The proportions of the 5 clusters in cirrhosis and ACLF patients. The proportion of monocytes was decreased in the peripheral blood of ACLF patients. e The pseudotime trajectory (black line) of the intrahepatic monocytes/macrophages and peripheral monocytes shown by UMAP
Fig. 5
Fig. 5
The pseudotime analysis of monocytes/macrophages. a The pseudotime trajectory of Mono1, Mono2 and Mono4. All cells were clustered into 3 states. The No.1 point represent as the differentiation point in pseudotime differentiation. b The distribution of monocytes/macrophages clusters in the pseudotime trajectory. Mono2 was at the beginning of the trajectory path, and the majority cells of clusters Mono1 and Mono4 were at the terminals of the bifurcation, respectively c Changes in lipid metabolism scores along the direction of pseudotime trajectory. d The expression of key genes along the pseudotime trajectory. Genes related to lipid metabolism, including APOC1, APOE, FABP5 and TREM2 were increased, while genes related to inflammation, including LYZ, S100A12, S100A8 and S100A9 were decreased
Fig. 6
Fig. 6
The targeted lipid metabolomics in the livers of cirrhosis and ACLF patients and stimulation test with α-LA. a The volcano plot of FFAs in the livers showed as the ACLF group over the cirrhosis group. 23 FFAs were increased in ACLF group while only 1 FFA was increased in cirrhosis group. b The 24 differentiated FFAs for each sample shown by Z score. c The metabolite sets enrichment analysis for the increased FFAs in ACLF livers. d The expression of TREM2 on selected CD14+ peripheral monocytes stimulated in vitro. The expression of TREM2 was significantly increased when stimulated with α-LA (60 μM) and LPS (100 ng/mL). (**p < 0.01, ****p < 0.0001, tested by paired t-test)
Fig. 7
Fig. 7
The diagram of macrophage reprogramming in the liver during ACLF. The KCs were exhausted and the peripheral monocytes were recruited into the liver during ACLF. The accumulation of unsaturated FFAs in the liver promoted macrophage reprogramming and induced the expression of TREM2 on macrophages, which contributed to the immunosuppressive microenvironment in the liver

References

    1. Arroyo V, Moreau R, Jalan R. Acute-on-chronic liver failure. N Engl J Med. 2020;382(22):2137–2145. doi: 10.1056/NEJMra1914900. - DOI - PubMed
    1. Huang DQ, Terrault NA, Tacke F, Gluud LL, Arrese M, Bugianesi E, et al. Global epidemiology of cirrhosis - aetiology, trends and predictions. Nat Rev Gastroenterol Hepatol. 2023;20(6):388–398. doi: 10.1038/s41575-023-00759-2. - DOI - PMC - PubMed
    1. Mezzano G, Juanola A, Cardenas A, Mezey E, Hamilton JP, Pose E, et al. Global burden of disease: acute-on-chronic liver failure, a systematic review and meta-analysis. Gut. 2022;71(1):148–155. doi: 10.1136/gutjnl-2020-322161. - DOI - PubMed
    1. Wu T, Li J, Shao L, Xin J, Jiang L, Zhou Q, et al. Development of diagnostic criteria and a prognostic score for hepatitis B virus-related acute-on-chronic liver failure. Gut. 2018;67(12):2181–2191. doi: 10.1136/gutjnl-2017-314641. - DOI - PubMed
    1. Jalan R, Saliba F, Pavesi M, Amoros A, Moreau R, Gines P, et al. Development and validation of a prognostic score to predict mortality in patients with acute-on-chronic liver failure. J Hepatol. 2014;61(5):1038–1047. doi: 10.1016/j.jhep.2014.06.012. - DOI - PubMed

Publication types

Substances