. 2023 Jun 28;14(1):22.
doi: 10.1186/s13229-023-00554-5.

Exploratory analysis of L1 retrotransposons expression in autism

Affiliations

Exploratory analysis of L1 retrotransposons expression in autism

Giovanni Spirito et al. Mol Autism. .

Abstract

Background: Autism spectrum disorder (ASD) is a set of highly heterogeneous neurodevelopmental diseases whose genetic etiology is not completely understood. Several investigations have relied on transcriptome analysis from peripheral tissues to dissect ASD into homogenous molecular phenotypes. Recently, analysis of changes in gene expression from postmortem brain tissues has identified sets of genes that are involved in pathways previously associated with ASD etiology. In addition to protein-coding transcripts, the human transcriptome is composed by a large set of non-coding RNAs and transposable elements (TEs). Advancements in sequencing technologies have proven that TEs can be transcribed in a regulated fashion, and their dysregulation might have a role in brain diseases.

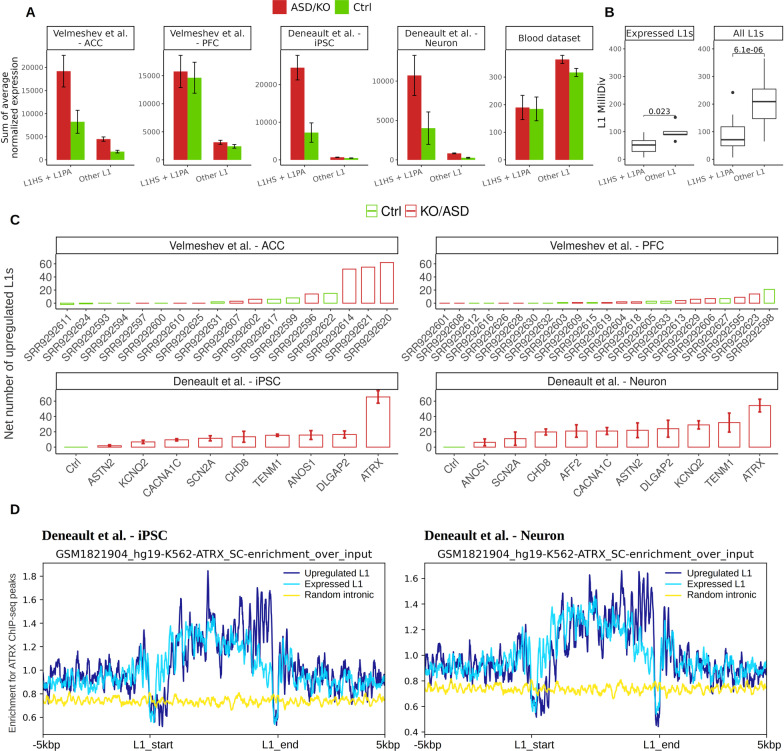
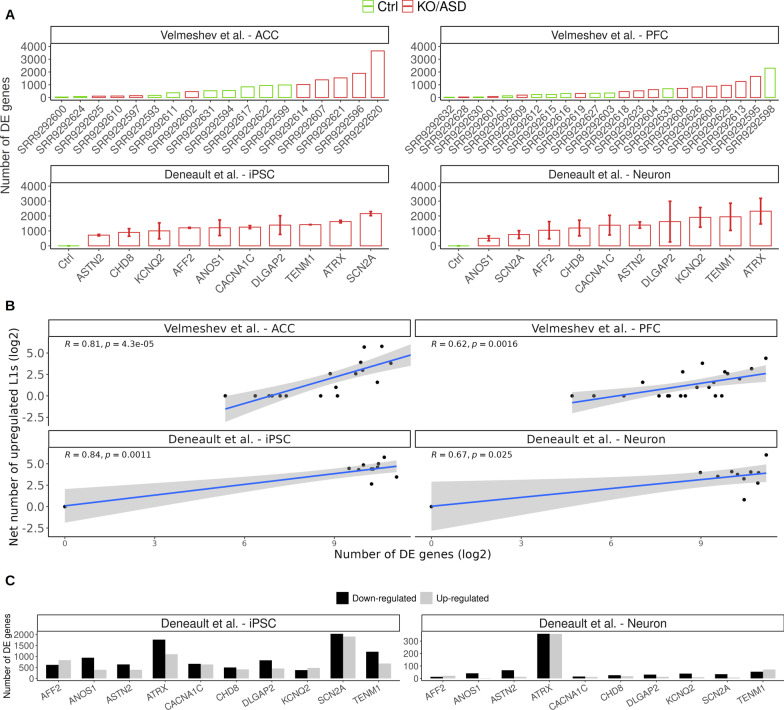
Methods: We exploited published datasets comprising RNA-seq data from (1) postmortem brain of ASD subjects, (2) in vitro cell cultures where ten different ASD-relevant genes were knocked out and (3) blood of discordant siblings. We measured the expression levels of evolutionarily young full-length transposable L1 elements and characterized the genomic location of deregulated L1s assessing their potential impact on the transcription of ASD-relevant genes. We analyzed every sample independently, avoiding to pool together the disease subjects to unmask the heterogeneity of the molecular phenotypes.

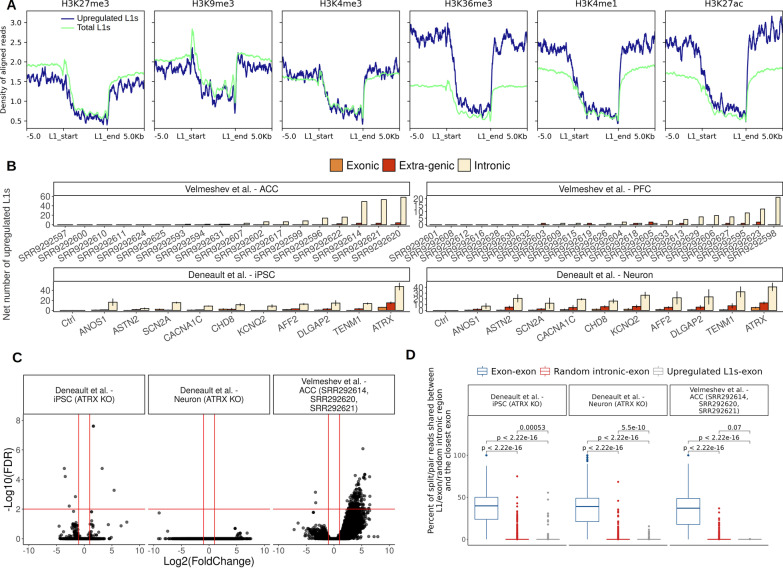
Results: We detected a strong upregulation of intronic full-length L1s in a subset of postmortem brain samples and in in vitro differentiated neurons from iPSC knocked out for ATRX. L1 upregulation correlated with an high number of deregulated genes and retained introns. In the anterior cingulate cortex of one subject, a small number of significantly upregulated L1s overlapped with ASD-relevant genes that were significantly downregulated, suggesting the possible existence of a negative effect of L1 transcription on host transcripts.

Limitations: Our analyses must be considered exploratory and will need to be validated in bigger cohorts. The main limitation is given by the small sample size and by the lack of replicates for postmortem brain samples. Measuring the transcription of locus-specific TEs is complicated by the repetitive nature of their sequence, which reduces the accuracy in mapping sequencing reads to the correct genomic locus.

Conclusions: L1 upregulation in ASD appears to be limited to a subset of subjects that are also characterized by a general deregulation of the expression of canonical genes and an increase in intron retention. In some samples from the anterior cingulate cortex, L1s upregulation seems to directly impair the expression of some ASD-relevant genes by a still unknown mechanism. L1s upregulation may therefore identify a group of ASD subjects with common molecular features and helps stratifying individuals for novel strategies of therapeutic intervention.

Keywords: Autism; L1 retrotransposons expression; Transcriptomics.


Conflict of interest statement

The authors declare no competing interests.

Figures

Fig. 1
Fig. 1
Upregulation of evolutionarily young FL L1s in ASD. A Sum of average normalized expression of L1 subfamilies in all samples, quantified with TEspeX. L1 subfamilies have been divided into two groups: one comprising L1HS and all 20 L1PA subfamilies and one including all other 96 L1 subfamilies, and read counts have been normalized with DEseq2. B Average MilliDiv values for all and expressed L1 subfamilies, retrieved from RepeatMasker. Expressed L1 subfamilies have been defined as L1 subfamilies associated with at least an average of 200 reads among all samples by TEspeX. C Net number of upregulated L1 elements calculated by subtracting the number of downregulated L1s (z < − 3) to the number of upregulated L1s (z > 3) for all samples, in the case of the KO gene datasets; the average and standard deviation of the net number of upregulated L1s among replicates have been plotted. D Enrichment profile of ATRX ChIP-seq peaks on upregulated young FL L1s, expressed FL L1s and random 6 kbp intronic genomic coordinates
Fig. 2
Fig. 2
Transcriptome-wide level of deregulation in ASD brain and in vitro neurons correlates with L1 upregulation. A Total number of dysregulated genes (|z score|> 3) for all samples. In the case of the gene KO datasets, the average and standard deviation of the number of dysregulated genes among replicates has been plotted. B Correlation between the number of DE genes and the number of upregulated L1 in log2. C Number of DE genes (FDR < 0.05, |LogFoldChange|> 0.5) resulting from DEseq2 differential expression analysis
Fig. 3
Fig. 3
Upregulated L1 elements are expressed within introns of actively transcribed genes. A Histone marks aligned reads density profiles computed for all upregulated L1 elements and total annotated L1 elements for six major histone marks, the profile extends along the whole length of the L1 elements (~ 6 kbp) as well as along 5 kbp upstream and downstream with respect to each L1 element. B Genomic localization of all upregulated L1 elements in all samples. C Volcano plot representing differentially retained introns between controls and samples characterized by a strong L1 upregulation, significance lines: FDR = 0.05, |Log2(FoldChange)|= 1. D Percentage of reads shared among random exons and their closest upregulated L1, exons and their closest exon, random intronic 6 kbp regions and their closest exons
Fig. 4
Fig. 4
Upregulated L1 elements may negatively impact the expression of specific ASD-related host genes. A Number of upregulated L1 elements overlapping DE and non-DE genes. B Number of upregulated L1 elements overlapping upregulated and downregulated genes. C z score associated with upregulated L1s (z score > 3) and their overlapping genes in samples, and non-upregulated L1s (|z score < 2|) and their overlapping genes in samples SRR9292614, SRR9292620 and SRR9292621. D Number of genes overlapping upregulated L1s and associated with a negative z score in common with genes nearby genomic loci where the L1 RNA binds genomic DNA in mouse, compared to random distributions computed with expressed genes, **z score > 5. E Example of an upregulated L1 intronic to a gene showing an average negative z score. The sashimi plots represent the normalized expression at the level of the intronic upregulated L1 and the closest exon belonging to the DLGAP1 gene. The upregulated L1 is in red in the RepeatMasker track. Other annotated repeats are in black. DLGAP1 exon is in blue. F Distribution of correlation coefficients between intronic and extragenic L1s and the closest/overlapping gene for all L1/gene couples in different human tissues grouped together and G taken ungrouped

References

    1. Zeidan J, Fombonne E, Scorah J, Ibrahim A, Durkin MS, Saxena S, et al. Global prevalence of autism: a systematic review update. Autism Res Off J Int Soc Autism Res. 2022;15:778–790. doi: 10.1002/aur.2696. - DOI - PMC - PubMed
    1. Sandin S, Lichtenstein P, Kuja-Halkola R, Hultman C, Larsson H, Reichenberg A. The heritability of Autism Spectrum Disorder. JAMA. 2017;318:1182–1184. doi: 10.1001/jama.2017.12141. - DOI - PMC - PubMed
    1. Luo W, Zhang C, Jiang Y-H, Brouwer CR. Systematic reconstruction of autism biology from massive genetic mutation profiles. Sci Adv. 2018;4:e1701799. doi: 10.1126/sciadv.1701799. - DOI - PMC - PubMed
    1. Feliciano P, Zhou X, Astrovskaya I, Turner TN, Wang T, Brueggeman L, et al. Exome sequencing of 457 autism families recruited online provides evidence for autism risk genes. NPJ Genom Med. 2019;4:19. doi: 10.1038/s41525-019-0093-8. - DOI - PMC - PubMed
    1. McConnell MJ, Moran JV, Abyzov A, Akbarian S, Bae T, Cortes-Ciriano I, et al. Intersection of diverse neuronal genomes and neuropsychiatric disease: the Brain Somatic Mosaicism Network. Science. 2017;356:eaal1641. doi: 10.1126/science.aal1641. - DOI - PMC - PubMed