. 2023 Jun 29;12(1):34.
doi: 10.1186/s40035-023-00365-x.

Head-to-head comparison of plasma and PET imaging ATN markers in subjects with cognitive complaints

Collaborators, Affiliations

Head-to-head comparison of plasma and PET imaging ATN markers in subjects with cognitive complaints

Jiaying Lu et al. Transl Neurodegener. .

Abstract

Background: Gaining more information about the reciprocal associations between different biomarkers within the ATN (Amyloid/Tau/Neurodegeneration) framework across the Alzheimer's disease (AD) spectrum is clinically relevant. We aimed to conduct a comprehensive head-to-head comparison of plasma and positron emission tomography (PET) ATN biomarkers in subjects with cognitive complaints.

Methods: A hospital-based cohort of subjects with cognitive complaints with a concurrent blood draw and ATN PET imaging (18F-florbetapir for A, 18F-Florzolotau for T, and 18F-fluorodeoxyglucose [18F-FDG] for N) was enrolled (n = 137). The β-amyloid (Aβ) status (positive versus negative) and the severity of cognitive impairment served as the main outcome measures for assessing biomarker performances.

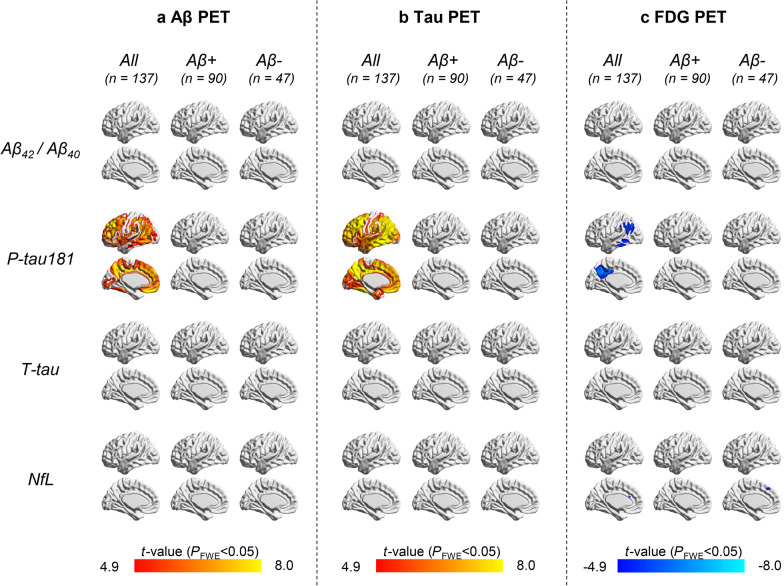
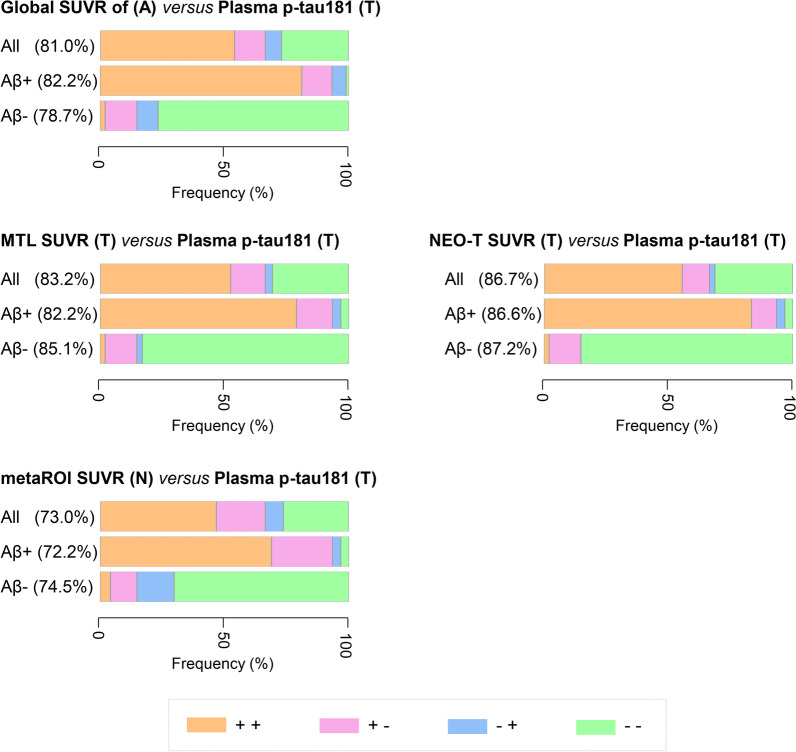
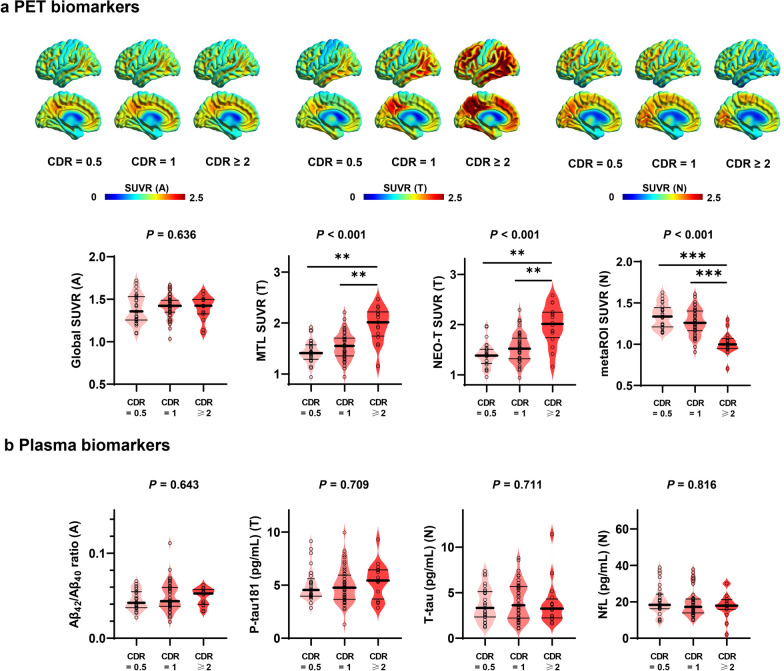
Results: Plasma phosphorylated tau 181 (p-tau181) level was found to be associated with PET imaging of ATN biomarkers in the entire cohort. Plasma p-tau181 level and PET standardized uptake value ratios of AT biomarkers showed a similarly excellent diagnostic performance for distinguishing between Aβ+ and Aβ- subjects. An increased tau burden and glucose hypometabolism were significantly associated with the severity of cognitive impairment in Aβ+ subjects. Additionally, glucose hypometabolism - along with elevated plasma neurofilament light chain level - was related to more severe cognitive impairment in Aβ- subjects.

Conclusion: Plasma p-tau181, as well as 18F-florbetapir and 18F-Florzolotau PET imaging can be considered as interchangeable biomarkers in the assessment of Aβ status in symptomatic stages of AD. 18F-Florzolotau and 18F-FDG PET imaging could serve as biomarkers for the severity of cognitive impairment. Our findings have implications for establishing a roadmap to identifying the most suitable ATN biomarkers for clinical use.

Keywords: ATN biomarkers; Clinical severity; PET imaging; Plasma.


Conflict of interest statement

Tzu-Chen Yen is an employee of APRINOIA Therapeutics Co., Ltd (Suzhou, China). All other authors have no conflicts of interest to declare.

Figures

Fig. 1
Fig. 1
Reciprocal associations between plasma and PET imaging ATN biomarkers: voxel-wise analysis. Voxel-wise regression analysis of standardized uptake value ratios from 18F-florbetapir PET for A (a), 18F-Florzolotau PET for T (b), and 18F-FDG PET for N (c) in relation to plasma ATN biomarkers (Aβ42/Aβ40 ratio, p-tau181, t-tau, NfL) adjusted for age, sex, and the interval from PET imaging to blood collection; calculations were performed in the entire cohort, as well as in Aβ+ and Aβ− subjects. The statistical threshold was set at a family wise error (FWE)-corrected P value < 0.05. The positive correlations are displayed in orange-red color scale. The negative correlations are displayed in cyan-blue color scale. PET Positron emission tomography, t-tau, total tau, NfL Neurofilament light chain, FWE Family-wise error
Fig. 2
Fig. 2
Agreement between plasma p-tau181 levels and PET imaging ATN biomarkers for predicting the Aβ status. The concordance rates are based on the established thresholds for the biomarkers. The sums of negative and positive concordance rates are presented. Color bars summarize the concordance rates between plasma p-tau181 level and different PET imaging ATN biomarkers in the entire cohort (upper row) as well as Aβ+ subjects (intermediate row) and Aβ− subjects (lower row). Negative (− −) and positive (+ +) agreement are denoted in green and orange, respectively. Disagreement is reported in magenta (+ −; positive SUVR value on PET and negative p-tau181 level) or in blue (− + ; negative SUVR value on PET and positive p-tau181 level). A/T/N, Amyloid/Tau/Neurodegeneration, SUVR Standardized uptake value ratio, MTL Medial temporal lobe, NEO-T Temporal neocortex; metaROI, meta-analytically derived region of interest; p-tau181, tau phosphorylated at threonine 181
Fig. 3
Fig. 3
Plasma and PET imaging ATN biomarkers in relation to the severity of cognitive impairment in Aβ+ subjects. Average SUVR maps for PET imaging A (left), T (middle), and N (right) biomarkers in relation to different CDR categories (a; upper row). Generalized linear models after adjustment for age and sex were applied to analyze the values of PET (a; lower row) and plasma (b) ATN biomarkers in relation to the severity of cognitive impairment. Unadjusted P values are presented for differences between the three CDR categories, whereas those that remained significant after correcting for multiple comparisons (Bonferroni’s correction) are marked with asterisks (***, Pc < 0.001; **, Pc < 0.01). The thick solid line, the thin solid lines, and the dots denote the median, the 25th and 75th percentiles, and individual values, respectively. CDR Clinical Dementia Rating, PET Positron emission tomography, A/T/N Amyloid/Tau/Neurodegeneration, SUVR Standardized uptake value ratio, MTL Medial temporal lobe, NEO-T Temporal neocortex, metaROI Meta-analytically derived region of interest, p-tau181 tau phosphorylated at threonine 181, t-tau total tau, NfL Neurofilament light chain
Fig. 4
Fig. 4
Associations of plasma and PET imaging ATN biomarkers with neuropsychological tests. Partial correction analysis after adjustment for age and sex was applied to evaluate the associations between plasma and PET imaging ATN biomarkers and the results of neuropsychological tests in the entire cohort (a) as well as in Aβ+ (b) and Aβ− (c) subjects. Unadjusted P values are presented with asterisks (***, P < 0.001; **, P < 0.01; *, P < 0.05) whereas those that remained significant after correcting for multiple comparisons (Bonferroni’s correction, Pc < 0.05) are marked with solid frames. The results of neuropsychological testing on different cognitive domains were transformed to Z-scores. The color bars denote partial correlation coefficients (r). MMSE Mini-Mental State Examination, MOCA Montreal Cognitive Assessment, FAQ Functional Activities Questionnaire, PET Positron emission tomography, SUVR Standardized uptake value ratio, MTL Medial temporal lobe; NEO-T Temporal neocortex, metaROI Meta-analytically derived region of interest, t-tau total tau, NfL Neurofilament light chain

References

    1. Wu YT, Beiser AS, Breteler MMB, Fratiglioni L, Helmer C, Hendrie HC, et al. The changing prevalence and incidence of dementia over time-current evidence. Nat Rev Neurol. 2017;13:327–339. doi: 10.1038/nrneurol.2017.63. - DOI - PubMed
    1. Jessen F, Amariglio RE, Buckley RF, van der Flier WM, Han Y, Molinuevo JL, et al. The characterisation of subjective cognitive decline. Lancet Neurol. 2020;19:271–278. doi: 10.1016/S1474-4422(19)30368-0. - DOI - PMC - PubMed
    1. Petersen RC. Mild cognitive impairment as a diagnostic entity. J Intern Med. 2004;256:183–194. doi: 10.1111/j.1365-2796.2004.01388.x. - DOI - PubMed
    1. Jack CR, Bennett DA, Blennow K, Carrillo MC, Dunn B, Haeberlein SB, et al. NIA-AA research framework: toward a biological definition of Alzheimer’s disease. Alzheimers Dement. 2018;14:535–562. doi: 10.1016/j.jalz.2018.02.018. - DOI - PMC - PubMed
    1. Ossenkoppele R, van der Kant R, Hansson O. Tau biomarkers in Alzheimer’s disease: towards implementation in clinical practice and trials. Lancet Neurol. 2022;21:726–734. doi: 10.1016/S1474-4422(22)00168-5. - DOI - PubMed

Publication types