. 2023 Dec 1;108(12):3359-3371.
doi: 10.3324/haematol.2022.282484.

Amyloidogenic light chains impair plasma cell survival

Affiliations

Amyloidogenic light chains impair plasma cell survival

Marjorie Pick et al. Haematologica. .

Abstract

Systemic light chain amyloidosis (AL) is a clonal plasma cell disorder characterized by the deposition of misfolded immunoglobulin light chains (LC) as insoluble fibrils in organs. The lack of suitable models has hindered the investigation of the disease mechanisms. Our aim was to establish AL LC-producing plasma cell lines and use them to investigate the biology of the amyloidogenic clone. We used lentiviral vectors to generate cell lines expressing LC from patients suffering from AL amyloidosis. The AL LC-producing cell lines showed a significant decrease in proliferation, cell cycle arrest, and an increase in apoptosis and autophagy as compared with the multiple myeloma LC-producing cells. According to the results of RNA sequencing the AL LC-producing lines showed higher mitochondrial oxidative stress, and decreased activity of the Myc and cholesterol pathways. The neoplastic behavior of plasma cells is altered by the constitutive expression of amyloidogenic LC causing intracellular toxicity. This observation may explain the disparity in the malignant behavior of the amyloid clone compared to the myeloma clone. These findings should enable future in vitro studies and help delineate the unique cellular pathways of AL, thus expediting the development of specific treatments for patients with this disorder.


Figures
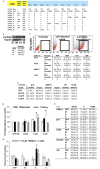
Figure 1.
Figure 1.
Assessment of intracellular and secreted λ light chains in transduced cell lines. (A) The table shows the raw counts and number of insertions, from RNA sequencing (each a separate infection of the 3 repetitions performed) of the JJN3 cell line JJN3 infected with only the green fluorescent protein (GFP) reporter or lentivirus containing cardiotoxic [H], nephrotoxic [K] amyloidogenic and multiple myeloma (MM) [M] λ light chains (LC). (B) Representative western blot illustrating the expression of λ protein in KMS11 cell lines: control (GFP [G]), AL LC ([H] and [K]), and MM LC [M] including intensity of λ bands (N=4, for separate transfections average for both JJN3 and KMS11 transduced lines). (C) Representative dot plot from flow cytometry analysis detecting monoclonal λ in the transduced KMS11 cell lines (N=6). The table shows the percent GFP and λ -positive cells from four cell lines infected (2 separate transfections). (D) Enzyme-linked immunosorbent assay to quantitate the secretion of λ LC was performed on the supernatants from which the various cell lines were grown after they had been infected. Supernatants containing secreted LC were collected 6 days after JJN3, KMS11 (MM cell lines), 721.221 and HL60 (non-MM cell lines) had been transduced with the various LC lentiviruses. GFP: empty control; [M]: multiple myeloma; [H] cardiotoxic or [K] nephrotoxic amyloidogenic LC lentivirus (N=6, 3 separate transfections in duplicate). *P<0.05 compared to GFP control. (E) Supernatants collected from MM cell lines (KMS11 and JJN3) that secreted LC and were found to contain λ LC were incubated with both MM and non-MM cell lines (JJN3, foreskin fibroblasts, heart cells [HC92] and kidney cells [HEK293]) and then the cells were assessed for increases in apoptosis (by propidium iodide staining, sub-G1 peak) as compared to the control. *P<0.05 compared to the GFP control (N=4, 2 experiments from KMS11 and 2 from JJN3 combined). (F) Cell cycle analysis of cell lines from figure (E). No significant differences in cell cycle were observed, only increases in apoptosis. (G) Supernatants that were collected from MM (JJN3) cell lines that secreted LC and were found to contain λ LC were incubated with both MM and non-MM cell lines (JJN3, KMS11, 721.221, and HL60) and cells were assessed for increases in annexin V expression as compared to control. *P<0.05 compared to the GFP control (N=4, 2 experiments from JJN3 combined).
Figure 2.
Figure 2.
Cardiotoxic and, nephrotoxic amyloidogenic light chains are toxic to multiple myeloma cell lines. (A) Cell counts of multiple myeloma (MM) cell lines (JJN3 and KMS11) over 9 days following transduction with MM [M], cardiotoxic [H] or nephrotoxic [K] amyloidosis (AL) light chain (LC) constructs or with only the green fluorescent protein (GFP) reporter (5 separate infections for each cell line). (B) Cell cycle analysis of transduced MM cell lines (KMS11 and JJN3) with the previous four lentivirus constructs. Table of summary of percent cells in each stage of the cell cycle. *P<0.05, **P<0.01 (N=6; separate transfections 3 times JJN3 and 3 times KMS11). (C) Representative May-Grünwald staining of the MM cell line KMS11: untreated, infected with empty control lentivirus (GFP), with MM or with cardiotoxic (AL) LC (N=4 separate transfections). (D) Assessment of ATP uptake (intensity) as an indicator of viability of MM cell lines (JJN3 and KMS11) that were uninfected (control, C) or infected with the same lentiviral vectors (3 separate transfections for each MM cell line). (E) Representative western blot analysis of JJN3 lysate of p62 (an auto-phagy substrate that is used as a reporter of autophagy activity) with (+) and without (-) bafilomycin, a potent inhibitor of cellular autophagy (6 replicate experiments, duplicate for each MM cell line). The table shows the mean ± standard deviation of the six replicates. (F) Purified LC were isolated from patients’ urine and added to the media of growing MM JJN3 cells and viability was assessed by ATP uptake (intensity) using the CellTiter-Glo® assay. LC from MM patients’ urine (M7 and M8), LC from patients with cardiotoxic AL (H7, H15 and H18) or LC from a patient with nephrotoxic AL (K5) were incubated for 5 days with naïve JJN3 cells. Triangles indicate increases in LC concentration, i.e., 0, 50, 100, 200 and 400 mg/mL, (N=3, 4-5 replicates per experiment).
Figure 3.
Figure 3.
RNA-sequencing analysis demonstrates a significant increase in apoptotic and cell death pathways in JJN3 cells infected with amyloidogenic light chains. (A, B) QIAGEN Ingenuity Pathway Analysis® (IPA®) biological function or disease heatmap of the categories cell death and survival (A) and small molecule biochemistry (B). Each box represents a specific biological function or disease that is connected to the two functional categories above. The size of the box correlates with the gene enrichment and the color of the box indicates the predicted increase (orange, positive z-score) or decrease (blue, negative z-score). Gray indicates no change in the biological process/disease activity. Functions with IPA® z-scores >2 or < -2 are predicted to be significantly upregulated/downregulated, respectively. IPA® calculates the P value and the activation z-score independently and, therefore, functions with moderate enrichment can have a significant activation z-score due to hallmark genes that contribute highly to the activation state. Thirty-seven molecular functions and diseases passed the absolute z-score of 2, of which ten are shown in the tables. For all experiments, three separate transductions in JJN3 cells, P<0.05.
Figure 4.
Figure 4.
RNA-sequencing analysis demonstrates a significant increase in the oxidative stress pathway in JJN3 cells infected with amyloidogenic light chains. (A) Ingenuity Pathway Analysis® enriched canonical pathway for oxidative phosphorylation (Benjamini-Hochberg procedure, P=0.046) with pink lines showing upregulation of significantly changed genes that participate in this pathway. (B) Validation using fluorescence of reactive oxygen species, measured by flow cytometry. Multiple myeloma (MM) cells containing amyloidogenic light chains ([H] and [K]) have increased mitochondrial oxidative stress as compared to MM cells containing non-amyloidogenic Light chains [M]. For all experiments, three separate transductions in JJN3 cells, *P<0.05. TMRM: tetramethylrhodamine methylester perchlorate.
Figure 5.
Figure 5.
Gene set enrichment analysis of JJN3 cells infected with amyloidogenic versus non-amyloidogenic light chains. In the gene set enrichment analysis (GSEA), pathways represented had a normalized enrichment score (NES) of more than 3 or less than -3 and a false discovery rate (FDR) of 0.02. (A) GSEA graph of the cholesterol pathway (left) with validation using an enzyme-linked immunosorbent assay (right) to detect the presence of cholesterol in JJN3 cells expressing either amyloidogenic (AL) or multiple myeloma (MM) light chains (LC). Note the significantly higher levels of both free and total cholesterol in the cells transduced with AL LC ([H] and [K]) as compared to cells transduced with MM LC [M], N= 5, *P<0.005, **P<0.002. (B) GSEA graph of the Myc target pathway (left) and representative western blot analysis showing high levels of Myc in the cells transduced with AL LC ([K] and [H]) as compared to cells transduced with MM [M] or GFP alone [G] or untreated MM cells [J] (right). Values below are the intensities of the bands. (C) GSEA graph of TNFα signaling via NFκB (left) and concentrations of the cytokines IL-10, IL-8 and IL-6, as determined by Cytometric Bead Assay (right). Note the significant decreases of IL-8 and IL-6 in the cells transduced with AL LC ([K] and [H]) *P<0.02-0.0002. (D) GSEA graph of the hypoxia pathway. For all experiments, three separate transfections in JJN3 cells.

References

    1. Merlini G, Bellotti V. Molecular mechanisms of amyloidosis. N Engl J Med. 2003;349(6):583-596. - PubMed
    1. Obici L, Perfetti V, Palladini G, et al. Clinical aspects of systemic amyloid diseases. Biochim Biophys Acta. 2005;1753(1):11-22. - PubMed
    1. Desikan KR, Dhodapkar MV, Hough A, et al. Incidence and impact of light chain associated (AL) amyloidosis on the prognosis of patients with multiple myeloma treated with autologous transplantation. Leuk Lymphoma. 1997;27(3-4):315-319. - PubMed
    1. Madan S, Dispenzieri A, Lacy MQ, et al. Clinical features and treatment response of light chain (AL) amyloidosis diagnosed in patients with previous diagnosis of multiple myeloma. Mayo Clin Proc. 2010;85(3):232-238. - PMC - PubMed
    1. Rajkumar SV, Gertz MA, Kyle RA. Primary systemic amyloidosis with delayed progression to multiple myeloma. Cancer. 1998;82(8):1501-1505. - PubMed

Publication types

MeSH terms