

CT findings in "Post-Covid": residua from acute pneumonia or "Post-Covid-ILD"?
- PMID: 37382073
- PMCID: PMC10494745
- DOI: 10.36141/svdld.v40i2.13983
CT findings in "Post-Covid": residua from acute pneumonia or "Post-Covid-ILD"?
Abstract
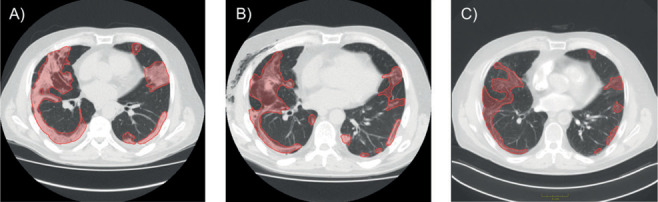
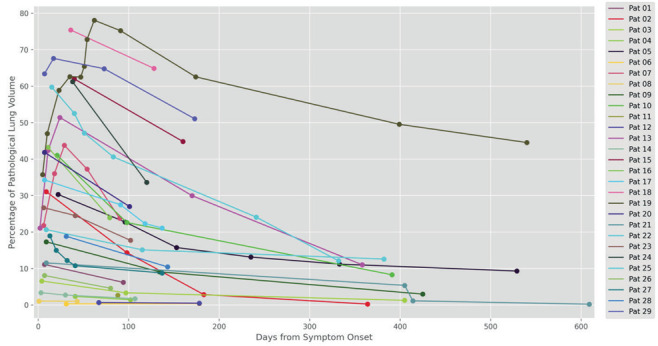
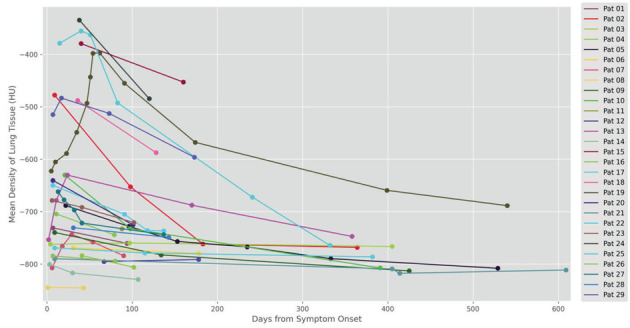
The aim of this study was to evaluate if CT findings in patients with pulmonary Post Covid syndrome represent residua after acute pneumonia or if SARS-CoV 2 induces a true ILD. Consecutive patients with status post acute Covid-19 pneumonia and persisting pulmonary symptoms were enrolled. Inclusion criteria were availability of at least one chest CT performed in the acute phase and at least one chest CT performed at least 80 days after symptom onset. In both acute and chronic phase CTs 14 CT features as well as distribution and extent of opacifications were independently determined by two chest radiologists. Evolution of every single CT lesion over time was registered intraindividually for every patient. Moreover, lung abnormalities were automatically segmented using a pre-trained nnU-Net model and volume as well as density of parenchymal lesions were plotted over the entire course of disease including all available CTs. 29 patients (median age 59 years, IQR 8, 22 men) were enrolled. Follow-up period was 80-242 days (mean 134). 152/157 (97 %) lesions in the chronic phase CTs represented residua of lung pathology in the acute phase. Subjective and objective evaluation of serial CTs showed that CT abnormalities were stable in location and continuously decreasing in extent and density. The results of our study support the hypothesis that CT abnormalities in the chronic phase after Covid-19 pneumonia represent residua in terms of prolonged healing of acute infection. We did not find any evidence for a Post Covid ILD.
Conflict of interest statement
All authors declares that he or she has no commercial associations (e.g. consultancies, stock ownership, equity interest, patent/licensing arrangement etc.) that might pose a conflict of interest in connection with the submitted article.
Figures

Similar articles
-
Severe COVID-19 pneumonia leads to post-COVID-19 lung abnormalities on follow-up CT scans.Eur J Radiol Open. 2023;10:100483. doi: 10.1016/j.ejro.2023.100483. Epub 2023 Mar 3. Eur J Radiol Open. 2023. PMID: 36883046 Free PMC article.
-
Machine learning automatically detects COVID-19 using chest CTs in a large multicenter cohort.Eur Radiol. 2021 Nov;31(11):8775-8785. doi: 10.1007/s00330-021-07937-3. Epub 2021 May 1. Eur Radiol. 2021. PMID: 33934177 Free PMC article.
-
CT Features of COVID-19 Pneumonia Differ Depending on the Severity and Duration of Disease.Rofo. 2021 Jun;193(6):672-682. doi: 10.1055/a-1293-9163. Epub 2020 Dec 17. Rofo. 2021. PMID: 33336354 English.
-
Similarities and Differences of Early Pulmonary CT Features of Pneumonia Caused by SARS-CoV-2, SARS-CoV and MERS-CoV: Comparison Based on a Systemic Review.Chin Med Sci J. 2020 Sep 30;35(3):254-261. doi: 10.24920/003727. Chin Med Sci J. 2020. PMID: 32972503 Free PMC article.
-
Post-COVID interstitial lung disease in symptomatic patients after COVID-19 disease.Inflammopharmacology. 2023 Apr;31(2):565-571. doi: 10.1007/s10787-023-01191-3. Epub 2023 Mar 24. Inflammopharmacology. 2023. PMID: 36961666 Free PMC article. Review.
Cited by
-
Risk factors for the development of interstitial lung disease following severe COVID-19 pneumonia and outcomes of systemic corticosteroid therapy: 3-month follow-up.Sarcoidosis Vasc Diffuse Lung Dis. 2023 Sep 13;40(3):e2023029. doi: 10.36141/svdld.v40i3.14418. Sarcoidosis Vasc Diffuse Lung Dis. 2023. PMID: 37712369 Free PMC article.
References
LinkOut - more resources
Full Text Sources
Research Materials
Miscellaneous