. 2023 Nov;20(11):506-519.
doi: 10.1080/15459624.2023.2231516. Epub 2023 Aug 22.

Sampling and recovery of infectious SARS-CoV-2 from high-touch surfaces by sponge stick and macrofoam swab

Affiliations

Sampling and recovery of infectious SARS-CoV-2 from high-touch surfaces by sponge stick and macrofoam swab

Rachael L Hardison et al. J Occup Environ Hyg. 2023 Nov.

Abstract

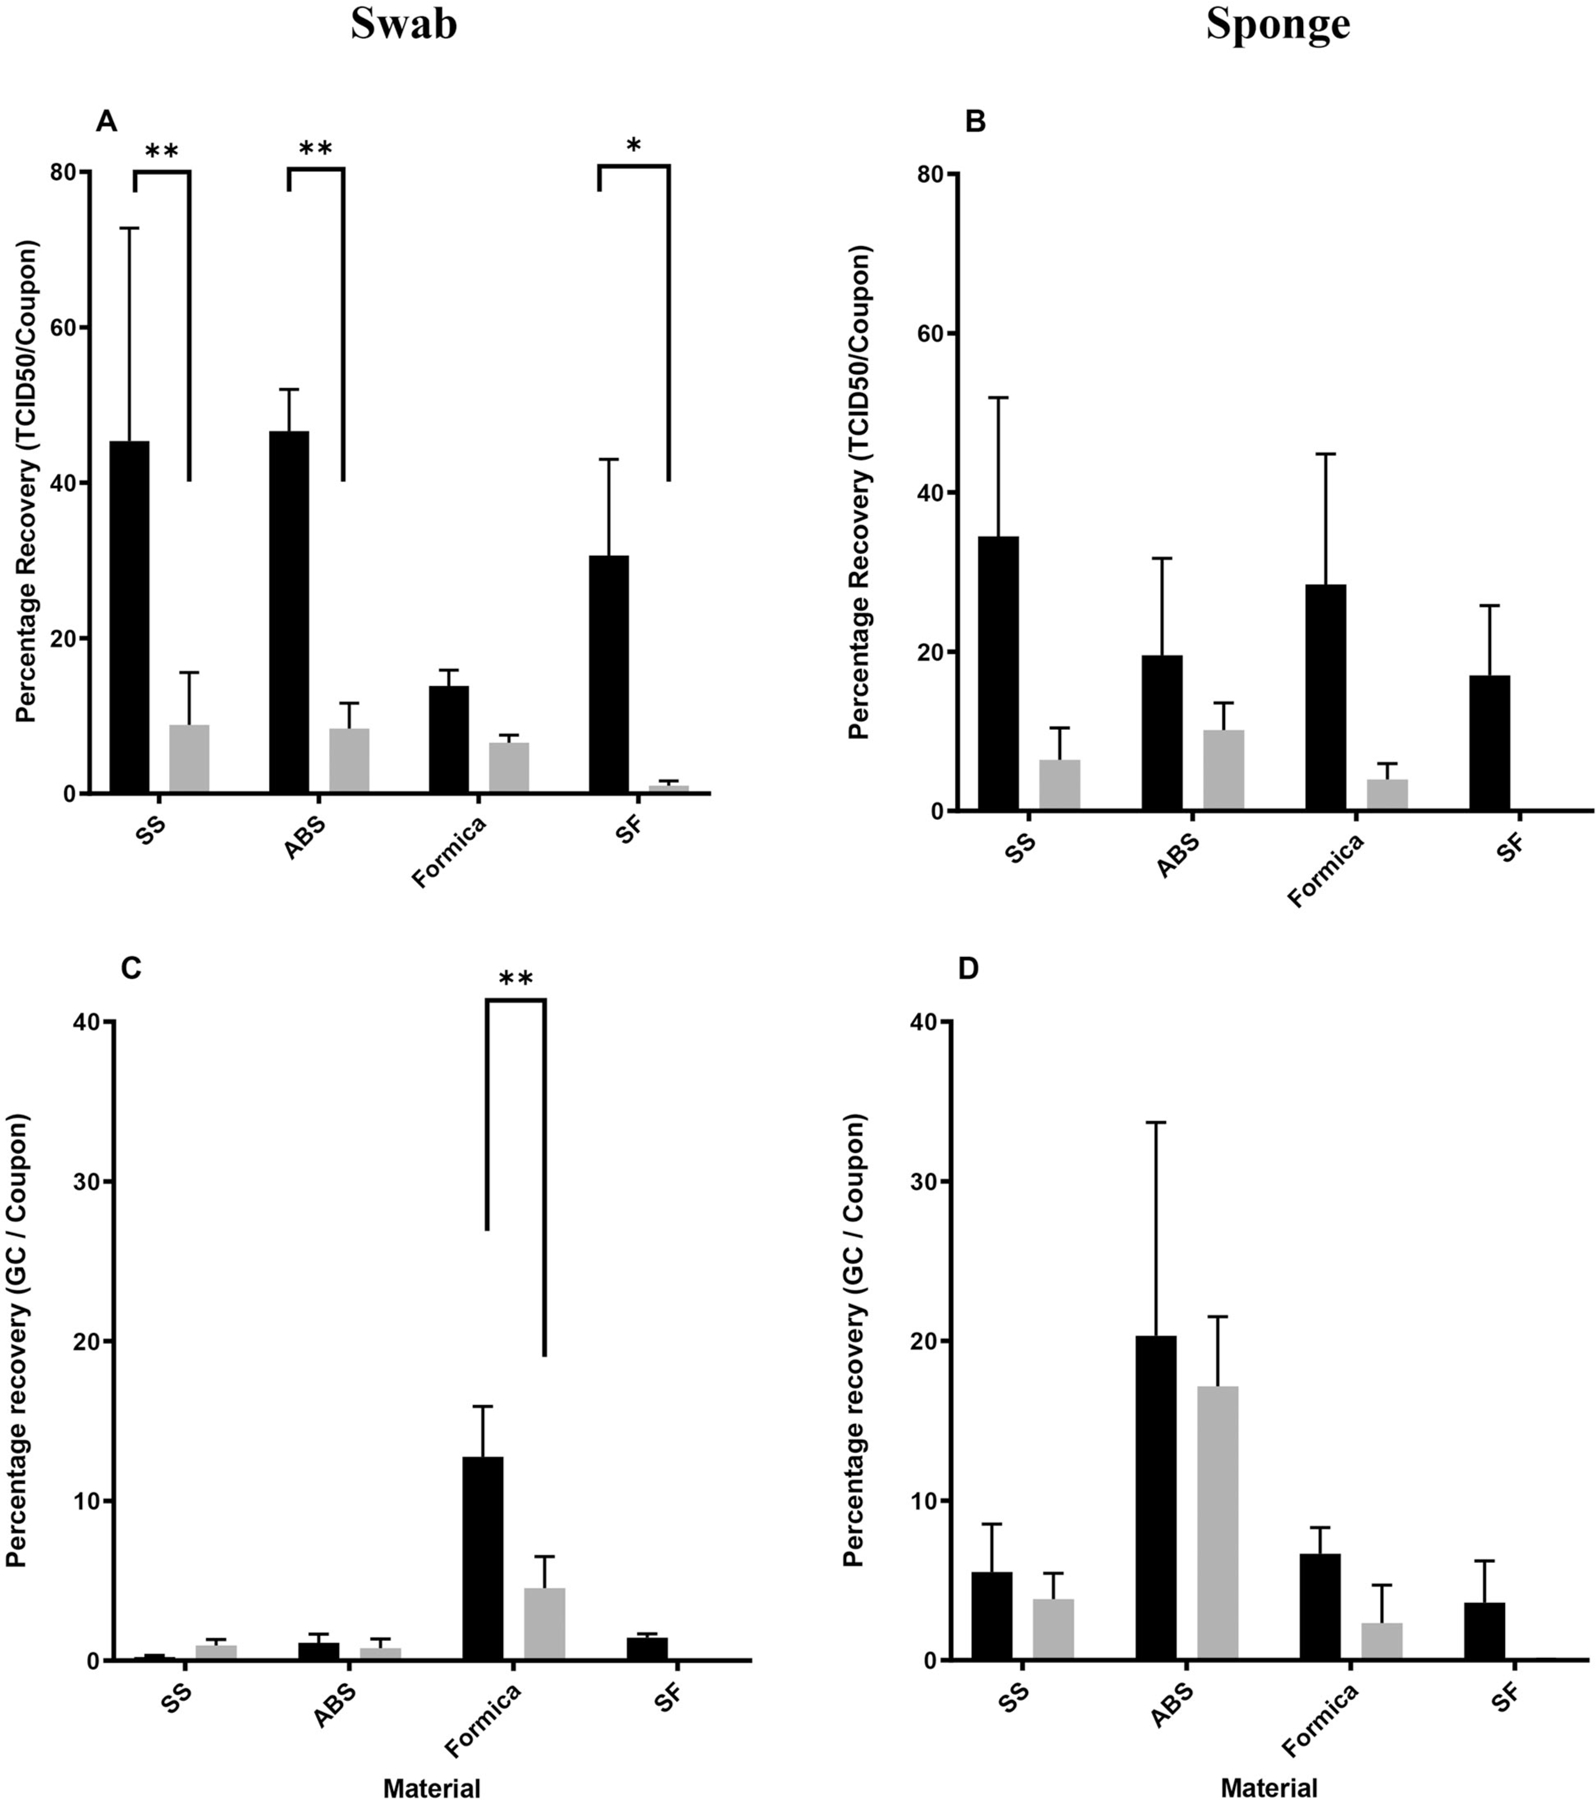
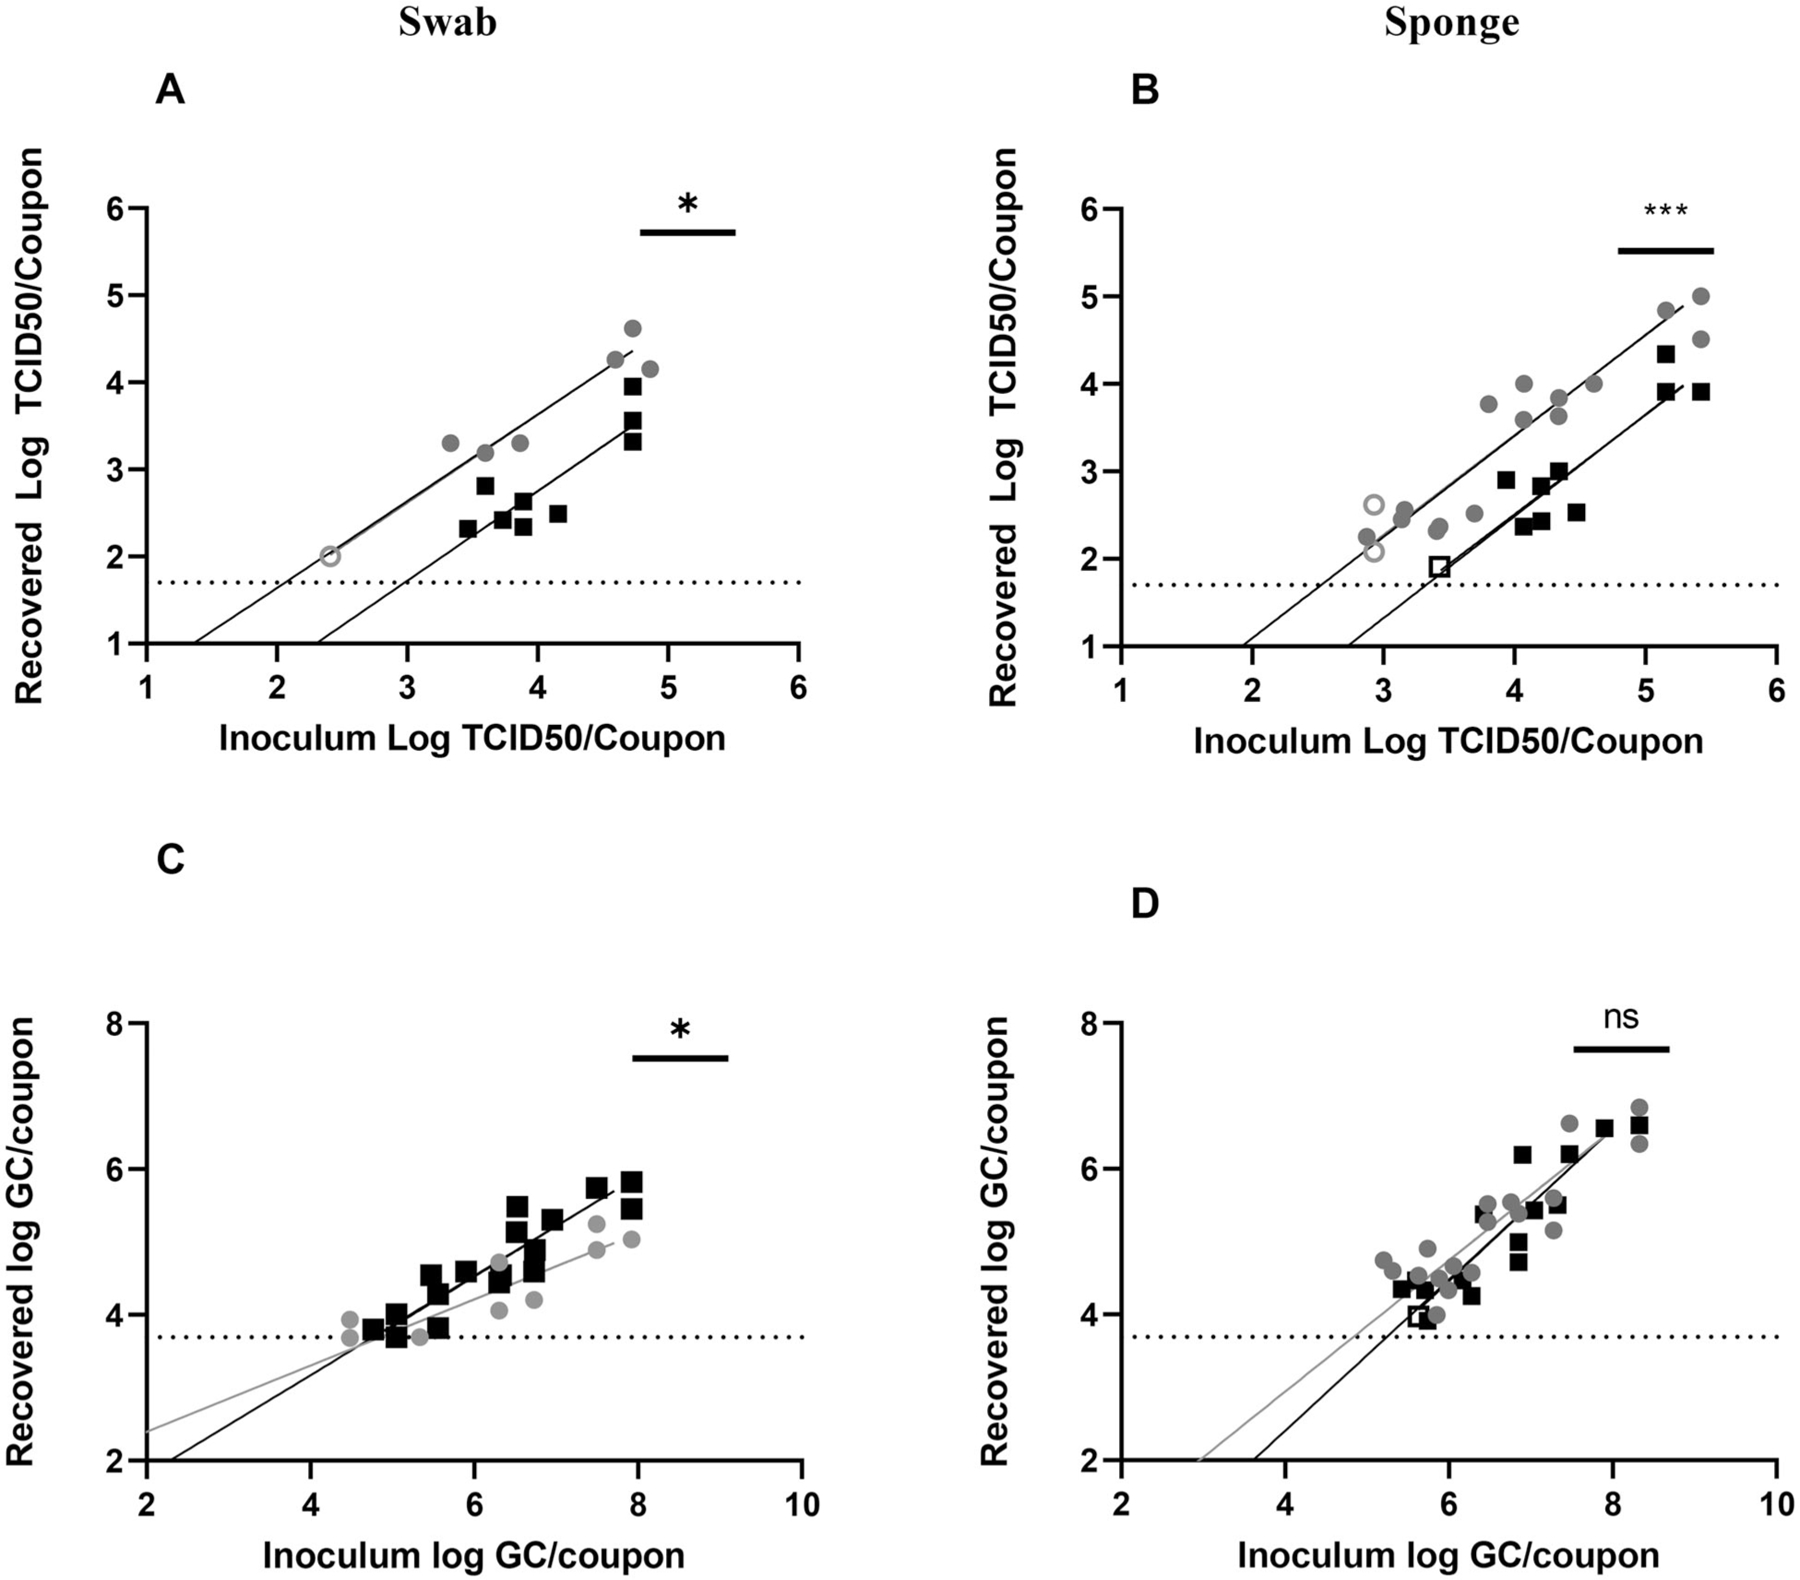
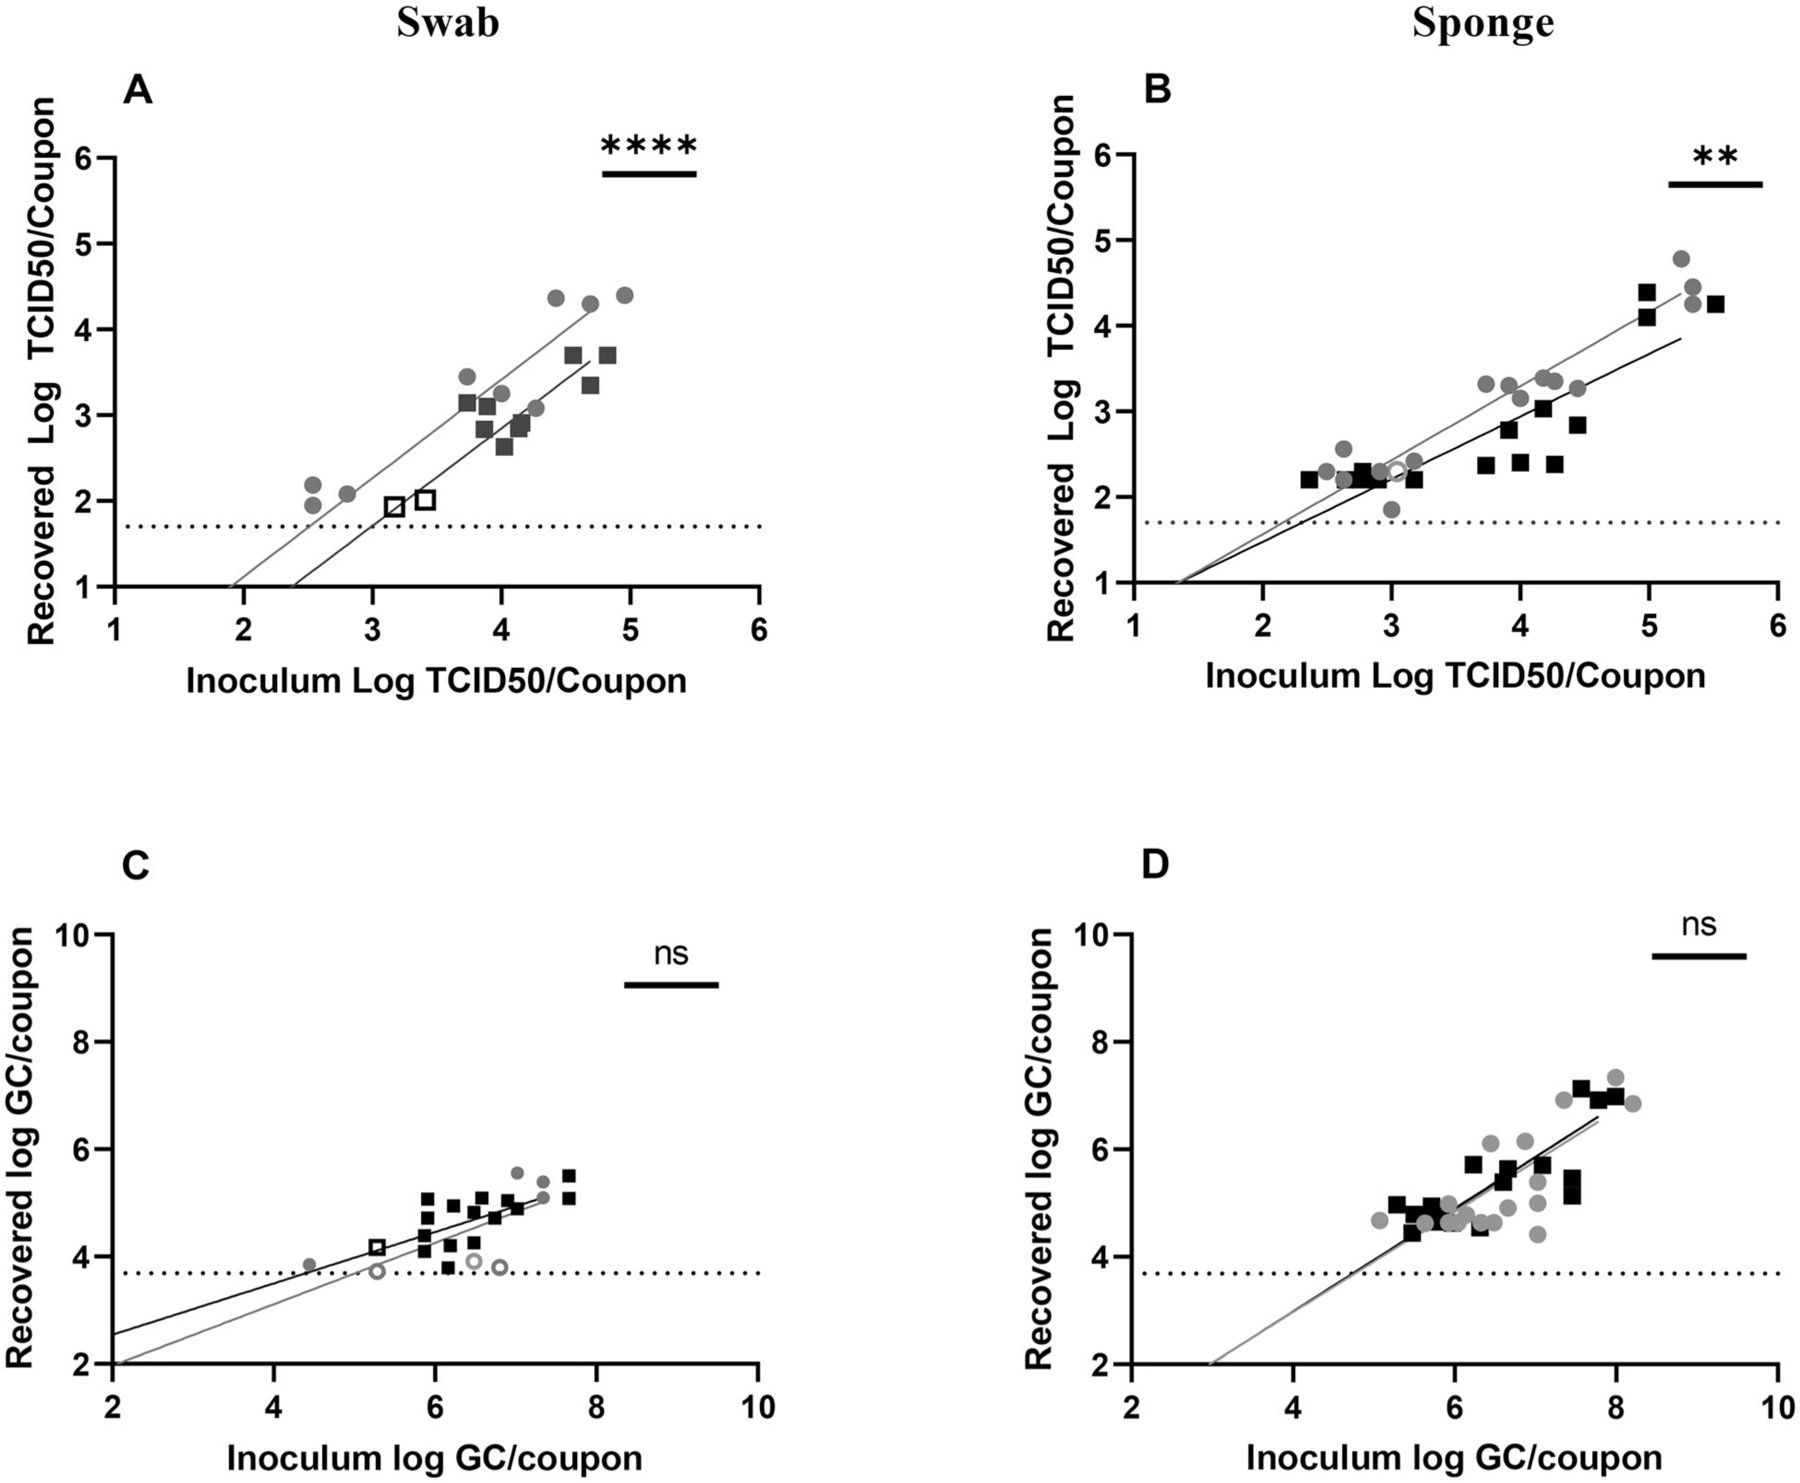
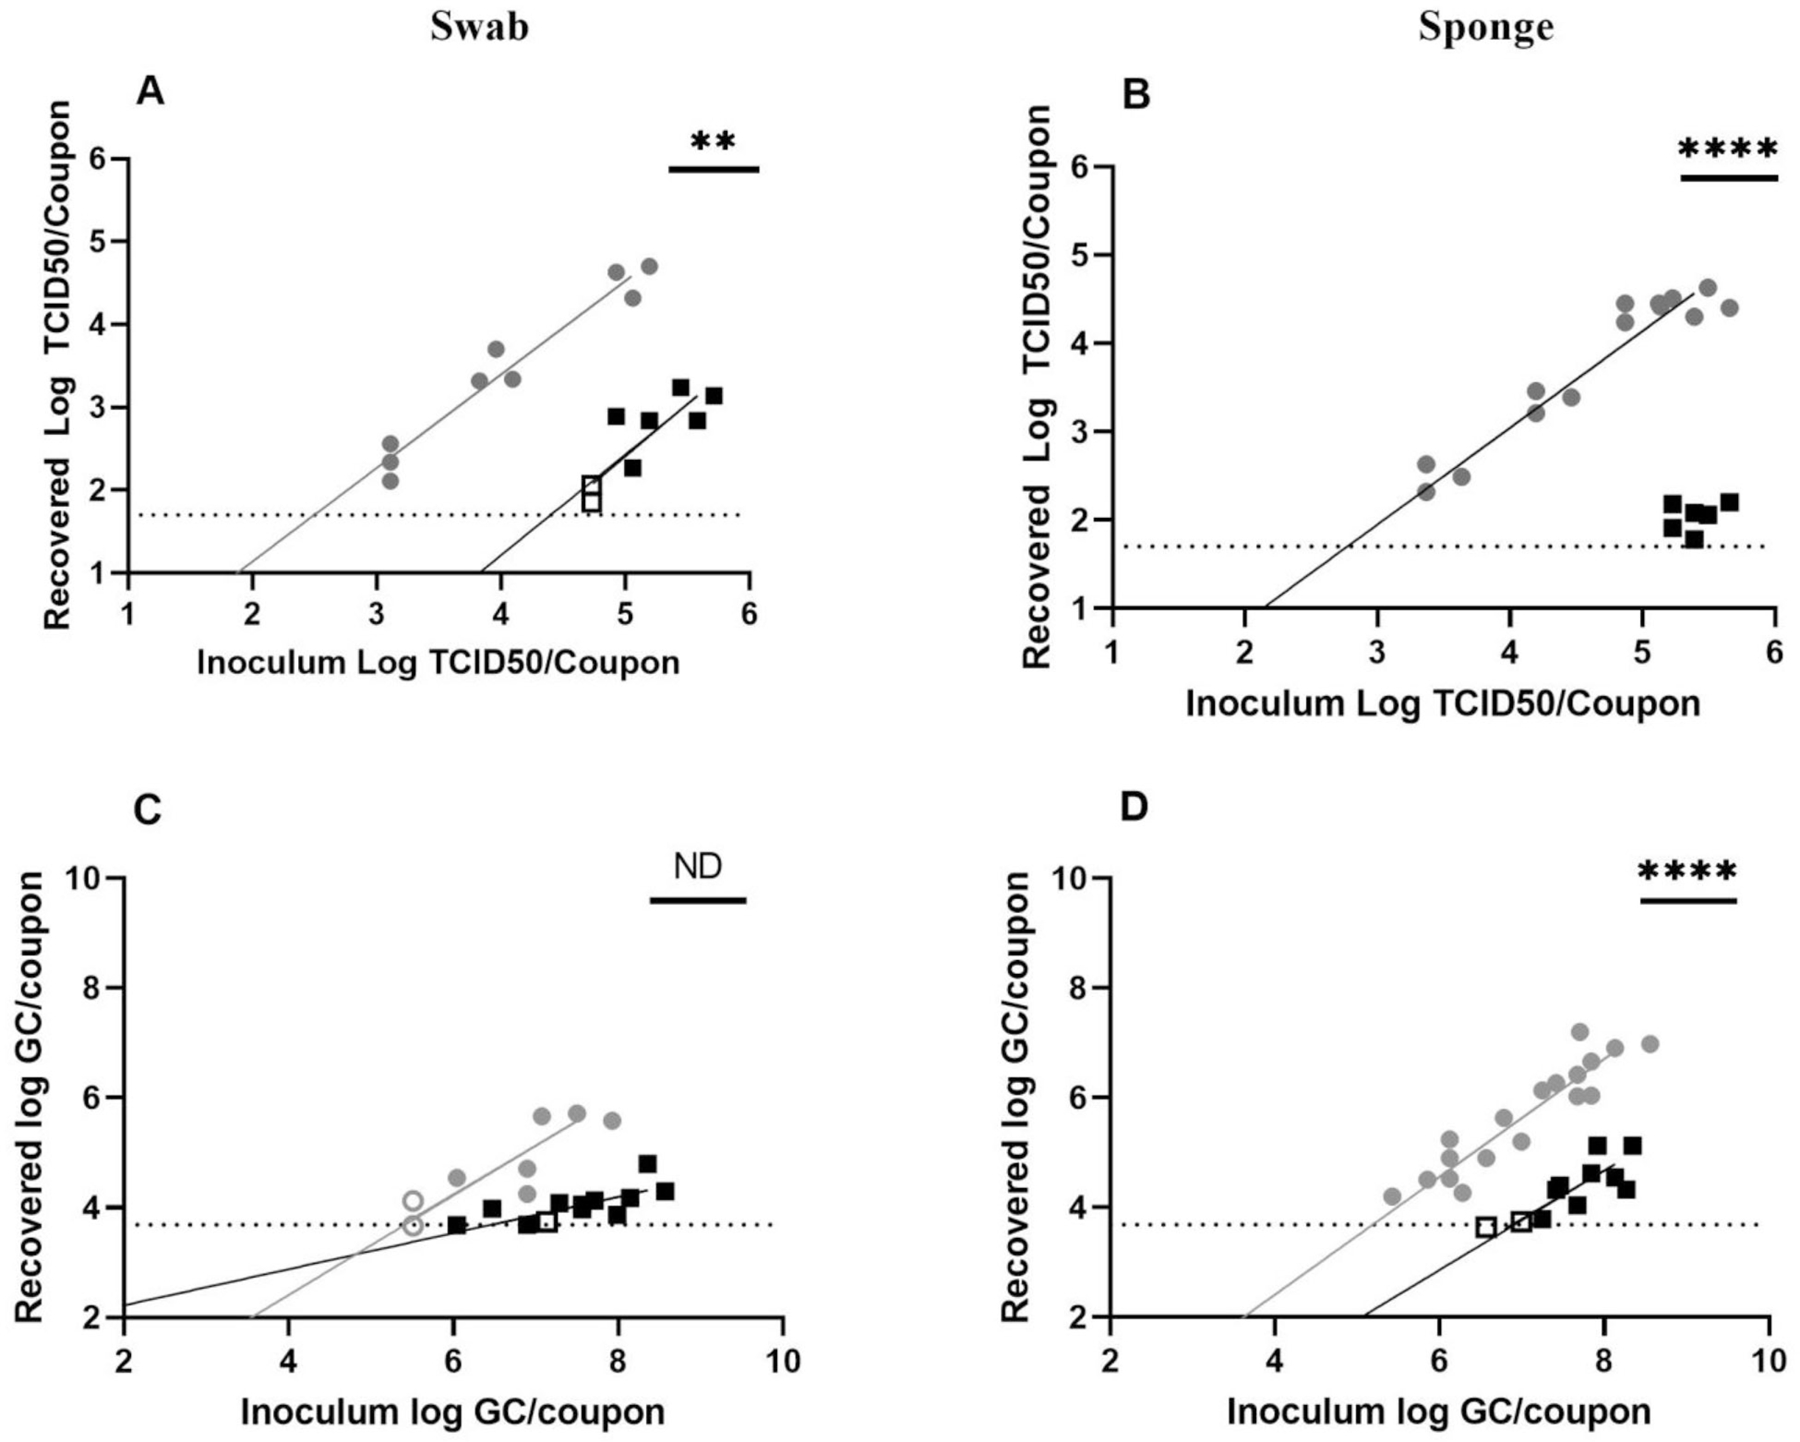
Effective sampling for severe acute respiratory syndrome 2 (SARS-CoV-2) is a common approach for monitoring disinfection efficacy and effective environmental surveillance. This study evaluated sampling efficiency and limits of detection (LODs) of macrofoam swab and sponge stick sampling methods for recovering infectious SARS-CoV-2 and viral RNA (vRNA) from surfaces. Macrofoam swab and sponge stick methods were evaluated for collection of SARS-CoV-2 suspended in a soil load from 6-in2 coupons composed of four materials: stainless steel (SS), acrylonitrile butadiene styrene (ABS) plastic, bus seat fabric, and Formica. Recovery of infectious SARS-CoV-2 was more efficient than vRNA recovery on all materials except Formica (macrofoam swab sampling) and ABS (sponge stick sampling). Macrofoam swab sampling recovered significantly more vRNA from Formica than ABS and SS, and sponge stick sampling recovered significantly more vRNA from ABS than Formica and SS, suggesting that material and sampling method choice can affect surveillance results. Time since initial contamination significantly affected infectious virus recovery from all materials, with vRNA recovery showing limited to no difference, suggesting that SARS-CoV-2 vRNA can remain detectable after viral infectivity has dissipated. This study showed that a complex relationship exists between sampling method, material, time from contamination to sampling, and recovery of SARS-CoV-2. In conclusion, data show that careful consideration be used when selecting surface types for sampling and interpreting SARS-CoV-2 vRNA recovery with respect to presence of infectious virus.

Keywords: Limit of detection; SARS-CoV-2 recovery; sampling efficiency; surface sampling.


Figures

Figure 1.
Figure 1.
Recovery of (A, B) infectious SARS-CoV-2 and (C, D) vRNA collected from coupons inoculated with SARS-CoV-2 (4.87E + 04 ± 5.71E + 03 TCID50/coupon – 2.46E + 05 ± 6.74E + 03 TCID50/coupon) and sampled via (A, C) macrofoam swab and (B, D) sponge methods. Percentage recovery (mean, standard deviation, n = 3–6) for each material and sampling method was determined using recovered per coupon values over inoculum values. Data represented were recovered at T0 (black bars) and T3 (gray bars). Data are shown as percentage recovery of (A, B) TCID50/coupon or (C, D) GC/coupon (genome copy). *p ≤ 0.05; **p ≤ 0.01; ***p ≤ 0.001; ****p ≤ 0.0001.
Figure 2.
Figure 2.
Recovery of SARS-CoV-2 from SS using (A, C) swab and (B, D) sponge methods. Results from T0 recovery (gray circles) or T3 recovery (black squares). Open circles or squares identify samples in which at least one replicate was below the LOD. Data shown on graphs represent individual recovery values. Linear regression lines, shaded in gray (T0) or black (T3), are shown. Details of each linear regression are shown in Supplemental Table S2. Bars on each graph represent significant differences between recovery at T0 and T3, as determined by linear regression comparison (Graphpad Prism v9.3.1). ns: not significant; *p ≤ 0.05; **p ≤ 0.01; ***p ≤ 0.001; ****p ≤ 0.0001.
Figure 3.
Figure 3.
Sampling of SARS-CoV-2 on ABS plastic. Recovery from (A, C) swab and (B, D) sponge methods with results from T0 recovery (gray circles) or T3 recovery (black squares). Open circles or squares identify samples in which at least one replicate was below the LOD. Data shown on graphs represent individual recovery values. Linear regression lines, shaded in gray (T0) or black (T3), are shown. Details of each linear regression are shown in Supplemental Table S2. Bars on each graph represent significant differences between recovery at T0 and T3, as determined by linear regression comparison (Graphpad Prism v9.3.1). ns: not significant, *p ≤ 0.05; **p ≤ 0.01; ***p ≤ 0.001; ****p ≤ 0.0001.
Figure 4.
Figure 4.
Sampling of SARS-CoV-2 on Formica. Recovery from (A, C) swab and (B, D) sponge methods with results from T0 recovery (gray circles) or T3 recovery (black squares). Open circles or squares identify samples in which at least one replicate was below the LOD. Data shown on graphs represent individual recovery values. Linear regression lines, shaded in gray (T0) or black (T3), are shown. Details of each linear regression are shown in Supplemental Table S2. Bars on each graph represent significant differences between recovery at T0 and T3, as determined by linear regression comparison (Graphpad Prism v9.3.1). ns: not significant; *p ≤ 0.05; **p ≤ 0.01; ***p ≤ 0.001; ****p ≤ 0.0001.
Figure 5.
Figure 5.
Sampling of SARS-CoV-2 on seat fabric. Recovery from (A, C) swab and (B, D) sponge methods with results from T0 recovery (gray circles) or T3 recovery (black squares). Open circles or squares identify samples in which at least one replicate was below the LOD. Data shown on graphs represent individual recovery values. Linear regression lines, shaded in gray (T0) or black (T3), are shown. Details of each linear regression are shown in Supplemental Table S2. Bars on each graph represent significant differences between recovery at T0 and T3, as determined by linear regression comparison (Graphpad Prism v9.3.1). ns: not significant; *p ≤ 0.05; **p ≤ 0.01; ***p ≤ 0.001; ****p ≤ 0.0001. ND indicates that regression comparison was not possible owing to difference in line slopes.

References

    1. Ardura A, Dopico E, Fernandez S, Garcia-Vazquez E. 2021. Citizen volunteers detect SARS-CoV-2 RNA from outdoor urban fomites. Sci Total Environ 787:147719. doi: 10.1016/j.scitotenv.2021.147719. - DOI
    1. Baudoux P, Carrat C, Besnardeau L, Charley B, Laude H. 1998. Coronavirus pseudoparticles formed with recombinant M and E proteins induce alpha interferon synthesis by leukocytes. J Virol 72(11):8636–8643. doi:10.1128/JVI.72.11.8636-8643.1998. - DOI - PMC - PubMed
    1. Casanova LM, Jeon S, Rutala WA, Weber DJ, Sobsey MD. 2010. Effects of air temperature and relative humidity on coronavirus survival on surfaces. Appl Environ Microbiol 76(9):2712–2717. doi:10.1128/AEM.02291-09. - DOI - PMC - PubMed
    1. Centers for Disease Control and Prevention (CDC). 2012. Surface sampling procedures for Bacillus anthracis spores from smooth, non-porous surfaces. Centers for Disease Control and Prevention; [updated 2012 Jan 30 2012; accessed 2022 Sept 1]. https://www.cdc.gov/niosh/topics/emres/surface-sampling-bacillus-anthrac....
    1. Centers for Disease Control and Prevention (CDC). 2021a. Guidance on the inactivation or removal of select agents and toxins for future use. Centers for Disease Control and Prevention; [updated 2021 Jan 28; accessed 2022 Sept 1]. https://www.selectagents.gov/compliance/guidance/inactivation/index.htm.

Publication types

Substances