Review
. 2023 Oct 24;19(20):6859-6890.
doi: 10.1021/acs.jctc.3c00347. Epub 2023 Jun 29.

TURBOMOLE: Today and Tomorrow

Affiliations
Review

TURBOMOLE: Today and Tomorrow

Yannick J Franzke et al. J Chem Theory Comput. .

Abstract

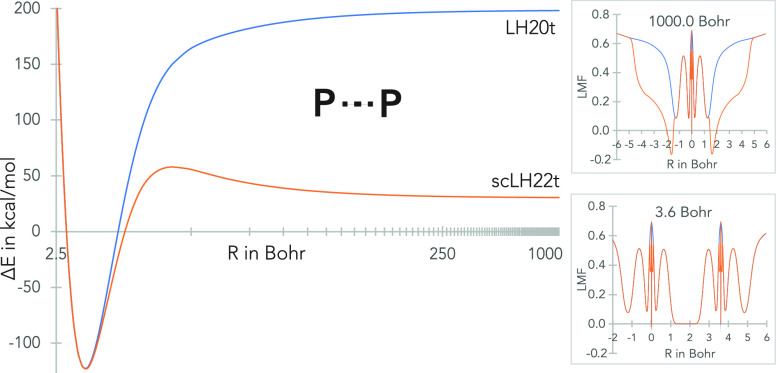
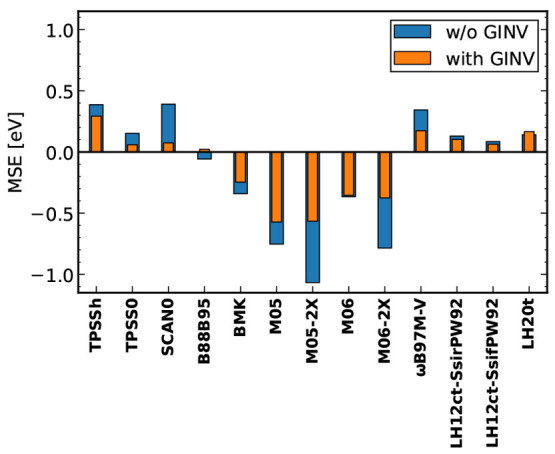
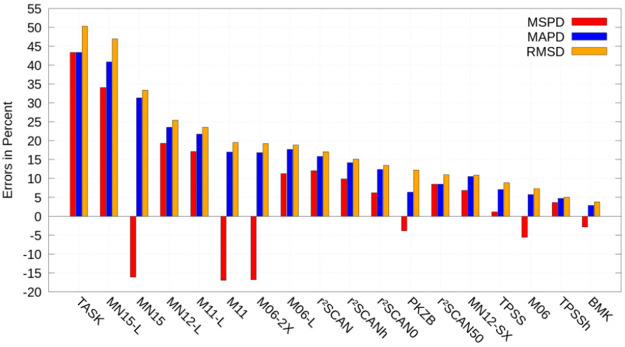
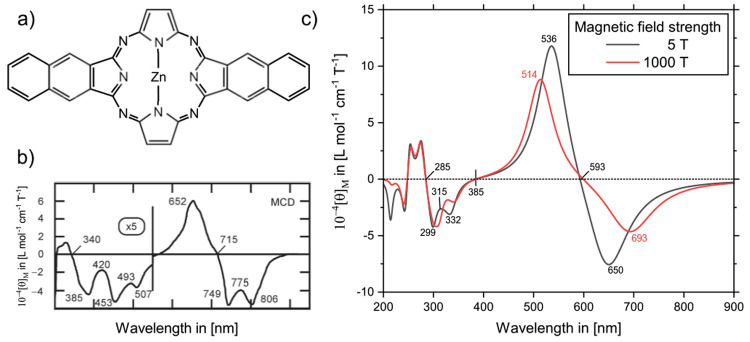
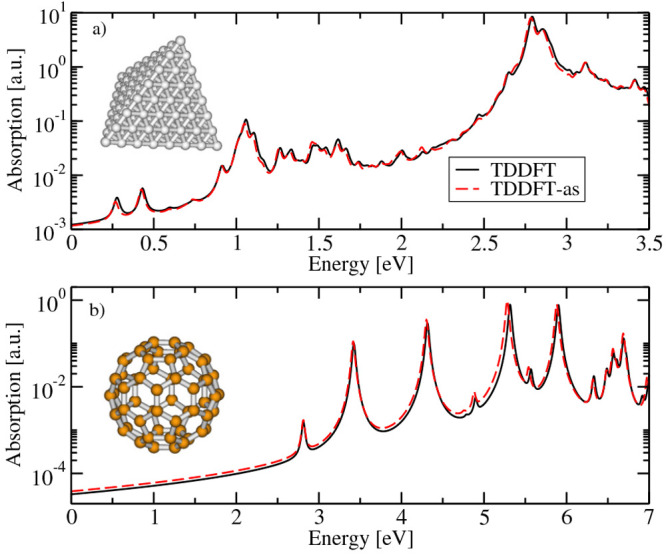
TURBOMOLE is a highly optimized software suite for large-scale quantum-chemical and materials science simulations of molecules, clusters, extended systems, and periodic solids. TURBOMOLE uses Gaussian basis sets and has been designed with robust and fast quantum-chemical applications in mind, ranging from homogeneous and heterogeneous catalysis to inorganic and organic chemistry and various types of spectroscopy, light-matter interactions, and biochemistry. This Perspective briefly surveys TURBOMOLE's functionality and highlights recent developments that have taken place between 2020 and 2023, comprising new electronic structure methods for molecules and solids, previously unavailable molecular properties, embedding, and molecular dynamics approaches. Select features under development are reviewed to illustrate the continuous growth of the program suite, including nuclear electronic orbital methods, Hartree-Fock-based adiabatic connection models, simplified time-dependent density functional theory, relativistic effects and magnetic properties, and multiscale modeling of optical properties.


Conflict of interest statement

The authors declare the following competing financial interest(s): Principal Investigator Filipp Furche has an equity interest in TURBOMOLE GmbH. The terms of this arrangement have been reviewed and approved by the University of California, Irvine, in accordance with its conflict of interest policies. Christof Hattig and David P. Tew have an equity interest in TURBOMOLE GmbH. Marek Sierka and Florian Weigend have an equity interest in TURBOMOLE GmbH and serve as its chief executive officers.

Figures

Figure 1
Figure 1
Spin-restricted dissociation curve of P2 with the original (LH20t) and sc-corrected t-LMF (scLH22t) along the bond axis for different distances on the dissociation curve (right). See ref (135) for related graphics for other molecules.
Figure 2
Figure 2
Effect of restoring gauge invariance (GINV) for various τ-dependent functionals on the average deviation of vertical TDDFT excitation energies from the experimental absorption maxima for five Ni(II) complexes. Reprinted from ref (145) with permission. Copyright 2022 AIP Publishing.
Figure 3
Figure 3
Impact of the current-dependent generalization of τ for various density functional approximations on the isotropic Δg-shift of [MoNCl4]2–, [MoOF4], [MoOCl4], [MoOF5]2–, [MoOBr5]2–, [TcNF4], [TcNCl4], and [TcNBr4]. Results with the well-known field-dependent generalization serve as reference. We list the mean signed percentwise deviation (MSPD), the mean absolute percentwise deviation (MAPD), and the root-mean-square deviation (RMSD). Reprinted from ref (118) under a CC BY license. Copyright 2022 the Authors.
Figure 4
Figure 4
MCD spectrum of ZnDiNTAP. (a) Molecular structure. (b) Experimental spectrum. Reprinted with permission from ref (180). Copyright 2007 RSC Publishing. (c) Spectra as calculated in finite magnetic fields of 5 and 1000 T. Adapted with permission from ref (176). Copyright 2022 the Authors.
Figure 5
Figure 5
Molecular structure of single-molecule magnets [Lu(OAr*)3] and [TbPc2]. Reprinted with permission from ref (151) under a CC BY license. Copyright 2022 the Authors.
Figure 6
Figure 6
Fitted Karplus equation for Sn compounds: 3J = Acos(2ϕ) + Bcos(ϕ) + C. For each Sn–Sn torsion angle ϕ, the average of the 3JSnSn coupling constant over 13 compounds is computed. Blue, BH&HLYP/x2c-TZVPall-2c; red, GW-cBSE@BH&HLYP; and Exp., experimental findings. Adapted with permission from ref (61). Copyright 2022 the Authors.
Figure 7
Figure 7
Computational results (ωB97X-D/x2c-TZVPall-s) and experimental findings for two negatively charged Ru(III) compounds. Adapted with permission from ref (149). Copyright 2022 the Authors.
Figure 8
Figure 8
Total wall times for SCF and NMR calculations with respect to the number of glucose units (6-31G* basis). Wall times were measured on a single thread of an Intel Xeon Gold 6212U CPU (2.40 GHz). Reprinted with permission from ref (63). Copyright 2021 the Authors.
Figure 9
Figure 9
Aromatic ring current of [Th@Bi12]4–. The color scheme (red to blue) indicates strong to weak currents. Data from ref (205)
Figure 10
Figure 10
Contour plots of the HOMO (left) and LUMO (right) of [An(CpiPr5)2] determined with TPSS, Stuttgart–Cologne scalar relativistic ECPs, and the corresponding basis sets., Orbital isovalues of 0.03 were used. Reprinted with permission from ref (225). Copyright 2019 American Chemical Society.
Figure 11
Figure 11
Scheme for T-matrix-based multiscale modeling of light–matter interactions using damped response polarizabilities as outlined in ref (254). Reprinted with permission from ref (254) under a CC BY-NC-ND license. Copyright 2022 the Authors.
Figure 12
Figure 12
ECD (upper panel) and absorption spectra (lower panel) of (4Sp)-4,7-dicyano-12,13,15,16-tetramethyl[2.2]-paracyclophane computed at the CC2/aug-cc-pVDZ level. The MP2-optimized structure and the experimental CD spectrum have been taken from ref (263). Results from damped response theory are plotted as blue squares; the blue line is a cubic spline fit to these computed points. Stick spectra are the results from state-wise calculations, and the red and orange lines are obtained by convoluting these computed stick spectra with a Lorentzian broadening with a half-width-at-half-maximum of ≈1000 cm–1 including, respectively, the lowest 14 and 59 states.
Figure 13
Figure 13
Computed (left) and experimental (right) TA spectra of pyrene in the gas phase. Band origins of S1 and S2 were shifted by −0.42 and −0.02 eV, respectively. Experimental spectra reprinted from ref (278). Copyright 1999 Hindawi Publishing Corporation. Distributed under a CC-BY license.
Figure 14
Figure 14
Experimental absorption spectrum of 1,2,4,5-tetrafluorobenzene (black) compared with the spectra simulated using the (adiabatic Hessian, AH) global harmonic method (“Harmonic”, blue dotted line) and single-Hessian TGA with either the adiabatic Hessian (AH, red dashed line, evaluated in the excited electronic state at its corresponding optimized geometry) or the initial Hessian (IH, green dash-dotted line, ground-state Hessian computed at the ground-state optimized geometry). All electronic structure calculations, including geometry optimization, energies, and forces for the ab initio dynamics and Hessians, were performed at the CC2/def2-TZVP level. Adapted with permission from ref (294). Copyright 2022 American Chemical Society.
Figure 15
Figure 15
EAs of a water tetramer cluster for different dimer separations (R) computed using GKS-spRPA, ΔHF, ΔCCSD(T), and EOM-CCSD(T)a* methods. The inset shows the arrangement of the tetramer with a 70% isosurface of the LUMO at R = 4.047 Å. aug-cc-pVDZ basis sets were used for O and H atoms, and a 7s7p set of basis functions located at the center of the cluster was used. The shaded (unshaded) area of the plot corresponds to NVCB (NVEB) anionic states. Reprinted with permission from ref (309). Copyright 2021 American Chemical Society.
Figure 16
Figure 16
XE spectra of S8 from experiments, and the SR-GKS-spRPA method. The computed spectrum (in blue) was obtained by Gaussian broadening of the vertical transitions (red lines) using a width parameter of 1 eV. The vertical dashed lines denote the two intense peak positions for SR-GKS-spRPA. Reprinted and adapted with permission from ref (310). Copyright 2022 American Chemical Society.
Figure 17
Figure 17
Plots of the five highest occupied orbitals at isovalues of ±0.02 shown for (a) PBE and (b) GKS-spRPA (with the PBE potential). The structure of quinacridone was optimized with PBE-D3 and cc-pVTZ basis sets. Reproduced from ref (317) with the permission of AIP Publishing.
Figure 18
Figure 18
Wall-clock timings of PNO-CCSD(T) and PNO-CCSD(T)(F12*) calculations for alkane chains (+) and NaCl clusters (cross).
Figure 19
Figure 19
(a) Experimental linear absorption spectra and (b) HHG spectra of 100 nm thick TPP and ZnTPP samples. (c) Calculated linear absorption spectra and (d) HHG spectra of TPP and ZnTPP molecules.
Figure 20
Figure 20
Computed spectra of acetone isolated (red) and surrounded by 237 water molecules (blue).
Figure 21
Figure 21
Acetone + H2O in a cubic box of 15 Å containing 113 water molecules visualized using CrysX-3D Viewer.
Figure 22
Figure 22
Self-consistent total energy differences |E(Nk1/3) – E(∞)| per primitive cell for the PBE and HF methods. LiH is calculated in the rocksalt structure with a lattice constant of 4.084 Å and is described with the basis set from ref (340). For Si, we use the diamond structure with a lattice constant of 5.430 Å and the pob-TZVP and def-SVP basis sets. E(∞) is approximated by the energy obtained with a 31 × 31 × 31 k-mesh, since |E(25) – E(31)| < 4 × 10⁻¹⁰ a.u. for LiH and Si. Reprinted with permission from ref (328). Copyright 2018 American Chemical Society.
Figure 23
Figure 23
Nuclear orbitals as isosurfaces of the total densities with a cutoff of 0.0001 calculated with NEO-HF in the dscf program using the def2-TZVP basis for electrons and DZSPDN for protons. White, classical proton; pink, center for basis set of a quantum proton; red, oxygen; and blue, nitrogen. (a) trans-Zundel isomer of H9O4+, (b) neutral glycine, and (c) zwitterionic glycine.
Figure 24
Figure 24
Dissociation energy curves for (a) a coronene dimer and (b) H2, as computed with different methods. For the coronene dimer, reference data are taken from the literature,, and the equilibrium distance is R0 = 3.458 Å. All calculations were performed with the hfacm script. The coronene dimer results are based on a complete basis set extrapolation from cc-pVQZ results. H2 calculations employed the aug-cc-pVQZ basis set. The strong-correlation functional used in the HFAC results is the hPC model.
Figure 25
Figure 25
TDDFT and TDDFT-as absorption spectra (in log scale) for (a) Ag120 and (b) fullerene determined using the PBE XC functional and a Lorentzian broadening of 20 meV.

References

    1. Ahlrichs R.; Bär M.; Häser M.; Horn H.; Kölmel C. Electronic structure calculations on workstation computers: The program system TURBOMOLE. Chem. Phys. Lett. 1989, 162, 165–169. 10.1016/0009-2614(89)85118-8. - DOI
    1. Häser M.; Ahlrichs R. Improvements on the direct SCF method. J. Comput. Chem. 1989, 10, 104–111. 10.1002/jcc.540100111. - DOI
    1. Häser M.; Ahlrichs R.; Baron H. P.; Weis P.; Horn H. Direct computation of second-order SCF properties of large molecules on workstation computers with an application to large carbon clusters. Theor. Chim. Acta 1992, 83, 455–470. 10.1007/BF01113068. - DOI
    1. Haase F.; Ahlrichs R. Semidirect MP2 gradient evaluation on workstation computers: The MPGRAD program. J. Comput. Chem. 1993, 14, 907–912. 10.1002/jcc.540140805. - DOI
    1. Brode S.; Horn H.; Ehrig M.; Moldrup D.; Rice J. E.; Ahlrichs R. Parallel Direct SCF and Gradient Program For Workstation Clusters. J. Comput. Chem. 1993, 14, 1142–1148. 10.1002/jcc.540141004. - DOI