. 2023 Oct;72(10):3175-3189.
doi: 10.1007/s00262-023-03482-8. Epub 2023 Jun 29.

Prognostic survival biomarkers of tumor-fused dendritic cell vaccine therapy in patients with newly diagnosed glioblastoma

Affiliations

Prognostic survival biomarkers of tumor-fused dendritic cell vaccine therapy in patients with newly diagnosed glioblastoma

Jun Takei et al. Cancer Immunol Immunother. 2023 Oct.

Abstract

Dendritic cell (DC)-based immunotherapy has been applied to glioblastoma (GBM); however, biomarkers informing response remain poorly understood. We conducted a phase I/IIa clinical trial investigating tumor-fused DC (TFDC) immunotherapy following temozolomide-based chemoradiotherapy in patients with newly diagnosed GBM and determined prognostic factors in patients receiving TFDC immunotherapy. Twenty-eight adult patients with GBM isocitrate dehydrogenase (IDH) wild-type (IDH-WT) were enrolled; 127 TFDC vaccine injections (4.5 ± 2.6 times/patient) were administered. Patients with GBM IDH-WT had a respectable 5-year survival rate (24%), verifying the clinical activity of TFDC immunotherapy, particularly against O6-methylguanine-DNA methyltransferase (MGMT) unmethylated GBM (5-year survival rate: 33%). To identify novel factors influencing overall survival (OS) in GBM IDH-WT treated with TFDC immunotherapy, clinical parameters were assessed and comprehensive molecular profiling involving transcriptome and exome analyses was performed. MGMT promoter methylation status, extent of tumor resection, and vaccine parameters (administration frequency, DC and tumor cell numbers, and fusion ratio) were not associated with survival following TFDC immunotherapy. Old age and pre- and post-operative Karnofsky performance status were significantly correlated with OS. Low HLA-A expression and lack of CCDC88A, KRT4, TACC2, and TONSL mutations in tumor cells were correlated with better prognosis. We validated the activity of TFDC immunotherapy against GBM IDH-WT, including chemoresistant, MGMT promoter unmethylated cases. The identification of molecular biomarkers predictive of TFDC immunotherapy efficacy in GBM IDH-WT will facilitate the design of and patient stratification in a phase-3 trial to maximize treatment benefits.

Keywords: Dendritic cell; Glioblastoma; Immunotherapy; Prognostic factor; Whole tumor cell.


Conflict of interest statement

The authors have no relevant financial or non-financial interests to disclose.

Figures

Fig. 1
Fig. 1
Schematic diagram of the present study. a Flowchart of patients included in the present study. b Tumor cells from surgical specimens and DCs purified from PBMCs were fused, and three doses of the vaccine plus one to two booster doses were administered following postoperative chemoradiotherapy. c Kaplan–Meier analysis of survival probability in the current cohort (n = 28). d Kaplan–Meier analysis of survival probability in GBM IDH wild-type tumors stratified by MGMT promoter methylation status (n = 28)
Fig. 2
Fig. 2
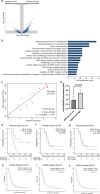
Whole-transcriptome analysis and OS of patients stratified by HLA expression levels. Whole-transcriptome analysis was performed on 15 samples derived from GBM IDH wild-type. a Volcano plot of the distribution of DEGs in patients with longer and shorter survival. b Top 15 biological process GO terms associated with 473 DEGs. c, d RT-PCR analysis was performed for 14 samples derived from GBM IDH wild-type. Scatter plot of HLA-A expression levels, determined using NGS and RT-PCR. Blue circles represent the HLA-A low-expression group, and red circles represent the high-expression group (c). HLA-A mRNA expression levels were compared between high and low HLA-A expression groups, determined using NGS (d). eg Kaplan–Meier survival curves for patients with high and low expression levels of HLA-A (e), HLA-B (f), and HLA-C (g) in the study cohort. hj Survival curves for patients with high and low expression levels of HLA-A (h), HLA-B (i), and HLA-C (j) in the CGGA dataset from 220 patients with GBM IDH wild-type
Fig. 3
Fig. 3
Immunohistochemical analysis of HLA expression in tumor cells and immunoregulatory cell infiltration in the tumor. Immunohistochemical analysis of surgical specimens was performed on 28 samples of GBM IDH wild-type. a Expression of HLA-A, CD8, Foxp3, and PD-L1 in tumor specimens with high and low HLA-A expression levels determined through NGS (×400; bar = 200 µm). b Scatter plot of HLA-A expression levels, determined using NGS and IHC-positive areas (n = 15). c Kaplan–Meier survival curves for patients with high and low HLA-A IHC-positive areas (n = 28). d PD-L1 positivity in the high and low HLA-A staining groups (N = 28). e Kaplan–Meier survival curves for patients with expression score of PD-L1 (n = 28). f, g Foxp3/CD3- and Foxp3/CD8-positive cell ratios in the high and low HLA-A staining groups (n = 28). Data are presented as the mean ± standard deviation (SD). h Numbers of PD-1-positive cells in the high- and low-HLA-A staining groups (n = 28). Data are presented as the mean ± SD
Fig. 4
Fig. 4
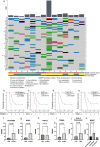
Genetic variations found in 14 GBM tumors using whole-exome sequencing. a Whole-exome sequencing was performed on 14 paired samples of PBMCs and tumor DNA derived from GBM IDH wild-type. Bar plots show the TMB (number of mutations per megabase) (upper). A total of 55 genetic variants were identified in more than three samples each (middle). The color bar shows MGMT promoter methylation status (gray, unmethylated; orange, methylated; purple, not detected) (upper), sample groups stratified by HLA-A expression (green represents the low-expression group and yellow represents the high-expression group) (middle), and median overall survival (blue represents the long-survival group and red represents the short-survival group) (lower). bi Four candidate genes with prognostic mutations and comparison of TMB between wild-type and mutant tumors. be Kaplan–Meier survival curves using the genetic variants to stratify the patient cohort (n = 14). fi TMB comparisons between the mutant and wild-type tumors for the four identified genes (n = 14). j TMB comparisons between the high- and low-HLA-A expression groups (n = 14). k TMB comparisons between MGMT promoter unmethylated (n = 7), methylated (n = 5), and not detected (n = 2) groups. All p-values were calculated using the Mann–Whitney U-test

References

    1. Ostrom QT, Gittleman H, Liao P, et al. CBTRUS statistical report: primary brain and other central nervous system tumors diagnosed in the United States in 2010–2014. Neuro Oncol. 2017;19:v1–v88. doi: 10.1093/neuonc/nox158. - DOI - PMC - PubMed
    1. Stupp R, Mason WP, van den Bent MJ, et al. Radiotherapy plus concomitant and adjuvant temozolomide for glioblastoma. N Engl J Med. 2005;352:987–996. doi: 10.1056/NEJMoa043330. - DOI - PubMed
    1. Yang K, Wu Z, Zhang H, et al. Glioma targeted therapy: insight into future of molecular approaches. Mol Cancer. 2022;21:39. doi: 10.1186/s12943-022-01513-z. - DOI - PMC - PubMed
    1. Liau LM, Ashkan K, Brem S, et al. Association of autologous tumor lysate-loaded dendritic cell vaccination with extension of survival among patients with newly diagnosed and recurrent glioblastoma: a phase 3 prospective externally controlled cohort trial. JAMA Oncol. 2023;9:112–121. doi: 10.1001/jamaoncol.2022.5370. - DOI - PMC - PubMed
    1. Steinman RM, Nussenzweig MC. Dendritic cells: features and functions. Immunol Rev. 1980;53:127–147. doi: 10.1111/j.1600-065x.1980.tb01042.x. - DOI - PubMed