. 2023 Sep 4;220(9):e20221939.
doi: 10.1084/jem.20221939. Epub 2023 Jun 29.

Promiscuous recognition of MR1 drives self-reactive mucosal-associated invariant T cell responses

Affiliations

Promiscuous recognition of MR1 drives self-reactive mucosal-associated invariant T cell responses

Andrew Chancellor et al. J Exp Med. .

Abstract

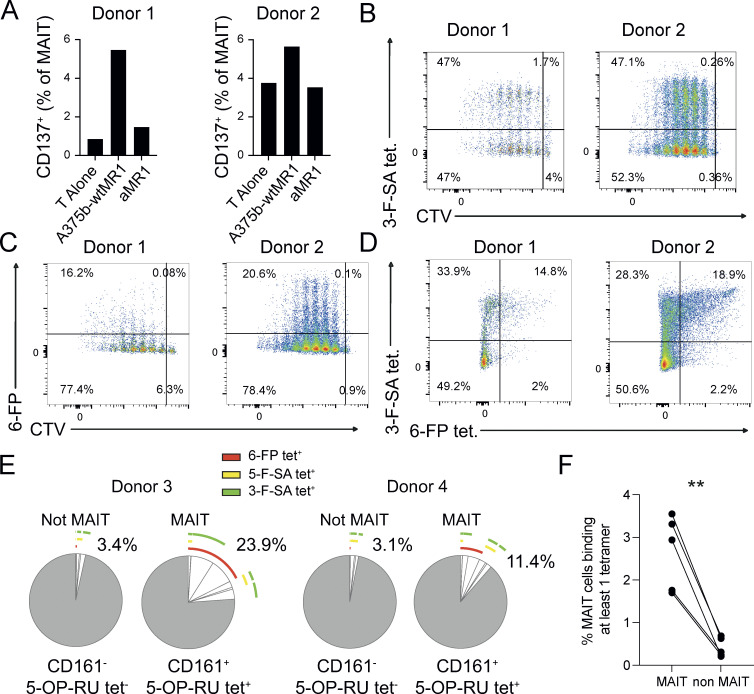
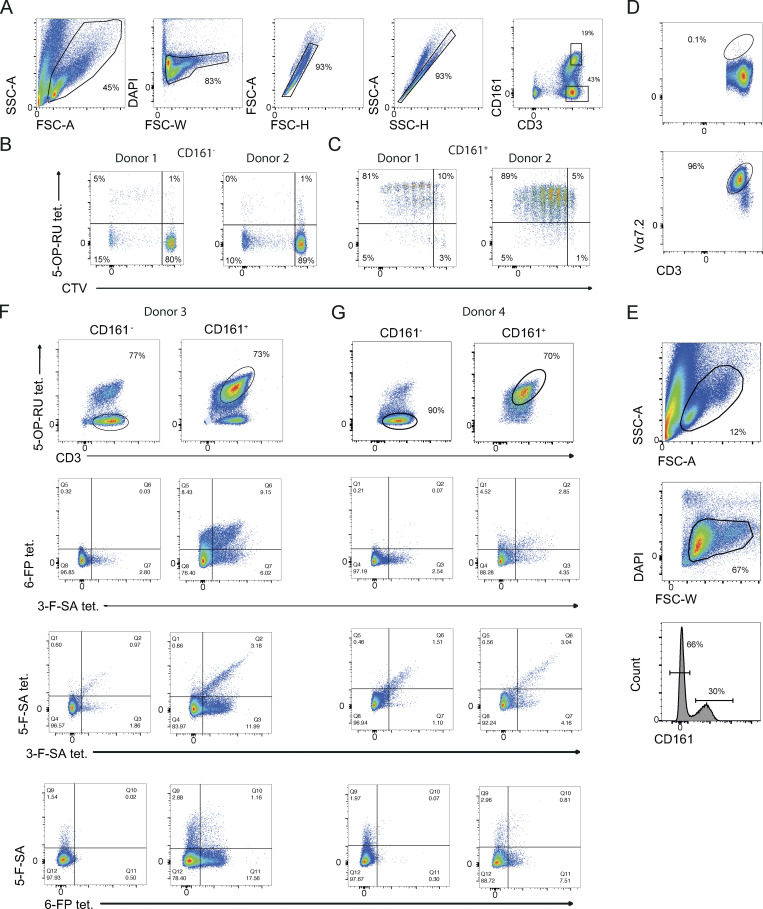
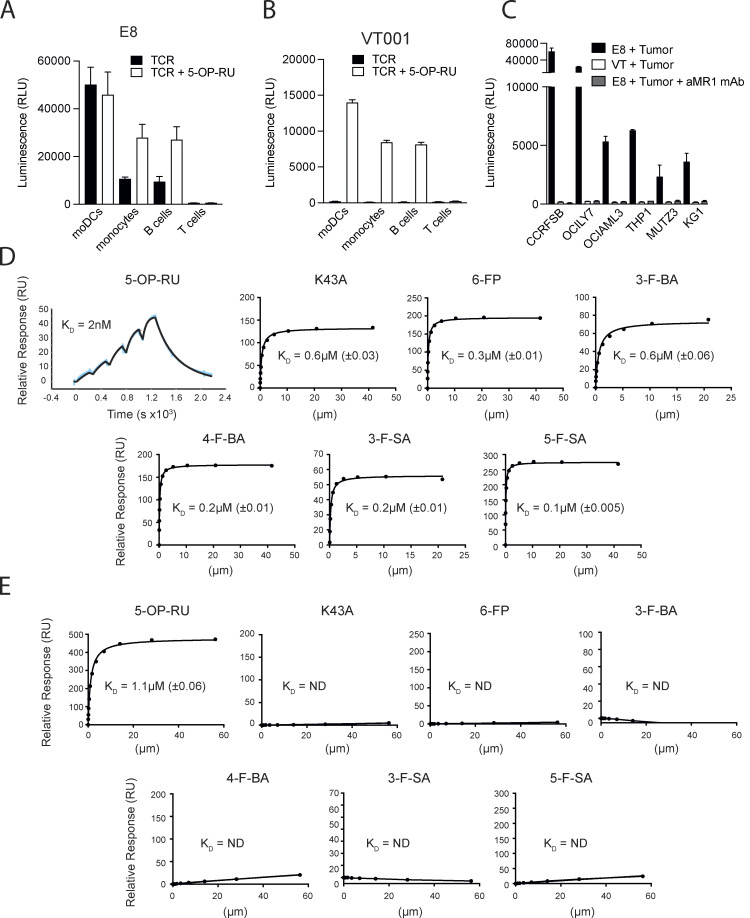
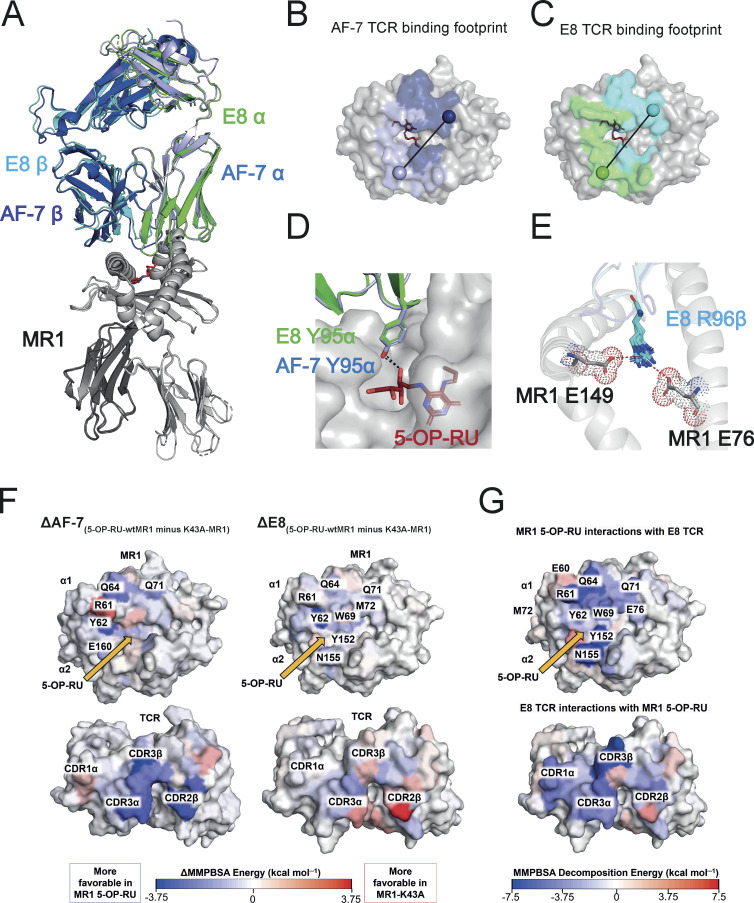
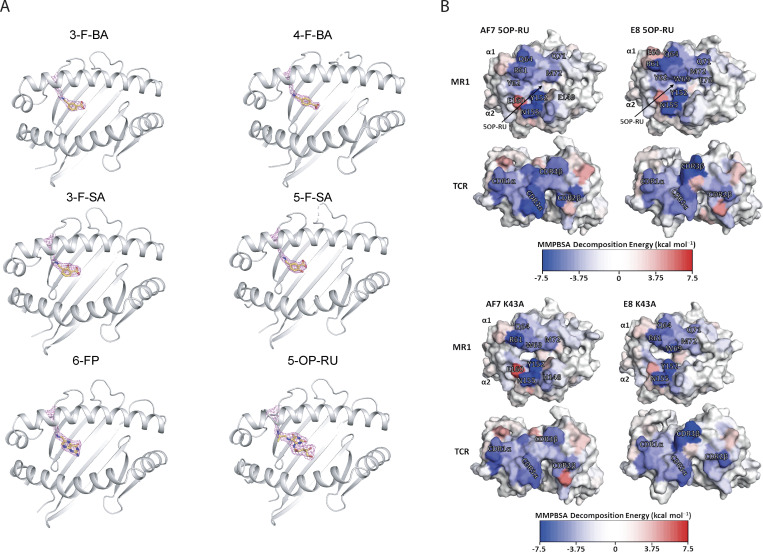
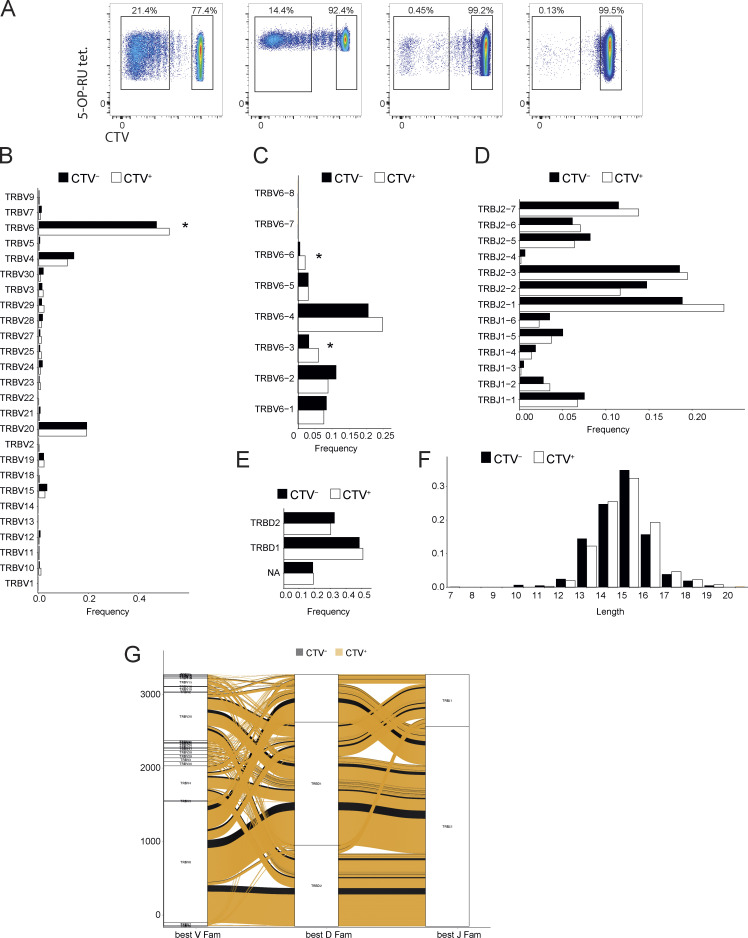
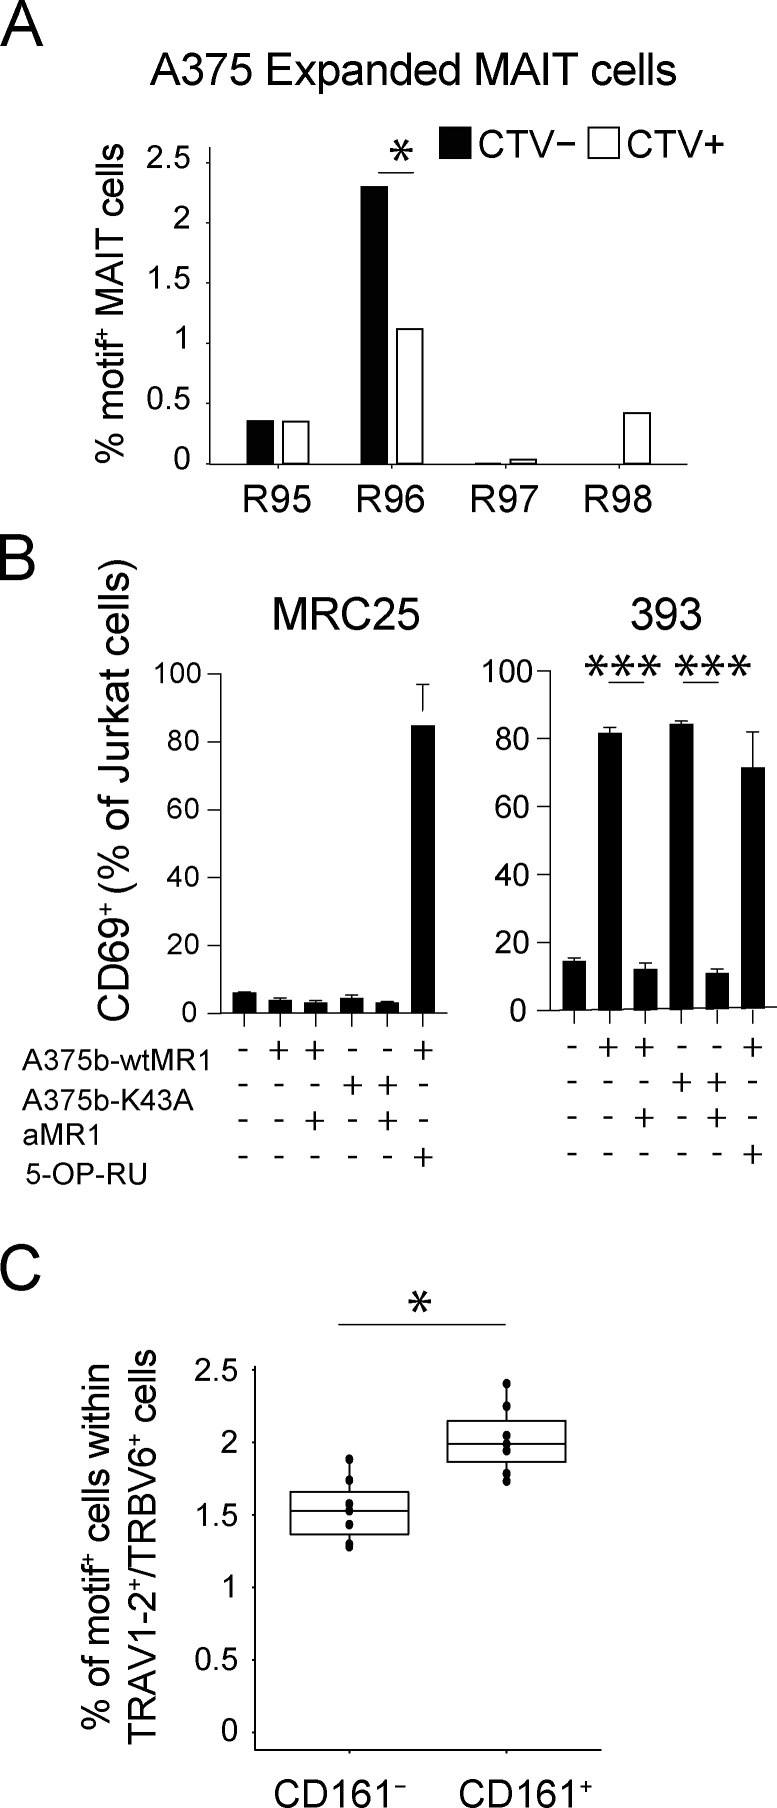
Mucosal-associated invariant T (MAIT) cells use canonical semi-invariant T cell receptors (TCR) to recognize microbial riboflavin precursors displayed by the antigen-presenting molecule MR1. The extent of MAIT TCR crossreactivity toward physiological, microbially unrelated antigens remains underexplored. We describe MAIT TCRs endowed with MR1-dependent reactivity to tumor and healthy cells in the absence of microbial metabolites. MAIT cells bearing TCRs crossreactive toward self are rare but commonly found within healthy donors and display T-helper-like functions in vitro. Experiments with MR1-tetramers loaded with distinct ligands revealed significant crossreactivity among MAIT TCRs both ex vivo and upon in vitro expansion. A canonical MAIT TCR was selected on the basis of extremely promiscuous MR1 recognition. Structural and molecular dynamic analyses associated promiscuity to unique TCRβ-chain features that were enriched within self-reactive MAIT cells of healthy individuals. Thus, self-reactive recognition of MR1 represents a functionally relevant indication of MAIT TCR crossreactivity, suggesting a potentially broader role of MAIT cells in immune homeostasis and diseases, beyond microbial immunosurveillance.


Conflict of interest statement

Disclosures: R. Simmons, V. Karuppiah, R. Suckling, M. Hock, and M. Lepore reported personal fees from Immunocore Ltd. during the conduct of the study and personal fees from Immunocore Ltd. outside the submitted work. No other disclosures were reported.

Figures

Figure S1.
Figure S1.
Reactivity and function of self-reactive MAIT cell lines. (A) Expression of MR1 on cell lines used in this study. In the condition with 5-OP-RU, a 6-h incubation time was used. (B) Activation of self-reactive MAIT cells after proliferation with the indicated conditions from six individual donors. (C) Percentage of MR1-5-OP-RU tetramer+ cells within MAIT cells proliferating (CTV dull) and not (CTV bright) after stimulation with A375b-MR1 cells. (D) IFN-γ release by MAIT cells in the cultures illustrated in A (black bars) + aMR1 mAb (white bars). Concentrations are expressed as mean +SD. Data obtained from two donors. (E) Frequency of MAIT cells that secrete combination of the indicated cytokines.
Figure 1.
Figure 1.
Self-reactivity and polyfunctionality of circulating MAIT cells from healthy donors. (A) CD137 expression by autoreactive MAIT cells expanded for 10 d. Proliferating and not proliferating MAIT (top row) or non-MAIT (bottom row) cells following stimulation with the indicated APCs ± anti-MR1 mAb (aMR1). MAIT cells (Vα7.2+/CD161+) proliferative status is revealed by CTV emission. Plots are representative of results obtained with six donors. (B) Summary of MAIT cell CD137 expression on proliferating cells (CTV dull) after rechallenge with the indicated condition (numbers as in panel A). Data were obtained from six donors. Statistical significance was determined using a one-way ANOVA with Friedman test, * P ≤ 0.05. (C) Effect of aMR1 mAb on surface expression of the indicated activation markers on CTV-dull MAIT cells stimulated with 5-OP-RU–pulsed THP-1 cells (top row) or with A375b-wtMR1 cells without exogenous antigens (bottom row). Median fluorescence intensity (MFI) is indicated ± aMR1 mAb. Data obtained from five donors. Statistical significance was determined using Student’s t test, * P ≤ 0.05, ** P ≤ 0.01. (D) Vα7.2 surface expression on MAIT cells stimulated with 5-OP-RU–pulsed THP-1 cells (top row) or with A375b-wtMR1 cells without exogenous antigens (bottom row). MFI is indicated ± aMR1 mAb. Data obtained from five donors. Statistical significance was determined using Student’s t test, * P ≤ 0.05. (E) Percentage of ex vivo MAIT cells from healthy donors double positive for CD137 and CD69 after overnight co-culture with A375b-MR1 cells ± aMR1 mAb. Stimulation with 5-OP-RU was used as positive control with the scale on the right-hand y-axis (green). Cells were pregated as CD3+/CD26+Vα7.2+/CD161+. Data are a summary of all five donors tested. Statistical significance was determined using Student’s t test, * P ≤ 0.05. (F and G) Average frequency of cells expressing one or more of the indicated activation-associated molecules within self-reactive MAIT cell lines stimulated with (F) A375b-wtMR1 cells or (G) 5-OP-RU–loaded THP-1 cells. Pie segments indicate cells positive for any combination of the indicated cytokines or activation markers. Pie arcs indicate the cytokine positivity of each segment. Data is averaged from five donors. Source data are available for this figure: SourceData F1.
Figure 2.
Figure 2.
Self-reactivity and T-helper-like functions of MAIT cell clones. (A) Release of IFN-γ by three MAIT cell clones after coculture with 1 × 10⁵ THP-1 cells and indicated concentrations of the microbial Ag 5-OP-RU. IFN-γ is reported as mean ± SD of triplicate cultures. The data are representative of three independent experiments. (B) Release of IFN-γ by three MAIT cell clones in A in response to A375b-wtMR1 cells ± aMR1 mAb. 5-OP-RU–pulsed THP-1 cells were used as a positive control. IFN-γ release is shown as mean ± SD of triplicate cultures. The data is representative of three independent experiments, *** P ≤ 0.001. (C) Percentage of J.RT3-T3.5 cells expressing surface CD69 after incubation with A375b-wtMR1 cells ± aMR1 mAb. A375b-wtMR1 cells pulsed with 5-OP-RU were used as a positive control. J.RT3-T3.5 cell lines express the TCR of the indicated MAIT cell clones. The data are representative of three independent experiments, *** P ≤ 0.001. (D) Release of IFN-γ by three MAIT cell clones stimulated with moDCs ± 5-OP-RU ± aMR1 mAb or ± Ac-6-FP. moDCs pulsed with 5-OP-RU were used as a positive control. IFN-γ release is mean ± SD of triplicate cultures. The data are representative of three independent experiments, *** P ≤ 0.001. (E) Expression levels of the surface maturation markers CD83, CD86, and CD40 on moDCs after overnight coculture with the BC75B31 (left panels) and BC75B38 (right panels) MAIT cell clones. The data are representative of two independent experiments. Statistical significance in all cases was determined using one-way ANOVA with Dunn multiple comparison test.
Figure S2.
Figure S2.
Self-reactive MAIT cell phenotype. (A) All MAIT cell clones stain brightly with the 5-OP-RU tetramer. (B) Activation of the MAIT clone SMC3 with moDCs plus either anti-MR1 blocking mAbs or Ac-6-FP or 5-OP-RU. Statistical significance was determined using one-way ANOVA with Dunn multiple comparison test. The data are representative of two independent experiments, ** P ≤ 0.01, *** P ≤ 0.001. (C) CD3 MFI of each clone in panel A.
Figure 3.
Figure 3.
Crossreactivity of circulating MAIT cells from healthy donors. (A) Percentage of CD137+ MAIT cells following activation by A375b-MR1 cells ± aMR1 mAb. MAIT cell lines were previously generated from two donors by in vitro expansion with 5-OP-RU. (B) Plots of MAIT cell lines stained with MR1-3-F-SA tetramer vs. CTV. Cells were pregated on CD161+ cells. Data were obtained from a total of two donors. (C) Representative plots of MAIT cell lines stained with MR1-6-FP tetramer vs. CTV. Cells were pre-gated on CD161+ cells. Data was obtained from a total of two donors. (D) Populations of MAIT cells that are double positive for MR1-3-F-SA and MR1-6-FP tetramers in the same two donors (B–D). (E) Frequency of MR1-5-OP-RU, -6-FP, -3-F-SA, or -5-F-SA MR1 tetramer+ cells from two additional MAIT cell lines derived from the peripheral blood of donors 3 and 4. Pie segments indicate cells positive for any combination of the four tetramer sets. Pie arcs indicate the tetramer positivity of each segment. Percentages indicate the total number of cells positive for at least one tetramer. (F) Percentage of ex vivo MAIT cells from healthy donors stained with at least one of three tetramers: CD8-null MR1-3-F-SA, -5-F-SA, or -6-FP. MAIT cells were pregated on live CD3+/Vα7.2+/CD161+/CD26+ cells. Non-MAIT cells were pregated on live CD3+/Vα7.2 cells. Statistical significance was determined using Student’s t test, ** P ≤ 0.01. Source data are available for this figure: SourceData F3.
Figure S3.
Figure S3.
Gating strategies for identifying bona fide MAIT cells. (A) Gating strategy for identifying MAIT (CD161+) and non-MAIT cells (CD161−) after enrichment for TCR Vα7.2+ T cells, linked to Fig. 3, B–D. (B) Example plots of CD161-fraction that does not contain many 5-OP-RU expanded T cells or T cells that bound to the MR1-5-OP-RU tetramer. (C) Example plots showing that CD161 hi cells within the line simultaneously proliferated when stimulated with 5-OP-RU and bound to the MR1-5-OP-RU tetramer. (D) Example of enrichment of MAIT cells with Vα7.2 mAb. Upper panel shows depleted fraction and lower panel shows enriched fraction. (E) Gating strategy for the identification of MAIT and non-MAIT cells displayed in Fig. 3 E. (F and G) Plots showing populations of MAITs or non-MAITs with different combinations of tetramers.
Figure 4.
Figure 4.
Broad self-reactivity and promiscuous recognition of MR1 ligands by the E8 TCR. (A) Recognition of primary immune cells in the absence (black bars) or presence (white bars) of 5-OP-RU by E8 TCR transduced NFAT-Luciferase TCR-null B2M knock-out Jurkat cells. (B) Recognition of primary immune cells in the absence (black bars) or presence (white bars) of 5-OP-RU by VT001 TCR-transduced NFAT-Luciferase TCR-null B2M knock-out Jurkat cells. (C) Recognition of lymphoma cell lines by NFAT-Luciferase TCR-null B2M knock-out Jurkat cells expressing the E8 TCR (black bars), the VT001 TCR (white bars), or the E8 TCR in the presence of blocking aMR1 mAb (gray bars). (A–C) Luminescence measured following NFAT-driven luciferase activity is shown as the cumulative relative luminescence units (RLU) data from three experiments with mean ± SD of duplicate cultures. (D) Binding affinities, as measured by surface plasmon resonance, of the E8 TCR interacting with wildtype MR1 refolded with the indicated range of MR1 ligands, and the empty MR1-K43A mutant. Dissociation constant values (KD) are indicated ± standard error. >150 μM: the measured KD of the TCR MR1 interaction >150 μM and therefore is unlikely to elicit a MAIT cell response. The very high binding affinity of the E8 TCR to MR1 5-OP-RU was measured using the BIAcore8K using single-cycle kinetic analysis. The remaining measurements were performed on a BiacoreT200 and the KDs were calculated using steady-state analysis. (E) Binding affinities, as measured by surface plasmon resonance, of the control AF-7 TCR interacting with wildtype MR1 refolded with the indicated range of MR1 ligands, and MR1-K43A. KD are indicated ± standard error. >150 μM: the measured KD of the TCR MR1 interaction was >150 μM and therefore is unlikely generate a MAIT cell response. Source data are available for this figure: SourceData F4.
Figure 5.
Figure 5.
Structural and energetic basis of promiscuous recognition of MR1 by the E8 TCR. (A) The structures of the E8 TCR (TRAV in green, TRBV in cyan) bound to MR1 loaded (in gray) with 5-OP-RU (shown as red sticks) aligned to the AF-7 TCR (TRAV in light blue and TRBV in dark Blue) bound to MR1 5-OP-RU (PDB 6PUC; Awad et al., 2020). (B) Surface map of the MR1 binding footprint of the AF-7 TCR (α in light blue and β in dark blue) as in Awad et al. (2020). A vector is drawn connecting the disulfide in the α chain variable domain (light blue sphere) to the disulfide in the β chain variable domain (dark blue sphere). (C) Surface map of the MR1 binding footprint of the E8 TCR (α in green and β in cyan). A vector is drawn connecting the disulfide in the α chain variable domain (green sphere) to the disulfide in the β chain variable domain (cyan sphere). (D) The structures of the AF-7 CDR3α Y95 residue light (blue sticks) and E8 CDR3α Y95 residue (green sticks) showing polar interaction (dotted line) with 5-OP-RU (red sticks) bound to MR1 (gray; Awad et al., 2020). (E) Superimposed structures of the CDR3β R96 residue (cyan sticks) in E8 TCRs that form salt bridges to the residues E76 and E149 (gray sticks) in MR1 loaded with ligands (5-OP-RU, 6-FP, 3-F-SA, 5-F-SA, 3-F-BA, and 4-F-BA). (F) Calculated per-residue differences (5-OP-RU-wtMR1 minus K43A-MR1) in the binding free energy for both the AF-7 and E8 TCRs with (5-OP-RU-wtMR1) and without (K43A-MR1) 5-OP-RU bound to MR1. A blue residue is more favorable in the 5-OP-RU form, while a red residue is more favorable in the MR1-K43A form. Yellow arrows indicate the position of 5-OP-RU. (G) Calculated per-residue contributions to the binding free energy for the E8 TCR–MR1 complex with 5-OP-RU bound. The MR1 and TCR molecules are shown as surfaces and color mapped according to their MMPBSA calculated per residue decomposition energies. Color mapping goes from blue (favorable binding) to white (neutral) to red (unfavorable binding) as indicated by the color bar.
Figure S4.
Figure S4.
Crystal structure images. (A) Electron density of ligand pockets in the E8 TCR-MR1 crystal structures. MR1 (gray) K43 residue and the covalently bound ligands are shown in sticks. (B) Calculated per-residue contributions to the binding free energy for both the E8 and AF-7 TCRs in complex with MR1 5-OP-RU and the empty MR1 K43A (and therefore in the absence of 5-OP-RU). The MR1 and TCR molecules are shown as surface and color mapped according to their MMPBSA calculated per-residue decomposition energies. Color mapping goes from blue (favorable binding) to white (neutral) to red (unfavorable binding) as indicated by the color bar. Equivalent plots for both TCR–MR1 complexes with 5-OP-RU bound.
Figure S5.
Figure S5.
Data relating to TCR usage. (A) Sorted 5-OP-RU tetramer+ cell populations that were used for bulk β-chain sequencing. (B) TRBV gene usage of CTV+ or CTV MAIT cells. Statistical significance was determined using Fisher’s exact test, * P ≤ 0.05. (C) TRBV6 gene usage of CTV+ or CTV cells. Statistical significance was determined using Fisher’s exact test, * P ≤ 0.05. (D) TRBJ6 usage of CTV+ or CTV MAIT cells. (E) TRBD gene usage of CTV+ or CTV MAIT cells. (F) Distribution of CDR3 lengths within either CTV+ or CTV populations. (G) Alluvial plot or rearranged TCR genes in either CTV+ or CTV MAIT cells.
Figure 6.
Figure 6.
Enrichment of R96 in self-reactive MAIT cells. (A) Frequencies of TRBV6+, CDR3L13+ MAIT cells with either R95, R96, R97, or R98 motif within either self-reactive, proliferated MAIT cells (CTV−) or non-self-reactive, non-proliferated MAIT cells (CTV+). Statistical significance was determined using Fisher’s exact test, * P ≤ 0.05. (B) Activation of J.RT3-T3.5 cells transduced with 393 TRBV (a MAIT TRBV bearing the E8-like motif) or with the control MRC25 TCRBV gene. Percentage of CD69+ cells after co-culture with the indicated APC ± anti-MR1 mAb is illustrated. 5-OP-RU–pulsed THP-1 cells were used as a positive control. Data are representative of three individual experiments each performed in triplicate. Statistical significance was determined using Student’s t test, *** P ≤ 0.001. (C) Frequency of TRBV sequences with the E8-like motif within ex vivo MAIT cells (TRAV1-2+/TRBV6+, and CD161+) or non-MAIT cells (TRAV1-2+/TRBV6+, and CD161) sorted from the periphery of seven healthy donors (Lepore et al., 2014). Statistical significance was determined using Wilcoxon signed-rank test, * P ≤ 0.05.

Similar articles

Cited by

References

    1. Awad, W., Ler G.J.M., Xu W., Keller A.N., Mak J.Y.W., Lim X.Y., Liu L., Eckle S.B.G., Le Nours J., McCluskey J., et al. . 2020. The molecular basis underpinning the potency and specificity of MAIT cell antigens. Nat. Immunol. 21:400–411. 10.1038/s41590-020-0616-6 - DOI - PubMed
    1. Bagchi, S., He Y., Zhang H., Cao L., Van Rhijn I., Moody D.B., Gudjonsson J.E., and Wang C.R.. 2017. CD1b-autoreactive T cells contribute to hyperlipidemia-induced skin inflammation in mice. J. Clin. Invest. 127:2339–2352. 10.1172/JCI92217 - DOI - PMC - PubMed
    1. Bendelac, A., Lantz O., Quimby M.E., Yewdell J.W., Bennink J.R., and Brutkiewicz R.R.. 1995. CD1 recognition by mouse NK1+ T lymphocytes. Science. 268:863–865. 10.1126/science.7538697 - DOI - PubMed
    1. Bolotin, D.A., Poslavsky S., Mitrophanov I., Shugay M., Mamedov I.Z., Putintseva E.V., and Chudakov D.M.. 2015. MiXCR: Software for comprehensive adaptive immunity profiling. Nat. Methods. 12:380–381. 10.1038/nmeth.3364 - DOI - PubMed
    1. Boulter, J.M., Glick M., Todorov P.T., Baston E., Sami M., Rizkallah P., and Jakobsen B.K.. 2003. Stable, soluble T-cell receptor molecules for crystallization and therapeutics. Protein Eng. 16:707–711. 10.1093/protein/gzg087 - DOI - PubMed

Publication types

Substances