Review
. 2023 Oct 1;103(4):2679-2757.
doi: 10.1152/physrev.00039.2022. Epub 2023 Jun 29.

Mechanisms of mechanical overload-induced skeletal muscle hypertrophy: current understanding and future directions

Affiliations
Review

Mechanisms of mechanical overload-induced skeletal muscle hypertrophy: current understanding and future directions

Michael D Roberts et al. Physiol Rev. .

Abstract

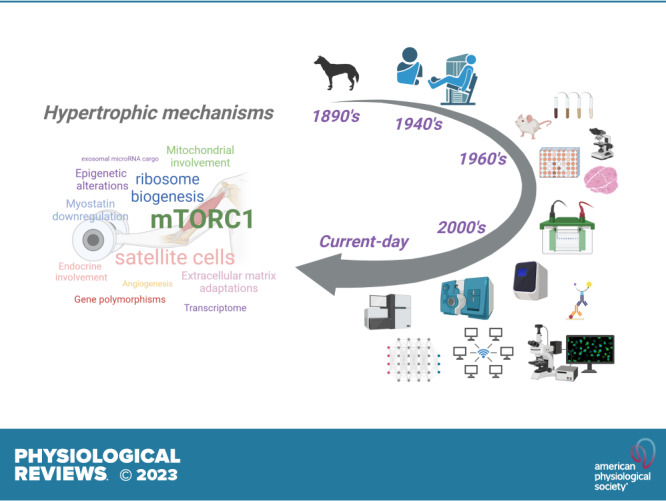
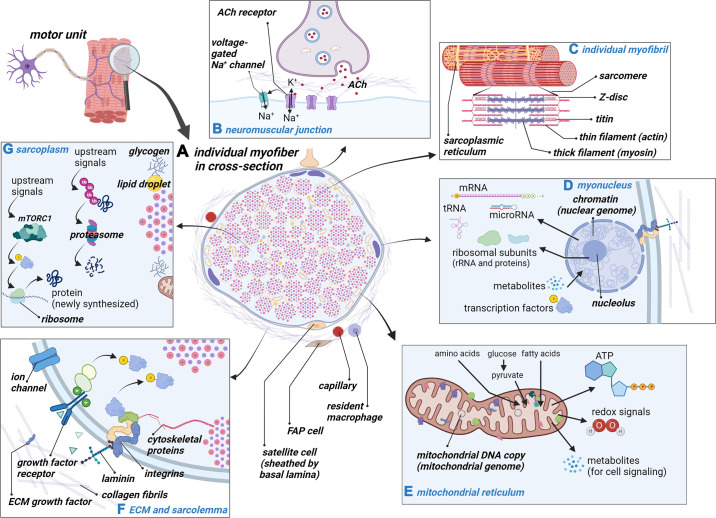
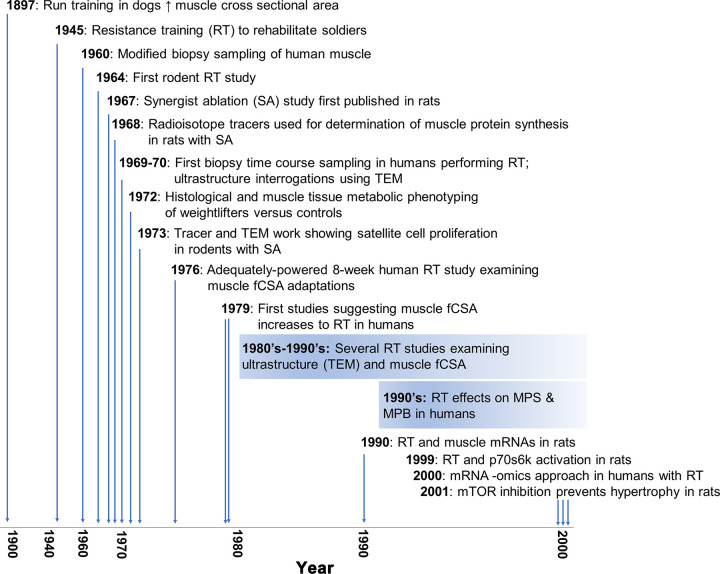
Mechanisms underlying mechanical overload-induced skeletal muscle hypertrophy have been extensively researched since the landmark report by Morpurgo (1897) of "work-induced hypertrophy" in dogs that were treadmill trained. Much of the preclinical rodent and human resistance training research to date supports that involved mechanisms include enhanced mammalian/mechanistic target of rapamycin complex 1 (mTORC1) signaling, an expansion in translational capacity through ribosome biogenesis, increased satellite cell abundance and myonuclear accretion, and postexercise elevations in muscle protein synthesis rates. However, several lines of past and emerging evidence suggest that additional mechanisms that feed into or are independent of these processes are also involved. This review first provides a historical account of how mechanistic research into skeletal muscle hypertrophy has progressed. A comprehensive list of mechanisms associated with skeletal muscle hypertrophy is then outlined, and areas of disagreement involving these mechanisms are presented. Finally, future research directions involving many of the discussed mechanisms are proposed.

Keywords: hypertrophy; mechanical overload; myofiber; resistance training; skeletal muscle.


Conflict of interest statement

M.D.R. has received funding in the form of contracts, gifts, and grants from industry sources, Auburn University (Intramural Grants Program), and the Peanut Institute (commodities) for work in certain areas discussed in this article. S.M.P. has patent (Canadian) 3052324 assigned to Exerkine and patent (US) 20200230197 pending to Exerkine but reports no financial gains from any patent or related work. None of the other authors has any conflicts of interest, financial or otherwise, to disclose.

Figures

None
Graphical abstract
FIGURE 1.
FIGURE 1.
Skeletal muscle fiber components and biological processes. This schematic (constructed with BioRender.com, with permission) illustrates the molecular attributes and processes that occur in a myofiber. A represents an individual myofiber in cross section as well as some of the stromal cells that exist in the extracellular matrix. B depicts the neuromuscular junction and how the ligand binding of acetylcholine (ACh) can lead to myofiber activation through voltage-gated sodium (Na+) channels. C shows an individual myofibril and some of the prominent proteins that make up the structure of the sarcomere. D shows a single myonucleus, some of its key structures (e.g., chromatin), and some of its functions (e.g., RNA transcription and output). E depicts a portion of the mitochondrial reticulum, some of its key structures (e.g., mitochondrial DNA), and some of its key functions (e.g., producing ATP and metabolites). F shows the interface of the extracellular matrix (ECM) and muscle cell membrane (or sarcolemma), and signaling through growth factor receptors and laminin-integrin complexes are also summarized. G shows a portion of the sarcoplasm (which makes up <10% of the myofiber spatially), some of the features between myofibrils (e.g., glycogen granules and lipid droplets), and some of the many reactions that can occur in this region (note that protein synthesis can also occur at ribosomes localized in close proximity to myofibrils). FAP, fibro-adipogenic progenitor cell; K+, potassium; mTORC1, mammalian target of rapamycin complex 1.
FIGURE 2.
FIGURE 2.
An overview of landmark studies. A timeline of landmark studies investigating skeletal muscle adaptations to mechanical overload in rodents and subsequent resistance training studies in humans. fCSA, myofiber cross-sectional area; MPB, muscle protein breakdown; MPS, muscle protein synthesis; mTOR, mammalian/mechanistic target of rapamycin; p70S6K, 70-kDa S6 protein kinase; TEM, transmission electron microscopy.
FIGURE 3.
FIGURE 3.
General muscle tissue processing steps for histology and molecular analyses. Muscle tissue procurement from human and animal studies involves either a biopsy (humans) or dissections (rodents; not pictured). It is advised that the removal of visible blood, fat, and connective tissue, tissue triage, and liquid nitrogen (LN2) tissue preservation occur as rapidly as possible (e.g., between 1 and 3 min). Noted in the diagram are different preservation methods when sampling tissue for histology vs. nucleic acid or protein work. Researchers are advised to consult with published literature based on the assays desired to be performed to ensure that tissues are placed in adequate buffers (if needed) before cold storage and/or LN2 freezing and deep freeze storage. Upon tissue removal from deep freeze storage, care should be taken in most circumstances to ensure that the tissue is kept in a frozen state. As illustrated in the schematic, tissue processing for nucleic acid and protein work involves keeping tissue on dry ice, LN2-cooled stages, and/or ice throughout several of the processing steps to prevent macromolecule degradation. Tissue processing for immunohistochemistry or histology on nonfixed tissue typically involves sectioning in a cryostat at approximately −20°C. Again, researchers are encouraged to consult with published literature to obtain the desired conditions based on the assay(s) desired to be performed. This schematic was constructed with BioRender.com, with permission.
FIGURE 4.
FIGURE 4.
Advantages, limitations, and shared strengths of rodent and human studies. This figure (created with BioRender.com, with permission) summarizes the advantages and limitations of using rodent models. Additionally, limitations of human studies are presented. Finally, shared strengths of both models are displayed in the overlap region of the Venn diagram. AAV, adeno-associated virus; EU, 5-ethynyluridine; IHC, immunohistochemistry.
FIGURE 5.
FIGURE 5.
Signals associated with mechanical overload posited to upregulate mammalian/mechanistic target of rapamycin complex 1 (mTORC1) activity in skeletal muscle. This schematic (constructed with BioRender.com, with permission) provides an overview of content discussed in the review related to signals associated with mechanical overload that have been posited to upregulate mTORC1 activity in skeletal muscle. Notably, 1 of these signals [insulin-like growth factor 1 (IGF1)] operates through canonical ligand-receptor binding, whereas the other 3 signals are thought to operate through mechanotransduction. Single or multiple solid arrows indicate the pathway (or a portion of the pathway) has been relatively well defined and/or extensively investigated. Dashed arrows indicate that not much is known about how the upstream signal operates in skeletal muscle during periods of mechanical overload. DAG, diacylglycerol; FAK, focal adhesion kinase; PA, phosphatidic acid.
FIGURE 6.
FIGURE 6.
Timeline of ribosome biogenesis during load-induced skeletal muscle hypertrophy. This schematic (constructed with Biorender.com, with permission) provides a general timeline of ribosome biogenesis during periods of mechanical overload. Importantly, researchers have shown that ribosome biogenesis precedes skeletal muscle (and myofiber) hypertrophy, and this can result in increases in both ribosome content as well as ribosome concentrations. However, ribosome concentrations renormalize after longer-term training periods where myofiber hypertrophy is evident.
FIGURE 7.
FIGURE 7.
Summary of the fusion and nonfusion roles of satellite cells. This schematic (constructed with BioRender.com, with permission) provides a general overview of how satellite cells can respond to mechanical overload. The fusion role has been well defined, and this involves satellite cell proliferation (acute response) followed by the fusion of a subpopulation of satellite cells to increase myonuclear number. The nonfusion role involves satellite cells secreting exosomes containing microRNA (and presumably other cargo). Exosomes can transport this cargo to myofiber and nonmyofiber cell types in the interstitial space to regulate gene expression. In the example pictured, satellite cells are regulating gene expression in myofibers and fibrogenic cells, and this may affect extracellular matrix remodeling during myofiber hypertrophy (as discussed in main text). Satellite cells are likely to communicate with other cell types, and this is also illustrated via cell-cell communication with vascular endothelial cells. ECM, extracellular matrix.
FIGURE 8.
FIGURE 8.
Past research and future directions regarding the delineation of gene polymorphisms associated with hypertrophic outcomes. This schematic (constructed with BioRender.com, with permission) provides a summary of past efforts examining genetic polymorphisms associated with the skeletal muscle hypertrophic response to resistance training in humans. As mentioned in main text, future methods using deep DNA sequencing and bioinformatics are needed to garner additional information in this area. FAMuSS, Functional Single Nucleotide Polymorphisms Associated with Human Muscle Size and Strength; RT, resistance training; SNP, single-nucleotide polymorphism.
FIGURE 9.
FIGURE 9.
Skeletal muscle genome-wide DNA methylation and transcriptome responses to a bout of resistance exercise. This schematic (constructed with BioRender.com, with permission) summarizes recent data [Sexton et al. 2023 (573)] demonstrating alterations in skeletal muscle tissue DNA methylation status after a bout of resistance exercise in humans. The researchers concluded that 1) alterations in DNA methylation statuses occur very rapidly (i.e., 3 h vs. 6 h after exercise); 2) contrary to past hypotheses suggesting that exercise generally elicits a reduction in DNA methylation, more hypermethylation events occurred 3 h after exercise relative to hypomethylation events; and 3) alterations in DNA methylation patterns likely precede and are, in part, responsible for altered mRNA expression patterns. HIF, hypoxia-inducible factor; PI3K, phosphatidylinositol 3-kinase.
FIGURE 10.
FIGURE 10.
Summary of myostatin signaling and how mechanical overload affects signaling outcomes. This schematic (constructed with BioRender.com, with permission) provides a summary of myostatin (MSTN) signaling in skeletal muscle and how mechanical overload in rodents or humans affects signaling outcomes based on the research cited in-text. Upon ligand binding, MSTN leads to the phosphorylation of SMAD2/3, which causes the formation of the SMAD2/3/4 complex. This complex can then enter nuclei and affect the expression of genes that negatively impact muscle size and growth (i.e., genomic effects). A putative nongenomic effect of MSTN signaling includes the inhibition of AKT phosphorylation, and this can lead to diminished protein synthesis rates. Notably, blue arrows and inhibitor indicators illustrate how resistance exercise affects aspects of MSTN signaling. As discussed in main text, acute and/or chronic resistance training has been documented to upregulate myostatin inhibitors (follistatin and FSTL3), reduce SMAD2/3/4 nuclear translocation through JNK1/2 activation, and reduce MSTN mRNA levels through decreasing transcription rates.

References

    1. Jorgenson KW, Phillips SM, Hornberger TA. Identifying the structural adaptations that drive the mechanical load-induced growth of skeletal muscle: a scoping review. Cells 9: 1658, 2020. doi: 10.3390/cells9071658. - DOI - PMC - PubMed
    1. Attwaters M, Hughes SM. Cellular and molecular pathways controlling muscle size in response to exercise. FEBS J 289: 1428–1456, 2022. doi: 10.1111/febs.15820. - DOI - PubMed
    1. Bamman MM, Roberts BM, Adams GR. Molecular regulation of exercise-induced muscle fiber hypertrophy. Cold Spring Harb Perspect Med 8: a029751, 2018. doi: 10.1101/cshperspect.a029751. - DOI - PMC - PubMed
    1. Wackerhage H, Schoenfeld BJ, Hamilton DL, Lehti M, Hulmi JJ. Stimuli and sensors that initiate skeletal muscle hypertrophy following resistance exercise. J Appl Physiol (1985) 126: 30–43, 2019. doi: 10.1152/japplphysiol.00685.2018. - DOI - PubMed
    1. Brook MS, Wilkinson DJ, Smith K, Atherton PJ. It’s not just about protein turnover: the role of ribosomal biogenesis and satellite cells in the regulation of skeletal muscle hypertrophy. Eur J Sport Sci 19: 952–963, 2019. doi: 10.1080/17461391.2019.1569726. - DOI - PubMed

Publication types

Substances

LinkOut - more resources