Turtle body size evolution is determined by lineage-specific specializations rather than global trends
- PMID: 37384241
- PMCID: PMC10293707
- DOI: 10.1002/ece3.10201
Turtle body size evolution is determined by lineage-specific specializations rather than global trends
Abstract
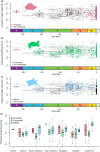
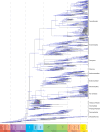
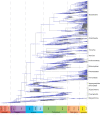
Organisms display a considerable variety of body sizes and shapes, and macroevolutionary investigations help to understand the evolutionary dynamics behind such variations. Turtles (Testudinata) show great body size disparity, especially when their rich fossil record is accounted for. We explored body size evolution in turtles, testing which factors might influence the observed patterns and evaluating the existence of long-term directional trends. We constructed the most comprehensive body size dataset for the group to date, tested for correlation with paleotemperature, estimated ancestral body sizes, and performed macroevolutionary model-fitting analyses. We found no evidence for directional body size evolution, even when using very flexible models, thereby rejecting the occurrence of Cope's rule. We also found no significant effect of paleotemperature on overall through-time body size patterns. In contrast, we found a significant influence of habitat preference on turtle body size. Freshwater turtles display a rather homogeneous body size distribution through time. In contrast, terrestrial and marine turtles show more pronounced variation, with terrestrial forms being restricted to larger body sizes, up to the origin of testudinids in the Cenozoic, and marine turtles undergoing a reduction in body size disparity after the extinctions of many groups in the mid-Cenozoic. Our results, therefore, suggest that long-term, generalized patterns are probably explained by factors specific to certain groups and related at least partly to habitat use.
Keywords: Cope's rule; Testudinata; ancestral states estimation; evolutionary models.
© 2023 The Authors. Ecology and Evolution published by John Wiley & Sons Ltd.
Conflict of interest statement
The authors have no conflicts of interest to declare.
Figures


Similar articles
-
The multi-peak adaptive landscape of crocodylomorph body size evolution.BMC Evol Biol. 2019 Aug 7;19(1):167. doi: 10.1186/s12862-019-1466-4. BMC Evol Biol. 2019. PMID: 31390981 Free PMC article.
-
Cope's rule in cryptodiran turtles: do the body sizes of extant species reflect a trend of phyletic size increase?J Evol Biol. 2006 Jul;19(4):1210-21. doi: 10.1111/j.1420-9101.2006.01082.x. J Evol Biol. 2006. PMID: 16780522
-
Body size evolution in extant Oryzomyini rodents: Cope's rule or miniaturization?PLoS One. 2012;7(4):e34654. doi: 10.1371/journal.pone.0034654. Epub 2012 Apr 3. PLoS One. 2012. PMID: 22509339 Free PMC article.
-
Salinity tolerances and use of saline environments by freshwater turtles: implications of sea level rise.Biol Rev Camb Philos Soc. 2018 Aug;93(3):1634-1648. doi: 10.1111/brv.12410. Epub 2018 Mar 25. Biol Rev Camb Philos Soc. 2018. PMID: 29575680 Review.
-
Evolutionary developmental perspective for the origin of turtles: the folding theory for the shell based on the developmental nature of the carapacial ridge.Evol Dev. 2011 Jan-Feb;13(1):1-14. doi: 10.1111/j.1525-142X.2010.00451.x. Evol Dev. 2011. PMID: 21210938 Review.
Cited by
-
Shell biomechanics suggests an aquatic palaeoecology at the dawn of turtle evolution.Sci Rep. 2024 Sep 18;14(1):21822. doi: 10.1038/s41598-024-72540-7. Sci Rep. 2024. PMID: 39294199 Free PMC article.
-
Cranial and mandibular anatomy of Plastomenus thomasii and a new time-tree of trionychid evolution.Swiss J Palaeontol. 2023;142(1):1. doi: 10.1186/s13358-023-00267-5. Epub 2023 Mar 16. Swiss J Palaeontol. 2023. PMID: 36941994 Free PMC article.
-
New insights into the early morphological evolution of sea turtles by re-investigation of Nichollsemys baieri, a three-dimensionally preserved fossil stem chelonioid from the Campanian of Alberta, Canada.Swiss J Palaeontol. 2024;143(1):27. doi: 10.1186/s13358-024-00323-8. Epub 2024 Jul 12. Swiss J Palaeontol. 2024. PMID: 39006951 Free PMC article.
-
Shell Constraints on Evolutionary Body Size-Limb Size Allometry Can Explain Morphological Conservatism in the Turtle Body Plan.Ecol Evol. 2024 Nov 12;14(11):e70504. doi: 10.1002/ece3.70504. eCollection 2024 Nov. Ecol Evol. 2024. PMID: 39539674 Free PMC article.
-
The complete mitogenome of Amazonian Brachyplatystoma filamentosum and the evolutionary history of body size in the order Siluriformes.Sci Rep. 2025 Mar 21;15(1):9873. doi: 10.1038/s41598-025-94272-y. Sci Rep. 2025. PMID: 40119108 Free PMC article.
References
-
- Akaike, H. (1974). A new look at the statistical model identification. IEEE Transactions on Automatic Control, 19(6), 716–723. 10.1109/TAC.1974.1100705 - DOI
LinkOut - more resources
Full Text Sources

