. 2023 Jun 13:11:1169962.
doi: 10.3389/fcell.2023.1169962. eCollection 2023.

Loss of TDP-43 causes ectopic endothelial sprouting and migration defects through increased fibronectin, vcam 1 and integrin α4/β1

Affiliations

Loss of TDP-43 causes ectopic endothelial sprouting and migration defects through increased fibronectin, vcam 1 and integrin α4/β1

Katrin Hipke et al. Front Cell Dev Biol. .

Abstract

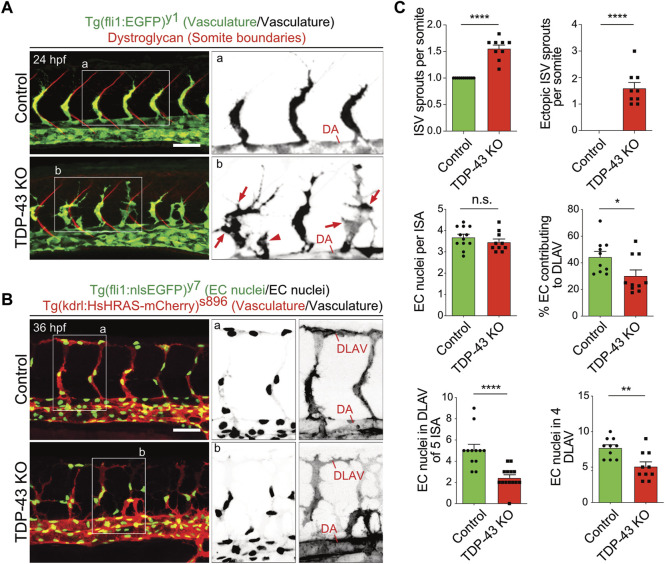
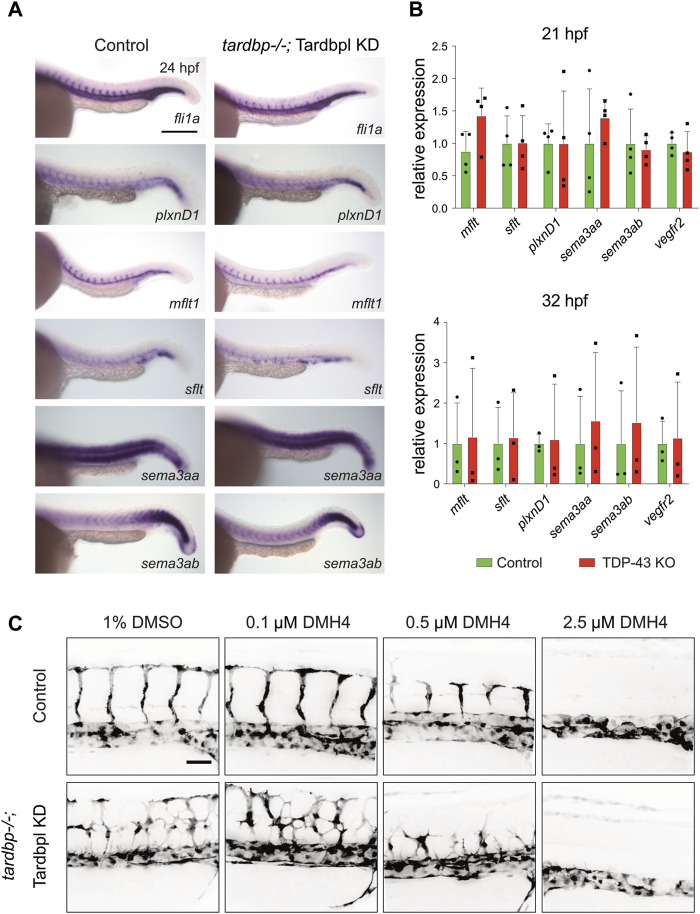
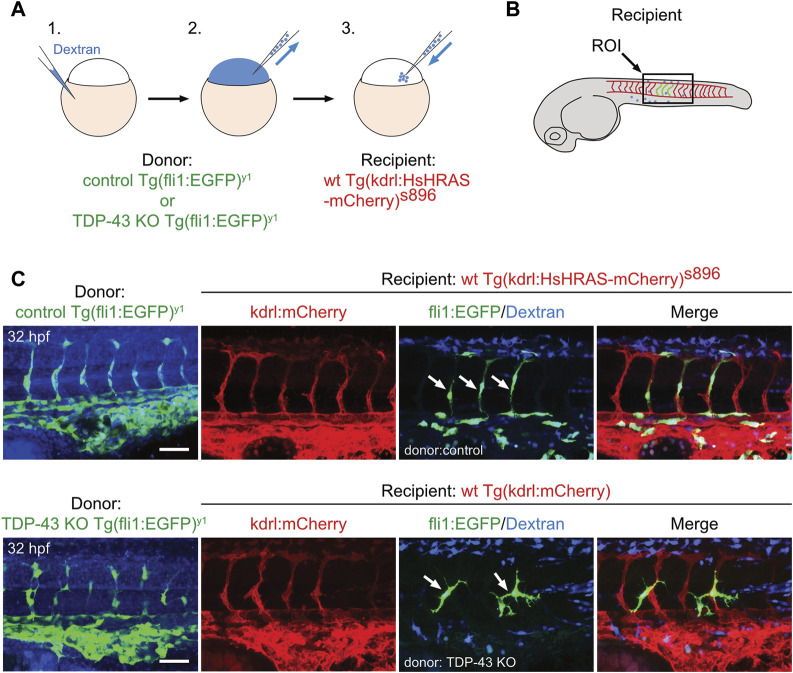
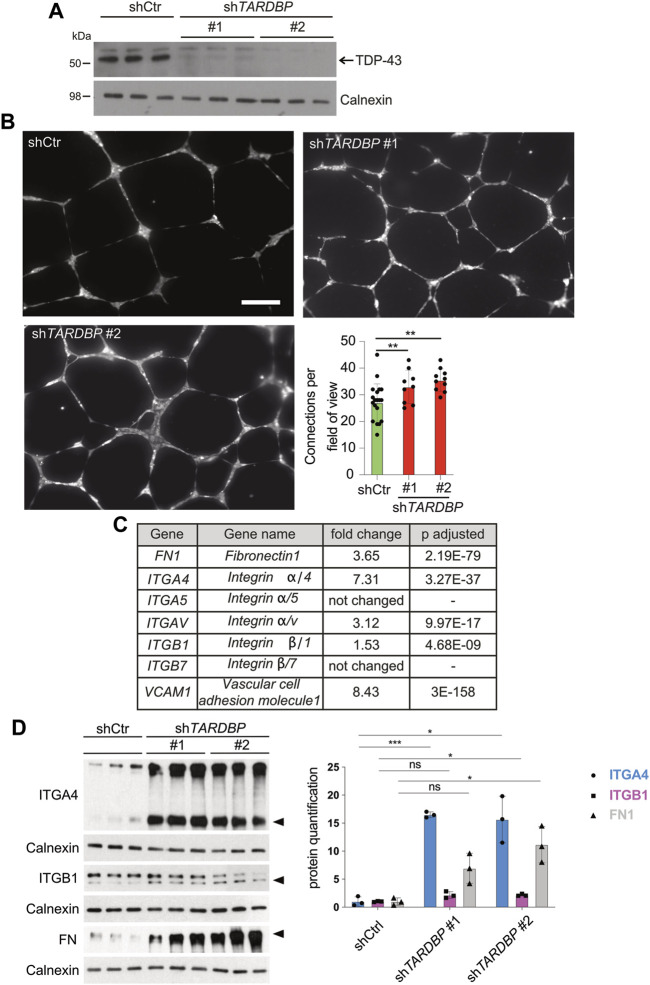
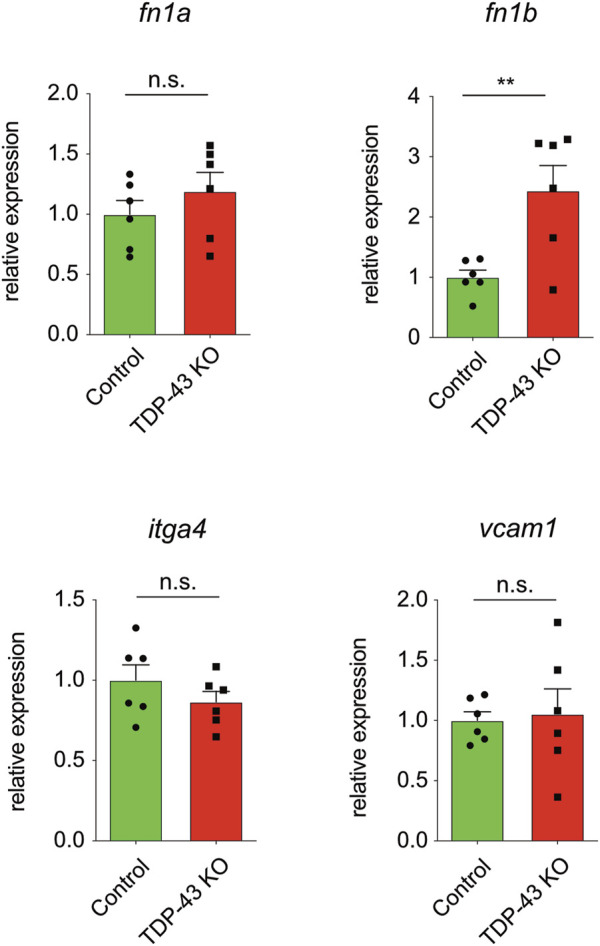
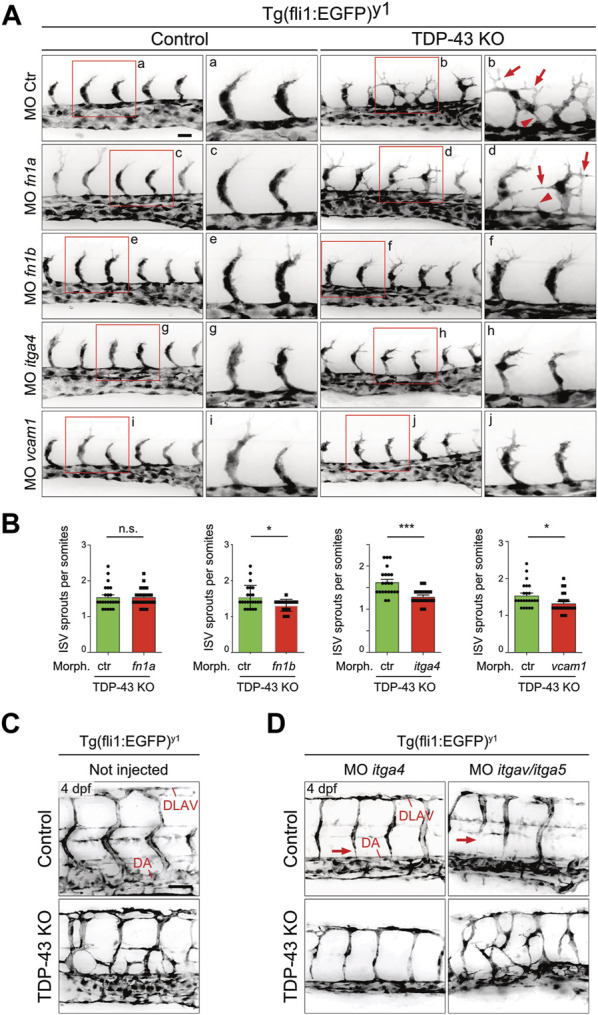
Aggregation of the Tar DNA-binding protein of 43 kDa (TDP-43) is a pathological hallmark of amyotrophic lateral sclerosis and frontotemporal dementia and likely contributes to disease by loss of nuclear function. Analysis of TDP-43 function in knockout zebrafish identified an endothelial directional migration and hypersprouting phenotype during development prior lethality. In human umbilical vein cells (HUVEC) the loss of TDP-43 leads to hyperbranching. We identified elevated expression of FIBRONECTIN 1 (FN1), the VASCULAR CELL ADHESION MOLECULE 1 (VCAM1), as well as their receptor INTEGRIN α4β1 (ITGA4B1) in HUVEC cells. Importantly, reducing the levels of ITGA4, FN1, and VCAM1 homologues in the TDP-43 loss-of-function zebrafish rescues the angiogenic defects indicating the conservation of human and zebrafish TDP-43 function during angiogenesis. Our study identifies a novel pathway regulated by TDP-43 important for angiogenesis during development.

Keywords: ALS; TDP-43; angiogenesis; neurodegeneration; zebrafish.


Conflict of interest statement

The authors declare that the research was conducted in the absence of any commercial or financial relationships that could be construed as a potential conflict of interest.

Figures

FIGURE 1
FIGURE 1
Loss of TDP-43 leads to increased vascular sprouting and defective migration. (A) More and ectopic SA sprouts in zebrafish tardbp−/−; tardbpl−/− mutants. Immunofluorescence of a sibling and a tardbp−/−; tardbpl−/− mutant embryo at 24 hpf. The Tg (fli1a:EGFP) y1 highlights the vasculature in green, the somite boundaries are stained in red. Scale bar 50 μm, anterior to the left. The insets a and b highlight the vasculature only. DA = dorsal aorta (B) Impaired directed migration in tardbp−/−; tardbpl−/− mutants. Less mutant EC nuclei have reached the DLAV at 32 hpf. Embryos are transgenic for Tg (fli1:nlsEGFP) y7 with nuclear EGFP expression (green) and Tg (kdrl:HsHRAS-mCherry) s896, highlighting the vasculature (red). Scale bar 50 μm, anterior to the left. The insets a and b highlight the EC nuclei (left) and the vasculature (right). (C) Quantifications of the vascular defects in the tardbp−/−; tardbpl−/− mutants as indicated. Kruskal–Wallis test and Dunn’s multiple comparison post test, n ≥ 9, sprouts between boundaries of six somites dorsal to the end of the yolk sack extension were quantified. D’Agostino-Pearson omnibus normality test and unpaired t-test, n = 10 for "% EC contributing to DLAV” and “number of EC in DLAV of 4 segments at 2.5 dpf”.
FIGURE 2
FIGURE 2
Selected candidate genes and the VEGF pathway are not affected in TDP-43 KO zebrafish (A) WISH with antisense probes specific for the candidate genes fli1a, plxnD1, sflt1, mflt1, sema3aa, and sema3ab in tardbp−/− ctr MO injected embryos (Control) and their tardbp−/−; Tardbpl KD siblings at 24 hpf (Magnification: ×10 anterior to the left). Depicted are representative images of embryos from one clutch. Experiment was performed with embryos of three independent clutches. (B) Relative mRNA expression of mflt1, sflt1, plxnD1, sema3aa, sema3ab, and kdrl in tardbp−/−; Tardbpl KD embryos compared to their ctr MO injected tardbp−/− siblings (Control) at 21 and 32 hpf. N = 3 (32 hpf) or n = 4 (21 hpf) pools of embryos of independent clutches, unpaired t-test, all p-values >0,5. Results were reproduced three times using the same cDNA. (C) Representative images of ctr MO injected siblings (Control) and tardbp−/−; Tardbpl KD embryos treated with 1% DMSO (solvent) as control or 0.1 μM, 0.5 μM, and 2.5 μM DMH4 inhibitor. Scale bar 50 μm, anterior to the left.
FIGURE 3
FIGURE 3
The tardbp−/−; tardbpl−/− mutant vascular phenotype is cell autonomous. (A) Scheme of the transplantation of control Tg (fli1:EGFP)y1 or TDP-43 KO; Tg (fli1:EGFP)y1 donor EC cells (EC in green, injected tracer label in blue) into Tg (kdrl:HsHRAS-mCherry)s896 hosts (EC in red). (B) The region of interest (ROI) imaged in the transplanted donor larvae is the area dorsal to the end of the yolk sack extension for all images (box). (C) Tg (fli1:EGFP)y1 donor (EC in green, injected tracer label in blue) transplanted into Tg (kdrl:HsHRAS-mCherry)s896 recipients (EC in red) had a wild type morphology. TDP-43 KO; Tg (fli1:EGFP)y1 mutant donor into Tg (kdrl:HsHRAS-mCherry)s896 recipient showed the TDP-43 deficient phenotype (n = 4). Scale bar 50 μm, anterior to the left. Displayed is the area dorsal to the end of the yolk sack extension for all images.
FIGURE 4
FIGURE 4
Increased in vitro angiogenesis upon TDP-43 KD in HUVEC and identification of mis-regulated pathways by NGS. (A) KD of TDP-43 in HUVEC with two different shRNAs, shTARDBP #1 and #2 reduces TDP-43 protein levels. shCtr transduced HUVEC serve as control, each lane represents a biological replicate, Calnexin serves as loading control. (B) Images show tubular network formation of representative fields of view of shCtr, shTARDBP #1, and shTARDBP #2 transduced HUVEC (magnification: ×10). Bar graph displays the quantified connections per field of view in TDP-43 KD with shTARDBP#1 and shTARDBP#2 compared to shCtr. D’Agostino-Pearson omnibus normality test and one-way ANOVA, n ≥ 8 in three independent experiments. (C) Selection of NGS hits of HUVEC upon TDP-43 KD with fold change and adjusted p-value. (D) Immunoblot validation of FN1, ITGA4, and ITGB1 upon KD of TDP-43 with shTARDBP #1 and shTARDBP #2 in comparison to shCtr transduced cells. Each lane represents one biological replicate. The band intensities of the indicated bands (arrowhead) have been quantified using ImageJ, t-test n = 3.
FIGURE 5
FIGURE 5
fn1b is increased in zebrafish. Relative mRNA expression of fn1b, but not fn1a, itgα4, or vcam1 is increased in tardbp−/−; tardbpl−/− mutants compared to their wild type siblings. n = 6 pools of embryos of independent clutches at 24 hpf, unpaired t-test. Results by qPCR were reproduced twice using the same cDNA.
FIGURE 6
FIGURE 6
Mild KD of fn1b, itgα4, or vcam1, but not fn1a rescues increased SA sprouting in tardbp−/−; tardbpl−/− mutants. (A) Mild KD of fn1a, fn1b, itgα4, or vcam1 does not affect SA growth in wild type embryos compared to ctr MO injected siblings. Images showing rescue results with normal SA sprout number in tardbp−/−; tardbpl−/− mutants injected with 0.33 mM fn1b, 0.5 mM itgα4, or 0.75 mM vcam1 MO. Note the morphological difference compared to ctr MO injected tardbp−/−; tardbpl−/− mutants and the similarity to 0.75 mM ctr MO injected wild type sibglings. fn1a KD tardbp−/−; tardbpl−/− mutants (0.75 mM MO) are not rescued. (B) Statistical analysis demonstrating that mild KD of fn1b, itgα4, or vcam1 can statistically significantly rescue increased sprouting of SA from the DA at 24 hpf in tardbp−/−; tardbpl−/− mutants compared to ctr MO injected tardbp−/−; tardbpl−/− mutants. One of three (fn1a, fn1b, itgα4 KD) or two (vcam1 KD) independent experiments with two clutches per experiment are shown, normality test and unpaired t-test, n ≥ 23. (C) Mutant tardbp−/−; tardbpl−/− and control embryos carry the Tg (fli1:EGFP)y1 transgene, SA of the trunk dorsal of the yolk sack extension are shown. (D) Representative image of 1 mM itgα4 MO and itgα5/itgαv MO injected sibling and tardbp−/−; tardbpl−/− mutant embryos (right panel). Note the normal number of SA of the itgα4 MO injected tardbp−/−; tardbpl−/− mutant. Arrows point to SA defects in wild type siblings injected with 0.5 mM itgα5 and 1 mM itgαv MO indicating lack of rescue activity. Scale bar 50 μm, anterior to the left.

Similar articles

Cited by

References

    1. Astrof S., Hynes R. O. (2009). Fibronectins in vascular morphogenesis. Angiogenesis 12, 165–175. 10.1007/s10456-009-9136-6 - DOI - PMC - PubMed
    1. Brown A. L., Wilkins O. G., Keuss M. J., Hill S. E., Zanovello M., Lee W. C., et al. (2022). TDP-43 loss and ALS-risk SNPs drive mis-splicing and depletion of UNC13A. Nature 603, 131–137. 10.1038/s41586-022-04436-3 - DOI - PMC - PubMed
    1. Bussmann J., Bakkers J., Schulte-Merker S. (2007). Early endocardial morphogenesis requires Scl/Tal1. PLoS Genet. 3, e140. 10.1371/journal.pgen.0030140 - DOI - PMC - PubMed
    1. Cannon J. E., Upton P. D., Smith J. C., Morrell N. W. (2010). Intersegmental vessel formation in zebrafish: Requirement for VEGF but not BMP signalling revealed by selective and non-selective BMP antagonists. Br. J. Pharmacol. 161, 140–149. 10.1111/j.1476-5381.2010.00871.x - DOI - PMC - PubMed
    1. Carmeliet P., Tessier-Lavigne M. (2005). Common mechanisms of nerve and blood vessel wiring. Nature 436, 193–200. 10.1038/nature03875 - DOI - PubMed