Osmoprotectants play a major role in the Portulaca oleracea resistance to high levels of salinity stress-insights from a metabolomics and proteomics integrated approach
- PMID: 37384354
- PMCID: PMC10296175
- DOI: 10.3389/fpls.2023.1187803
Osmoprotectants play a major role in the Portulaca oleracea resistance to high levels of salinity stress-insights from a metabolomics and proteomics integrated approach
Abstract
Introduction: Purslane (Portulaca oleracea L.) is a non-conventional food plant used extensively in folk medicine and classified as a multipurpose plant species, serving as a source of features of direct importance to the agricultural and agri-industrial sectors. This species is considered a suitable model to study the mechanisms behind resistance to several abiotic stresses including salinity. The recently achieved technological developments in high-throughput biology opened a new window of opportunity to gain additional insights on purslane resistance to salinity stress-a complex, multigenic, and still not well-understood trait. Only a few reports on single-omics analysis (SOA) of purslane are available, and only one multi-omics integration (MOI) analysis exists so far integrating distinct omics platforms (transcriptomics and metabolomics) to characterize the response of purslane plants to salinity stress.
Methods: The present study is a second step in building a robust database on the morpho-physiological and molecular responses purslane to salinity stress and its subsequent use in attempting to decode the genetics behind its resistance to this abiotic stress. Here, the characterization of the morpho-physiological responses of adult purslane plants to salinity stress and a metabolomics and proteomics integrative approach to study the changes at the molecular level in their leaves and roots is presented.
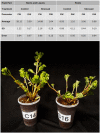
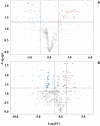
Results and discussion: Adult plants of the B1 purslane accession lost approximately 50% of the fresh and dry weight (from shoots and roots) whensubmitted to very high salinity stress (2.0 g of NaCl/100 g of the substrate). The resistance to very high levels of salinity stress increases as the purslane plant matures, and most of the absorbed sodium remains in the roots, with only a part (~12%) reaching the shoots. Crystal-like structures, constituted mainly by Na+, Cl-, and K+, were found in the leaf veins and intercellular space near the stoma, indicating that this species has a mechanism of salt exclusion operating on the leaves, which has its role in salt tolerance. The MOI approach showed that 41 metabolites were statistically significant on the leaves and 65 metabolites on the roots of adult purslane plants. The combination of the mummichog algorithm and metabolomics database comparison revealed that the glycine, serine, and threonine, amino sugar and nucleotide sugar, and glycolysis/gluconeogenesis pathways were the most significantly enriched pathways when considering the total number of occurrences in the leaves (with 14, 13, and 13, respectively) and roots (all with eight) of adult plants; and that purslane plants employ the adaptive mechanism of osmoprotection to mitigate the negative effect of very high levels of salinity stress; and that this mechanism is prevalent in the leaves. The multi-omics database built by our group underwent a screen for salt-responsive genes, which are now under further characterization for their potential to promote resistance to salinity stress when heterologously overexpressed in salt-sensitive plants.
Keywords: abiotic stress; analytical method; chemometrics; high resolution mass spectrometry; metabolomics; proteomics; purslane; salt tolerance.
Copyright © 2023 Rodrigues Neto, Salgado, Braga, Carvalho da Silva, Belo Silva, Leão, Ribeiro, Abdelnur, Valadares, de Sousa and Souza Júnior.
Conflict of interest statement
Authors JCRN, APL, JAdAR, PVA, LFV, CAFdS and MTSJ were employed by company The Brazilian Agricultural Research Corporation. The remaining authors declare that the research was conducted in the absence of any commercial or financial relationships that could be construed as a potential conflict of interest.
Figures


References
-
- Barker M., Rayens W. (2003). Partial least squares for discrimination. J. Chemometrics 17 (3), 166–173. doi: 10.1002/cem.785 - DOI
-
- Berg J. M., Tymoczko J. L., Stryer L. (2010). Biochemistry. 7th edition (USA: W.H. Freeman and Company; ).
LinkOut - more resources
Full Text Sources

