. 2023 Aug 15;133(16):e167651.
doi: 10.1172/JCI167651.

Cotargeting a MYC/eIF4A-survival axis improves the efficacy of KRAS inhibitors in lung cancer

Affiliations

Cotargeting a MYC/eIF4A-survival axis improves the efficacy of KRAS inhibitors in lung cancer

Francesca Nardi et al. J Clin Invest. .

Abstract

Despite the success of KRAS G12C inhibitors in non-small cell lung cancer (NSCLC), more effective treatments are needed. One preclinical strategy has been to cotarget RAS and mTOR pathways; however, toxicity due to broad mTOR inhibition has limited its utility. Therefore, we sought to develop a more refined means of targeting cap-dependent translation and identifying the most therapeutically important eukaryotic initiation factor 4F complex-translated (eIF4F-translated) targets. Here, we show that an eIF4A inhibitor, which targets a component of eIF4F, dramatically enhances the effects of KRAS G12C inhibitors in NSCLCs and together these agents induce potent tumor regression in vivo. By screening a broad panel of eIF4F targets, we show that this cooperativity is driven by effects on BCL-2 family proteins. Moreover, because multiple BCL-2 family members are concomitantly suppressed, these agents are broadly efficacious in NSCLCs, irrespective of their dependency on MCL1, BCL-xL, or BCL-2, which is known to be heterogeneous. Finally, we show that MYC overexpression confers sensitivity to this combination because it creates a dependency on eIF4A for BCL-2 family protein expression. Together, these studies identify a promising therapeutic strategy for KRAS-mutant NSCLCs, demonstrate that BCL-2 proteins are the key mediators of the therapeutic response in this tumor type, and uncover a predictive biomarker of sensitivity.

Keywords: Drug therapy; Lung cancer; Oncology; Signal transduction.


Conflict of interest statement

Conflict of interest: KC is an advisor at Genentech and serves on the scientific advisory board of Erasca Inc. CPP has received honoraria from Bio-Rad. He is on the scientific advisory board of Dropworks and Xsphera Biosciences Inc. He has sponsored research agreements with Daiichi Sankyo, Bicycle Therapeutics, Transcenta, Bicara Therapeutics, AstraZeneca, Intellia Therapeutics, Janssen Pharmaceuticals, Array Biopharma, Takeda, KSQ Therapeutics, Ideya Biosciences, BOLT Therapeutics, Lilly Pharmaceuticals, Thermo Fisher Scientific, and Bristol Myers Squibb. He receives consulting fees and has ownership stock interests in XSphera Biosciences in XSphera Biosciences. PAJ reports consulting fees from AstraZeneca, Boehringer-Ingelheim, Pfizer, Roche/Genentech, Takeda Oncology, ACEA Biosciences, Eli Lilly and Company, Araxes Pharma, Ignyta, Mirati Therapeutics, Novartis, Loxo Oncology, Daiichi Sankyo, Sanofi Oncology, Voronoi, SFJ Pharmaceuticals, Silicon Therapeutics, Nuvalent, Esai, Bayer, Biocartis, Allorion Therapeutics, Accutar Biotech, and AbbVie; postmarketing royalties from Dana-Farber Cancer Institute–owned intellectual property on EGFR mutations licensed to Lab Corp.; sponsored research agreements with AstraZeneca, Daichi-Sankyo, PUMA, Boehringer Ingelheim, Eli Lilly, Revolution Medicines, and Astellas Pharmaceuticals; and stock ownership in Loxo Oncology and Gatekeeper Pharmaceuticals. ANH has received research support from Amgen, Eli Lilly, Pfizer, BridgeBio, Nuvalent Inc., Roche/Genentech, Blueprint Medicines, Scorpion Therapeutics, Bristol-Myers Squibb, C4 Therapeutics, Novartis, and Relay Therapeutics and served as a compensated consultant for Nuvalent, Tolremo Therapeutics, Engine Biosciences, and TigaTx. DAB is a consultant for N of One/QIAGEN, and Tango Therapeutics; is a founder and shareholder in Xsphera Biosciences; has received honoraria from Merck, H3 Biomedicine/Esai, EMD Serono, Gilead Sciences, Abbvie, and Madalon Consulting; and has received research grants from BMS, Takeda, Novartis, Gilead, and Lilly.

Figures

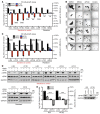
Figure 1
Figure 1. eIF4A inhibitors dramatically sensitize NSCLCs to KRAS G12C inhibitors.
(A) Bar graph depicting the fold change in cell numbers after 72 hours (versus day 0) using a panel of KRAS G12C–mutant NSCLC cells grown in 3D conditions. Cells were treated with vehicle (DMSO), 25 nM eFT226 (eIF4Ai), 100 nM MRTX849 (KRASi), or both agents together (Combo). Data are represented as mean ± SD. n = 3. ***P < 0.001; ****P < 0.0001, 1-way ANOVA and Tukey’s post hoc test. (B) Representative photographs of sensitive KRAS G12C–mutant NSCLC spheroids after 72 hours of indicated drug treatments. Images were obtained using the 2X Bright Field channel. Original magnification, ×2. (C) Bar graph depicting fold change in cell numbers after 72 hours (versus day 0) in the same panel of cell lines grown in 2D tissue-culture conditions with 2% serum. Cells were treated with vehicle (DMSO), 25 nM eFT226 (eIF4Ai), 100 nM MRTX849 (KRASi), or both agents together (Combo). Data are represented as means ± SD. n = 3. ****P < 0.0001, 1-way ANOVA and Tukey’s post hoc test). (D) Immunoblots showing suppression of phospho-ERK by MRTX849 (KRASi, 100 nM) and/or eFT226 (eIF4Ai, 25 nM) after 24 hours of treatment. (E) Bar graphs depicting fold change in cell number of specified cell lines transfected with either siCNT or siEIF4A1 and treated with vehicle (DMSO) or 100 nM MRTX849 (KRASi) for 72 hours in 2D/low-serum conditions. Data are represented as means ± SD. n = 3. ****P < 0.0001, 1-way ANOVA and Tukey’s post hoc test. Immunoblots confirm suppression of eIF4A1 by siRNAs.
Figure 2
Figure 2. eIF4A inhibitors similarly enhance the effects of MEK inhibitors.
(A) Bar graph depicting fold change in cell numbers in NSCLC cell lines harboring various mutations in KRAS treated with vehicle (DMSO), 25 nM eFT226 (eIF4Ai), 50 nM trametinib (MEKi), or both agents together (Combo) for 72 hours in 2D/low-serum conditions. Data are represented as means ± SD. n = 3. ***P < 0.001; ****P < 0.0001, 1-way ANOVA and Tukey’s post hoc test. H23 (KRAS G12C), H1573 (KRAS G12A), LU99 (KRAS G12C), H1792 (KRAS G12C), HCC44 (KRAS G12C), LU65 (KRAS G12C), H441 (KRAS G12V), H1944 (KRAS G13D), H2122 (KRAS G12C), A549 (KRAS G12S), H1373 (KRAS G12C), H2030 (KRAS G12C), H1355 (KRAS G13C). (B) Immunoblots for each cell line showing suppression of phospho-ERK by trametinib (MEKi) after 24 hours. (C) Bar graphs depicting fold change in cell numbers of specified cell lines transfected with either siCNT or siEIF4A1 and treated with vehicle (DMSO) or 50 nM trametinib (MEKi) for 72 hours in 2D/low-serum conditions. Data are represented as means ± SD. n = 3. ****P < 0.0001, 1-way ANOVA and Tukey’s post hoc test. Immunoblots confirm suppression of eIF4A1 by siRNAs.
Figure 3
Figure 3. eIF4A inhibitors synergize with KRAS G12C or MEK inhibitors and trigger apoptosis in NSCLCs.
(A and B) Synergy plots depicting the effects of indicated drug combinations using the HSA model. (C and D) Long-term cell proliferation assay of KRAS-mutant NSCLC cells treated with vehicle (DMSO), 25 nM eFT226 (eIF4Ai), 100 nM MRTX849 (KRASi), 50 nM trametinib (MEKi), or drug combinations (Combo) up to 3 weeks. (EG) Incucyte live-cell imaging data depicting cleaved caspase-3/7 activity in sensitive H23 and H1573 and resistant H2030 cell lines in response to vehicle (DMSO), 25 nM eFT226 (eIF4Ai), 100 nM MRTX849 (KRASi), 50 nM trametinib (MEKi), or drug combinations (Combo).
Figure 4
Figure 4. Combined eIF4A and RAS/ERK pathway inhibitors promote potent and durable responses in vivo.
Graphs depicting the fold change in tumor volume of (A and B) H23-derived xenograft models and (C and D) DFCI-730 PDX models treated for 28 days with vehicle, 100 mg/kg QD MRTX849 (KRASi), 0.5 mg/kg Q4D eFT226 (eIF4Ai), or the 2 agents together (Combo). Data are represented as means ± SEM. n = 7–8 tumors per condition. (B and D) Waterfall plots depicting fold change of each tumor within the 4 treatment arms after 28 days of treatment (versus day 0). ****P < 0.0001, 1-way ANOVA and Tukey’s post hoc test. Single asterisks indicate maximum tumor volume. These mice reached end point at days 21 and 25. Graphs depicting the fold change in tumor volume of (E and F) H1573-derived xenograft models and (G and H) H441-derived xenograft models treated for 28 days with vehicle, 0.6 mg/kg QD trametinib (MEKi), 0.5 mg/kg Q4D eFT226 (eIF4Ai), or the 2 agents together (Combo). Data are represented as means ± SEM. n = 7–10 tumors per condition. (F and H) Waterfall plots depicting fold change of each tumor within the 4 treatment arms after 28 days of treatment (versus day 0). ****P < 0.0001, 1-way ANOVA and Tukey’s post hoc test. Single asterisks indicate maximum tumor volume. These mice reached end point at days 18 and 21.
Figure 5
Figure 5. eIF4A and RAS pathway inhibitors cooperatively suppress the expression of prosurvival BCL-2 family proteins, cyclin D1, and CDK4.
(A) Heatmap depicting protein expression of established eIF4A-regulated targets in H23- and H1944-sensitive lines after 24 hours of treatment with vehicle (DMSO) or eFT226 (eIF4Ai). Protein expression was normalized by GAPDH. Raw data from Western blots are shown in Supplemental Figure 3. (B and C) Immunoblots of MCL1, BCL-xL, BCL-2, CDK4, and cyclin D1 protein levels in sensitive cell lines after 24 hours of specified treatments. *For H1944, the loading control is the same as shown in Figure 2B because protein expression was tested using the same membrane. (D) Immunoblots of the same targets in resistant cell lines after 24 hours of specified treatments.
Figure 6
Figure 6. Suppression of prosurvival proteins underlies the therapeutic response to combined eIF4A and RAS pathway inhibitors.
(A) Bar graphs depicting the effects of either KRASi (left, middle) or MEKi (right) in sensitive cell lines in the presence of the indicated siRNA pools. The fold change in cell number was calculated after 72 hours of treatment (versus day 0) in response to 100 nM MRTX849 (KRASi) or 50 nM trametinib (MEKi). Data are represented as means ± SD. n = 3. The siCDK4 studies were performed separately; however, control values were similar (primary data are shown in Supplemental Figure 4). *Complete genetic ablation of MCL1 alone in H23 cells resulted in cell death, preventing further analysis. (B) Bar graphs depicting fold changes in cell numbers in cells treated for 72 hours (versus day 0) with 100 nM S63845 (MCL1i) or 1 μM navitoclax (BCL-xL/BCL-2i) or 1 μM venetoclax (BCL-2i) combined with either 100 nM MRTX849 (KRASi) or 50 nM trametinib (MEKi). Data are represented as means ± SD. n = 3. ***P < 0.001; ****P < 0.0001, 1-way ANOVA and Tukey’s post hoc test. (C) Bar graphs depicting fold change in cell number in cells treated for 72 hours with 500 nM palbociclib (CDK4/6i) combined with either 100 nM MRTX849 (KRASi) or 50 nM trametinib (MEKi). Data are represented as means ± SD. n = 3. **P < 0.01; ***P < 0.001; ****P < 0.0001, 1-way ANOVA and Tukey’s post hoc test.
Figure 7
Figure 7. Reconstitution with survival proteins prevents cell death in response to eIF4A and KRAS G12C inhibitors.
(A) (Left) Bar graphs depicting fold changes in cell numbers of H23 and H1792 cells ectopically expressing BCL2L1 (BCL-xL), BCL2, or MCL1 cDNAs treated for 72 hours with combined 25 nM eFT226 (eIF4Ai) and 100 nM MRTX849 (KRASi). Data are represented as means ± SD. n = 3. (Right) Immunoblots confirming overexpression of BCL-xL, BCL-2, and MCL1 by cDNAs. (B) Immunoblots showing interactions of MCL1 and BCL-xL with immunoprecipitated proapoptotic BIM and BAX proteins, respectively, in response to specified drug treatments in sensitive H23 cells.
Figure 8
Figure 8. MYC amplification or overexpression dictates the sensitivity to combined eIF4A and RAS pathway inhibitors.
(A) MYC copy-number variations (CNV) and KRAS mutational data of the 13 NSCLC cell lines retrieved from cBioPortal. (B) Immunoblots showing protein expression of MYC in NSCLC cells under baseline conditions. (C) GSEA analysis comparing the expression of MYC-regulated ribosomal and translation components in NSCLC cell lines at baseline. Heatmap shows expression of individual genes. (D) (Top) Bar graph depicting fold change in cell number of resistant NSCLC cells ectopically expressing control or MYC cDNAs treated for 72 hours with vehicle (DMSO) or combined 25 nM eFT226 (eIF4Ai) and either 100 nM MRTX849 (KRASi) or 50 nM trametinib (MEKi). Data are represented as means ± SD. n = 3. ****P < 0.001, 1-way ANOVA and Tukey’s post hoc test. (Bottom) Immunoblots showing suppression of phospho-ERK and overexpression of MYC in response to specified treatments and MYC ectopic expression. o/e, overexpression. (E) (Left) Percentage live/dead of high MYC (DFCI-730, DFCI-456, MGH-9029-1B) and low MYC (MGH-1112-1, MGH-1196-2) PDOTSs treated with DMSO, 25 nM eFT226 (eIF4Ai), 100 nM MRTX849 (KRASi), or combined drugs for 6 days in 3D microfluidic culture. (Right) Immunoblots showing protein levels of MYC in PDX tumor samples under baseline conditions.
Figure 9
Figure 9. MYC overexpression creates a dependency on eIF4A for the expression of prosurvival proteins.
(A) Immunoblots showing MCL1, BCL-xL, and BCL-2 protein levels in response to 24 hours of specified treatments in control and MYC-overexpressing resistant lines. (B and C) Immunoblots showing interactions of MCL1 and BCL-xL with immunoprecipitated proapoptotic BIM and BAX proteins, respectively, in response to specified drug treatments in control and MYC-overexpressing resistant lines. The GAPDH immunoblots denoted by asterisks, which serve as a loading control, have been duplicated from the left side of that panel, because immunoblots were all generated from the same gel and membrane. (Right) Immunoblots confirm ectopic expression of MYC by cDNAs.

Comment in

References

    1. Román M, et al. KRAS oncogene in non-small cell lung cancer: clinical perspectives on the treatment of an old target. Mol Cancer. 2018;17(1):33. doi: 10.1186/s12943-018-0789-x. - DOI - PMC - PubMed
    1. Lanman BA, et al. Discovery of a covalent inhibitor of KRASG12C (AMG 510) for the treatment of solid tumors. J Med Chem. 2020;63(1):52–65. doi: 10.1021/acs.jmedchem.9b01180. - DOI - PubMed
    1. Hallin J, et al. The KRASG12C inhibitor MRTX849 provides insight toward therapeutic susceptibility of KRAS-mutant cancers in mouse models and patients. Cancer Discov. 2020;10(1):54–71. doi: 10.1158/2159-8290.CD-19-1167. - DOI - PMC - PubMed
    1. Li B, et al. PS01.07 registrational phase 2 trial of sotorasib in KRAS p.G12C mutant NSCLC: first disclosure of the codebreak 100 primary analysis. J Thorac Oncol. 2021;16(3):S61. doi: 10.1016/j.jtho.2021.01.321. - DOI
    1. Riely GJ, et al. 99O_PR KRYSTAL-1: activity and preliminary pharmacodynamic (PD) analysis of adagrasib (MRTX849) in patients (Pts) with advanced non–small cell lung cancer (NSCLC) harboring KRASG12C mutation. J Thorac Oncol. 2021;16(4):S751–S752. doi: 10.1016/S1556-0864(21)01941-9. - DOI

Publication types

MeSH terms

Substances