. 2023 Sep 5;32(18):2773-2786.
doi: 10.1093/hmg/ddad107.

Cell-type specific defects in PTEN-mutant cortical organoids converge on abnormal circuit activity

Affiliations

Cell-type specific defects in PTEN-mutant cortical organoids converge on abnormal circuit activity

Martina Pigoni et al. Hum Mol Genet. .

Abstract

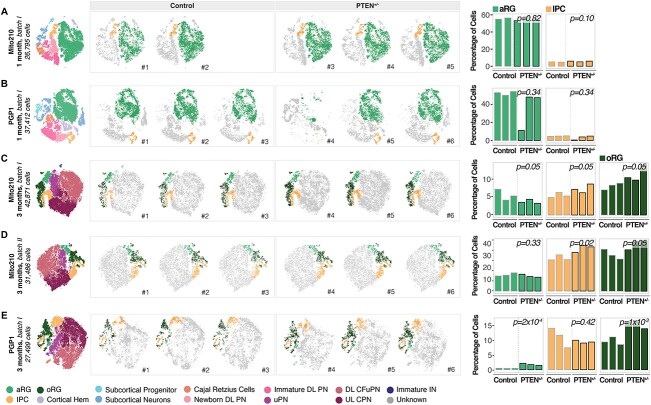
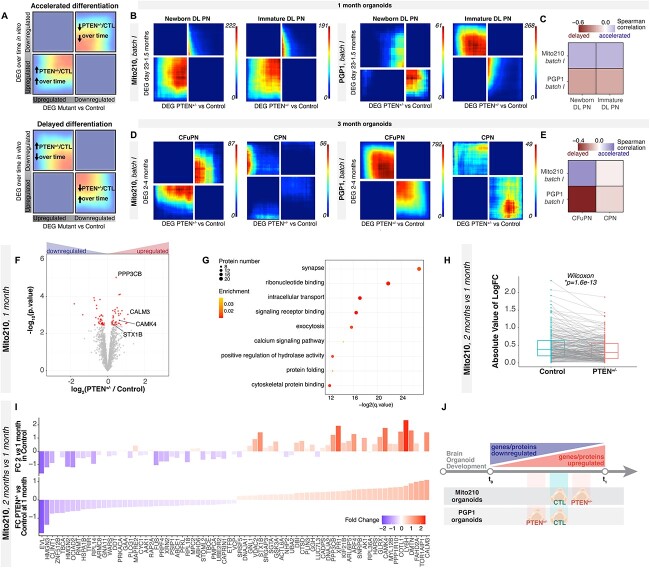
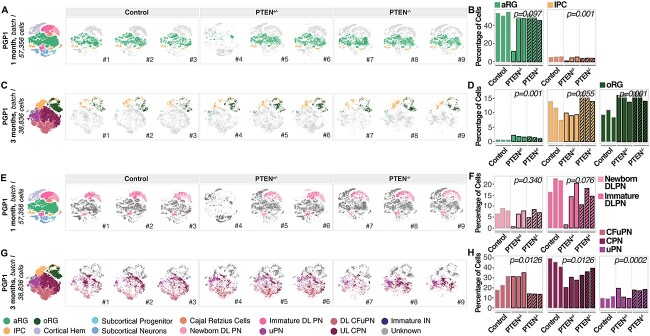
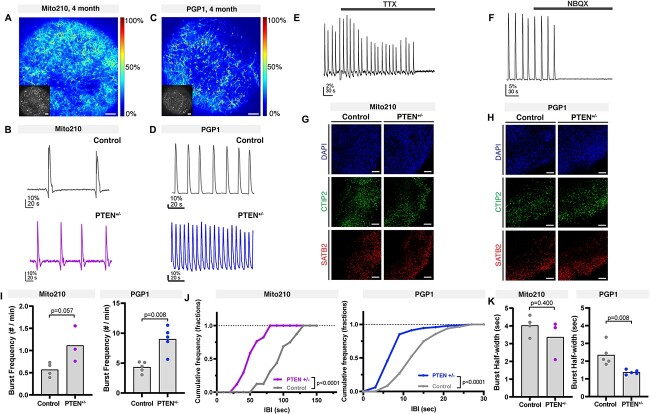
De novo heterozygous loss-of-function mutations in phosphatase and tensin homolog (PTEN) are strongly associated with autism spectrum disorders; however, it is unclear how heterozygous mutations in this gene affect different cell types during human brain development and how these effects vary across individuals. Here, we used human cortical organoids from different donors to identify cell-type specific developmental events that are affected by heterozygous mutations in PTEN. We profiled individual organoids by single-cell RNA-seq, proteomics and spatial transcriptomics and revealed abnormalities in developmental timing in human outer radial glia progenitors and deep-layer cortical projection neurons, which varied with the donor genetic background. Calcium imaging in intact organoids showed that both accelerated and delayed neuronal development phenotypes resulted in similar abnormal activity of local circuits, irrespective of genetic background. The work reveals donor-dependent, cell-type specific developmental phenotypes of PTEN heterozygosity that later converge on disrupted neuronal activity.


Figures

Figure 1
Figure 1
oRG are consistently affected in PTEN mutant organoids independently of genetic background. (AE) Left: t-SNE plots of scRNA-seq data, color-coded by cell type, from 1-month Mito210 control and PTEN heterozygous mutant organoids (Mito210 control n = 2, Mito210 heterozygous n = 3) (A), 1-month PGP1 control and PTEN heterozygous mutant organoids (n = 3 single organoids per genotype) (B), 3-month Mito210 control and PTEN heterozygous mutant organoids (n = 3 single organoids per genotype; batch I) (C), 3-month Mito210 control and PTEN heterozygous mutant organoids (n = 3 single organoids per genotype; batch II) (D) and 3-month PGP1 control and PTEN heterozygous mutant organoids (n = 3 single organoids per genotype) (E). Middle: t-SNE plots for individual control and mutant organoids, with cell types of interest highlighted in color: apical radial glia (aRG, light green), intermediate progenitor cells (IPC, yellow) and oRG (dark green). Right: bar charts showing the percentage of cells for the highlighted cell populations in each control and mutant organoid. FDRs for a difference in cell type proportions between control and mutant, based on logistic mixed models (see Materials and Methods) are shown. aRG, apical radial glia; DL, deep layer; UL, upper layer; PNs, projection neurons; oRG, outer radial glia; IPCs, intermediate progenitor cells; CPNs, callosal projection neurons; CFuPNs, corticofugal projection neurons; uPNs, unspecified PN; INs, interneurons.
Figure 2
Figure 2
Deep-layer neurons show asynchronous development across PTEN mutant organoids at multiple timepoints. (A) Schematic explaining the rank–rank hypergeometric overlap (RRHO2) output plot. Genes from each list are ordered from most upregulated to most downregulated, with the most upregulated gene of each differential gene list in the lower left corner. (B) RRHO2 plots comparing differentially expressed genes (DEG) between control and PTEN heterozygous mutant organoids at 1 month in vitro versus genes changing over time in organoids between 23 days and 1.5 months in vitro, in the newborn DLPN and immature DLPN populations. (C) Spearman correlation of DEG between each cortical cell type within control and PTEN mutant organoids at 1 month, and genes that change within that cell type from 23 days to 1.5 months in control organoids (17). Correlation is calculated on each gene’s signed logFC. (D) RRHO2 plots comparing differentially expressed genes between control and PTEN heterozygous mutant organoids at three month in vitro versus genes changing over time in organoids between two and four months in vitro, in the CFuPN and CPN populations. (E) Spearman correlation of DEG between each cortical cell type within control and PTEN heterozygous mutant organoids at 3 months, and genes that change within that cell type from 2 to 4 months in control organoids (17). Correlation is calculated on each gene’s signed logFC. (F) Volcano plot showing fold change versus FDR of measured proteins in MS experiments comparing PTEN heterozygous versus control organoids cultured for 35 days (n = 4 single organoids per genotype). Significant DEPs are shown in red (FDR < 0.1). Proteins mentioned in the text are highlighted. (G) Enriched GO terms for DEPs between PTEN heterozygous and control organoids cultured for 1 month in vitro. (H) Protein expression changes at 2 vs. 1 month for control and mutant organoids. Gray lines connect values for the same protein in the two genotypes. P-value from a paired signed Wilcoxon rank test. Only significant DEPs are shown; for the same analysis done with all detected proteins, see Supplementary Material, Figure 3. (I) Comparison of protein expression changes in PTEN heterozygous vs. control organoids at 1 month (bottom) versus changes in 2- vs. 1-month control organoids (top). Color and y-axis indicate log2 fold change. Only proteins with significantly differential expression between control and mutant at 1 month are shown (n = 3 single organoids per genotype for 2 months). (J) Schematic summarizing line-specific developmental acceleration/deceleration phenotypes from scRNA-seq and proteomics experiments. DL, deep layer; CPN, callosal projection neurons; CFuPN, corticofugal; CTL, control; FC, fold change.
Figure 3
Figure 3
Differences in PTEN dosage result in convergent progenitor phenotypes, but divergent projection neurons abnormalities. (A) Left: t-SNE plot of scRNA-seq data, color-coded by cell type, from 1-month PGP1 control, PTEN heterozygous and PTEN homozygous mutant organoids (n = 3 single organoids per genotype). Right: t-SNE plots for control, PTEN heterozygous, and PTEN homozygous mutant individual organoids, with cell types of interest highlighted in color: aRG (light green), intermediate progenitors cells (IPC, yellow) and oRG (dark green). (B) Bar charts showing the percentage of cells for the highlighted cell populations in a, right, in each control, PTEN heterozygous, and PTEN homozygous mutant organoid at 1 month in vitro. FDRs for a difference in cell type proportions between control and mutant, based on logistic mixed models (see Materials and Methods) are shown. (C) Left: t-SNE plot of scRNA-seq data, color-coded by cell type, from 3-month PGP1 control, PTEN heterozygous and PTEN homozygous mutant organoids (n = 3 single organoids per genotype). Right: t-SNE plots for control, PTEN heterozygous, and PTEN homozygous mutant individual organoids, with cell types of interest highlighted in color: apical radial glia (aRG, light green), IPCs (yellow) and oRG (dark green). (D) Bar charts showing the percentage of cells for the highlighted cell populations in (C), right, in each control, PTEN heterozygous, and PTEN homozygous mutant organoid at 3 months in vitro. FDRs for a difference in cell type proportions between control and mutant, based on logistic mixed models (see Materials and Methods) are shown. (E) Left: t-SNE plot of scRNA-seq data, color-coded by cell type, from 1-month PGP1 control, PTEN heterozygous and PTEN homozygous mutant organoids (n = 3 single organoids per genotype). Right: t-SNE plots for control, PTEN heterozygous, and PTEN homozygous mutant individual organoids, with cell types of interest highlighted in color: newborn DLPNs (light pink), immature DLPNs (dark pink). (F) Bar charts showing the percentage of cells for the highlighted cell populations in (E), right, in each control, PTEN heterozygous, and PTEN homozygous mutant organoid at 1 month in vitro. FDRs for a difference in cell type proportions between control and mutant, based on logistic mixed models (see Materials and Methods) are shown. (G) Left: t-SNE plot of scRNA-seq data, color-coded by cell type, from 3-month PGP1 control, PTEN heterozygous and PTEN homozygous mutant organoids (n = 3 single organoids per genotype). Right: t-SNE plots for control, PTEN heterozygous, and PTEN homozygous mutant individual organoids, with cell types of interest highlighted in color: corticofugal projection neurons (CFuPNs, pink), callosal projection neurons (CPNs, burgundy), unspecified projection neurons (uPNs, purple). (H) Bar charts showing the percentage of cells for the highlighted cell populations in (G), right, in each control, PTEN heterozygous, and PTEN homozygous mutant organoid at 1 month in vitro. FDRs for a difference in cell type proportions between control and mutant, based on logistic mixed models (see Materials and Methods) are shown. aRG, apical radial glia; DL, deep layer; UL, upper layer; PN, projection neurons; oRG, outer radial glia; IPCs, intermediate progenitor cells; CPNs, callosal projection neurons; CFuPNs, corticofugal projection neurons; uPNs, unspecified PNs; INs, interneurons; CTL, control.
Figure 4
Figure 4
Developmental abnormalities in PTEN mutant organoids converge on altered circuit activity. (AD) Network bursting in cortical organoids. (A, C) Representative images of intact Mito210 (A) and PGP1 (C) control organoid at 4 months transduced with SomaGCaMP6f2, showing the ΔF/F signal at the peak of a network burst using a pseudocolored scale. Inset: Raw fluorescence image. Scale bar: 100 μm. (B, D) Representative population-averaged calcium transient for control (top) and heterozygous mutant (bottom) organoids generated from Mito210 (B) and PGP1 (D) donor lines. (E, F) Example population-averaged calcium transients in control PGP1 organoids upon bath application of 2 μM TTX (E) and 20 μM NBQX (F). (G, H) Immunohistochemistry for CTIP2 (green) and SATB2 (red) in control and PTEN heterozygous mutant organoids at 3 months, from both Mito210 (G) and PGP1 (H) cell lines. Scale bars: 100 μm. (I) Spontaneous network burst frequency. The dots show the average values per organoid, and the bars show the mean across all organoids. (J) Cumulative frequency distribution of inter-burst interval (IBI) for control and mutant organoids. (K) Spontaneous network burst duration. The dots show the average values per organoid, and the bars show the mean across all organoids. Min, minutes; sec, seconds.

Comment in

Similar articles

Cited by

References

    1. Lord, C., Brugha, T.S., Charman, T., Cusack, J., Dumas, G., Frazier, T., Jones, E.J.H., Jones, R.M., Pickles, A., State, M.W. et al. (2020) Autism spectrum disorder. Nat. Rev. Dis. Primers, 6, 5. - PMC - PubMed
    1. Geschwind, D.H. and Levitt, P. (2007) Autism spectrum disorders: developmental disconnection syndromes. Autism spectrum disorders: developmental disconnection syndromes. Curr. Opin. Neurobiol., 17, 103–111. - PubMed
    1. Grove, J., Ripke, S., Als, T.D., Mattheisen, M., Walters, R.K., Won, H., Pallesen, J., Agerbo, E., Andreassen, O.A., Anney, R. et al. (2019) Identification of common genetic risk variants for autism spectrum disorder. Nat. Genet., 51, 431–444. - PMC - PubMed
    1. Rosenberg, R.E., Law, J.K., Yenokyan, G., McGready, J., Kaufmann, W.E. and Law, P.A. (2009) Characteristics and concordance of autism spectrum disorders among 277 twin pairs. Arch. Pediatr. Adolesc. Med., 163, 907–914. - PubMed
    1. Ruzzo, E.K., Pérez-Cano, L., Jung, J.Y., Wang, L.K., Kashef-Haghighi, D., Hartl, C., Singh, C., Xu, J., Hoekstra, J.N., Leventhal, O. et al. (2019) Inherited and de novo genetic risk for autism impacts shared networks. Cell, 178, 850–866.e26. - PMC - PubMed

Publication types