. 2023 Jul 25;42(7):112680.
doi: 10.1016/j.celrep.2023.112680. Epub 2023 Jun 28.

Microbiota-produced indole metabolites disrupt mitochondrial function and inhibit Cryptosporidium parvum growth

Affiliations

Microbiota-produced indole metabolites disrupt mitochondrial function and inhibit Cryptosporidium parvum growth

Lisa J Funkhouser-Jones et al. Cell Rep. .

Abstract

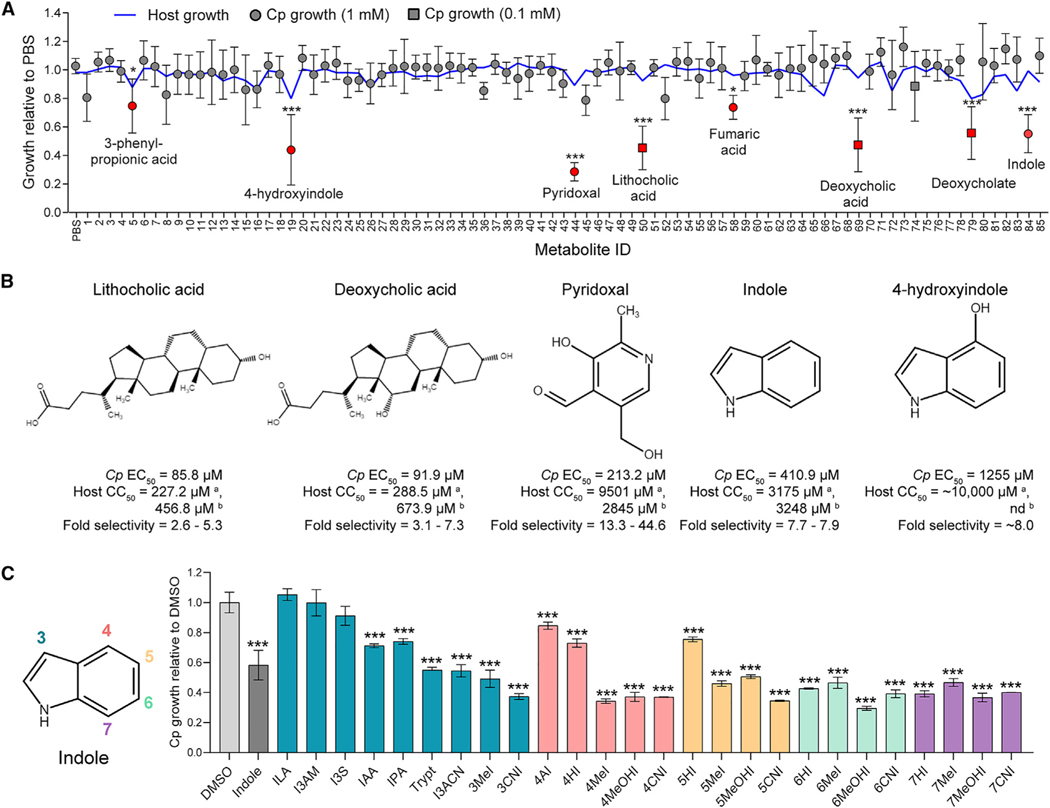
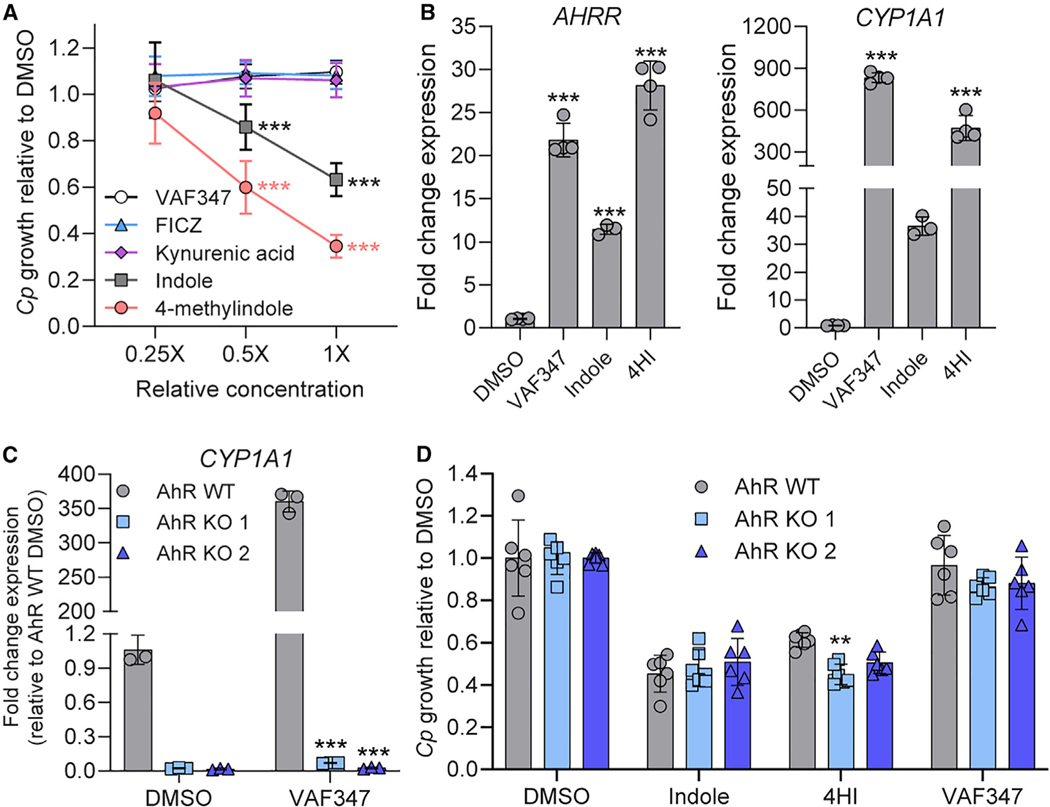
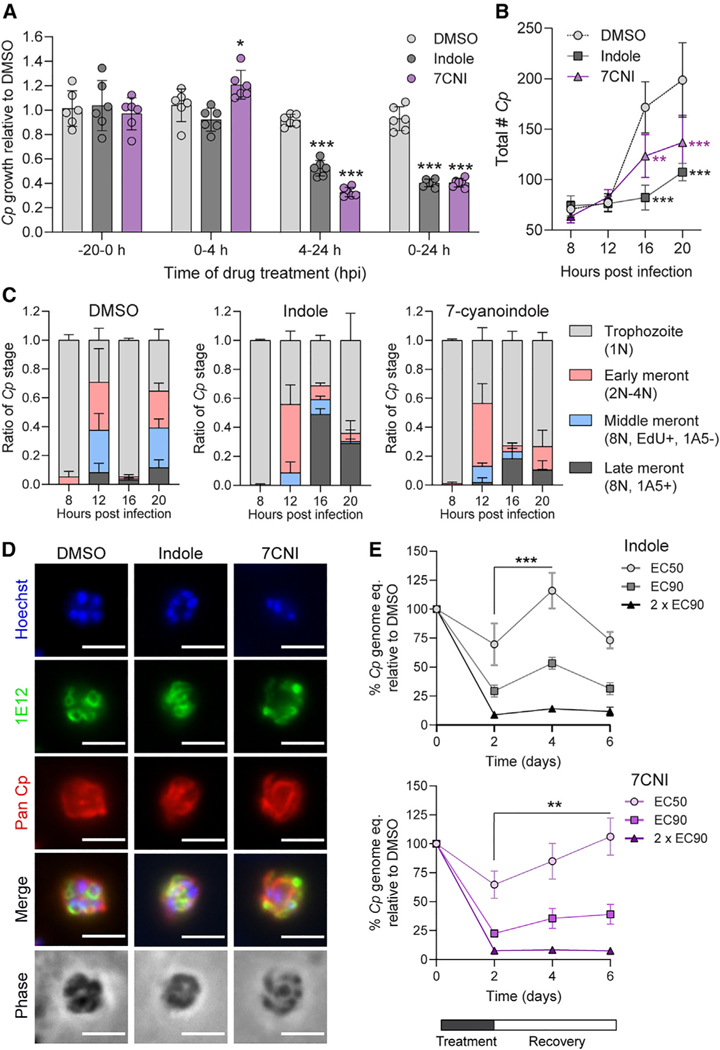
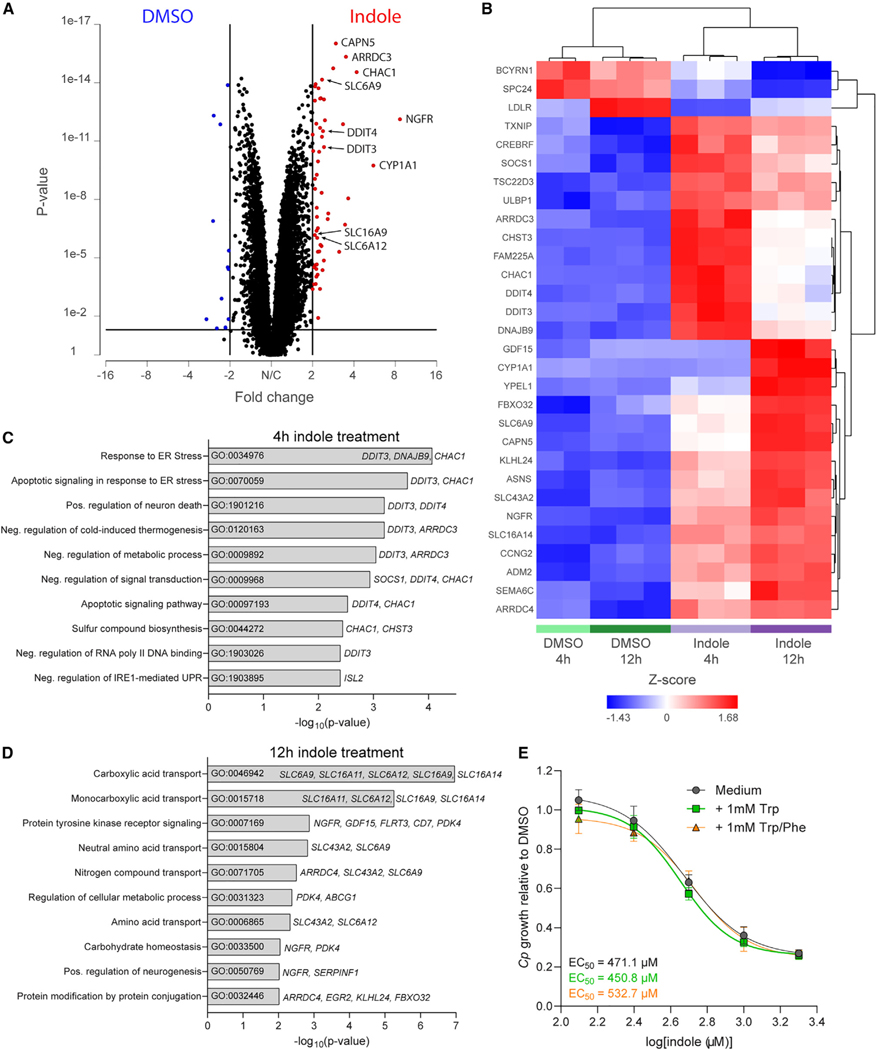
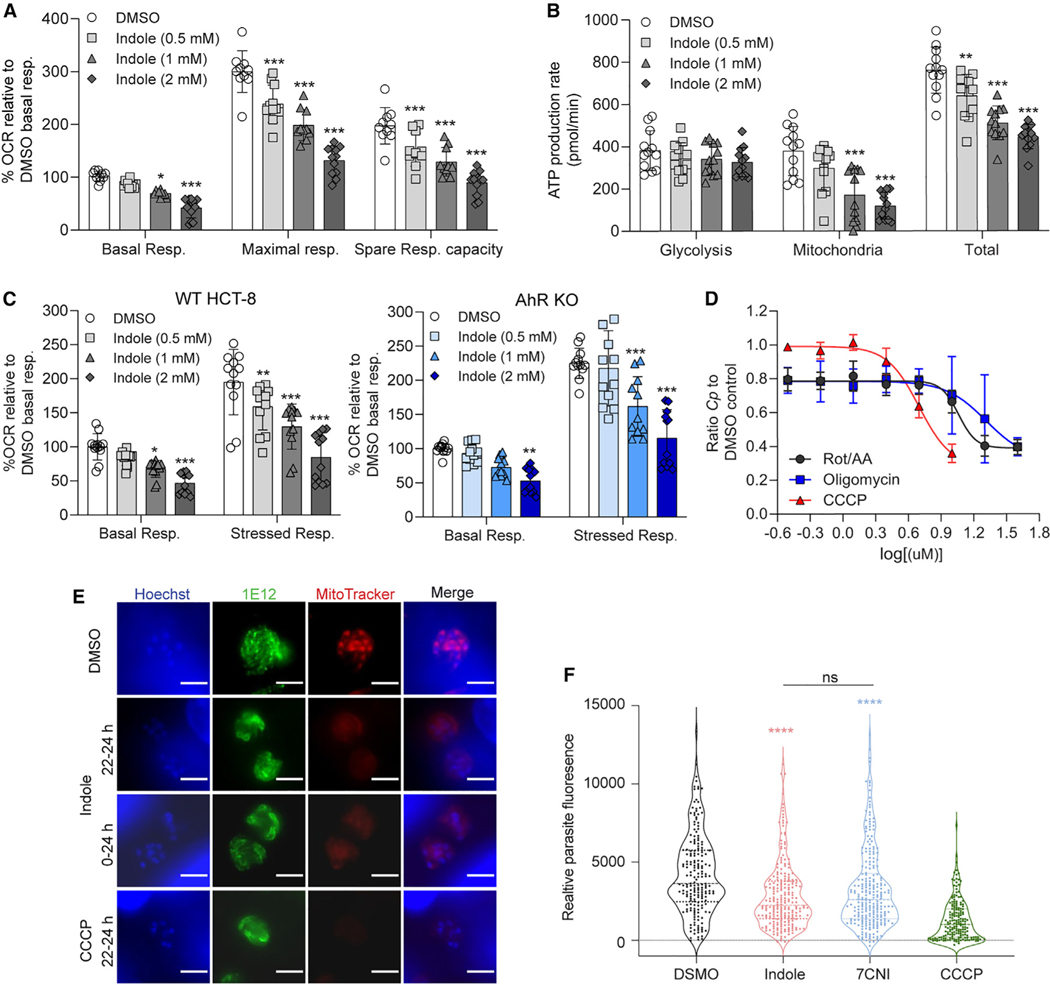
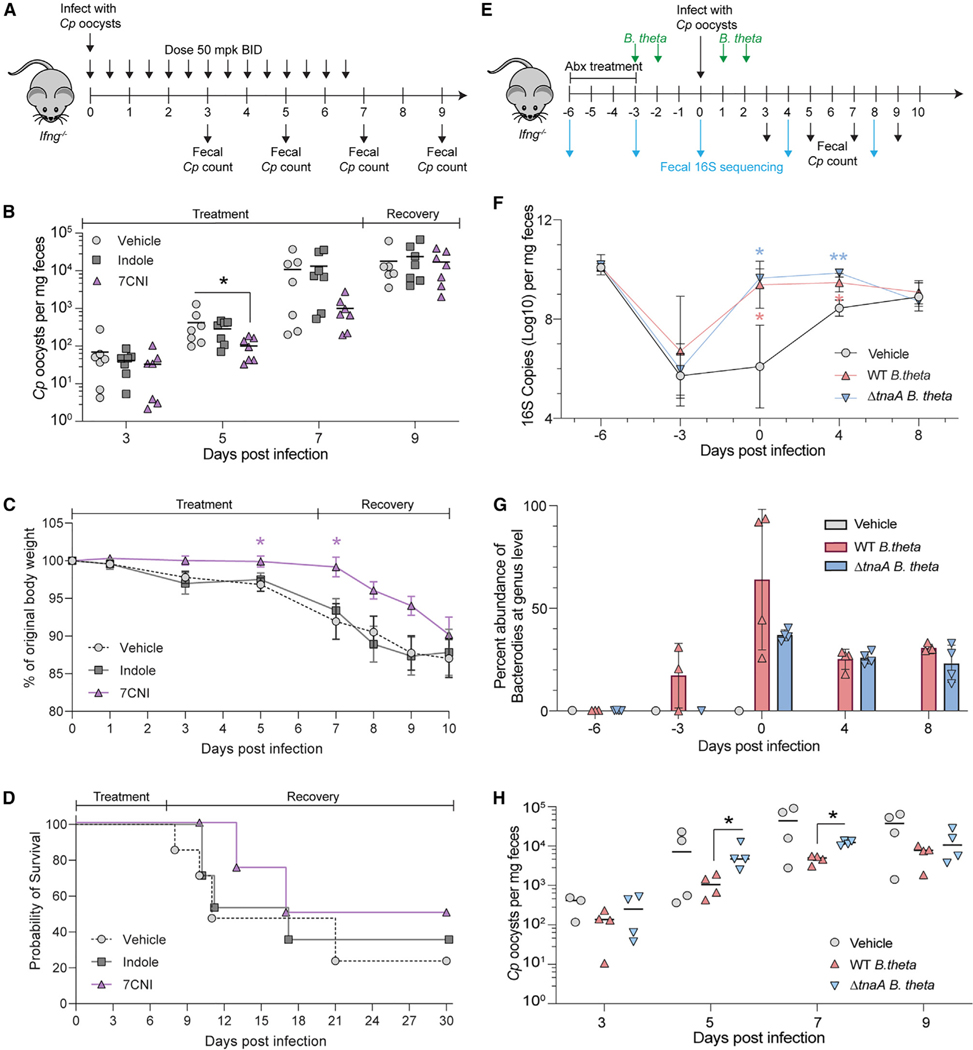
Cryptosporidiosis is a leading cause of life-threatening diarrhea in young children in resource-poor settings. To explore microbial influences on susceptibility, we screened 85 microbiota-associated metabolites for their effects on Cryptosporidium parvum growth in vitro. We identify eight inhibitory metabolites in three main classes: secondary bile salts/acids, a vitamin B6 precursor, and indoles. Growth restriction of C. parvum by indoles does not depend on the host aryl hydrocarbon receptor (AhR) pathway. Instead, treatment impairs host mitochondrial function and reduces total cellular ATP, as well as directly reducing the membrane potential in the parasite mitosome, a degenerate mitochondria. Oral administration of indoles, or reconstitution of the gut microbiota with indole-producing bacteria, delays life cycle progression of the parasite in vitro and reduces the severity of C. parvum infection in mice. Collectively, these findings indicate that microbiota metabolites impair mitochondrial function and contribute to colonization resistance to Cryptosporidium infection.

Keywords: CP: Microbiology; apicomplexan parasite; indole; membrane potential; metabolism; microbial metabolites; microbiota; mitochondria; mitosome; mucosal infection; parasitology.


Conflict of interest statement

Declaration of interests The authors declare no competing interests.

Figures

Figure 1.
Figure 1.. Gut metabolites, specifically secondary bile acids and indoles, inhibit C. parvum (Cp) infection in vitro
(A) Effects of 85 intestinal metabolites at 1 mM (circles) or 0.1 mM (squares) on Cp infection in HCT-8 cells 24 hpi. Data plotted represent mean ± SD of Cp or mean host cell numbers (blue line) relative to PBS control for six independent experiments. Differences between Cp numbers for each metabolite and the PBS control were analyzed using a one-way ANOVA followed by Dunnett’s test for multiple comparisons. Metabolites that significantly inhibited Cp growth are indicated in red. *p < 0.05 and ***p < 0.001. (B) Chemical structures of five inhibitory metabolites with their respective EC50 values for Cp and host cells and fold selectivity (host half maximal cytotoxic concentration [CC50] divided by Cp EC50). aHost CC50 values were calculated by counting Hoechst stained nuclei. CC50 values were calculated using a nonlinear regression curve fit with six replicates (three technical replicates from two independent experiments) per concentration. bHost CC50 values were calculated by Cell Titer-Glo Assay. nd, not done because of incompatibility with the assay. CC50 values were calculated using a nonlinear regression curve fit with nine replicates (three technical replicates from three independent experiments) per concentration. (C) Screen of indole analogs (1 mM) modified at the 3-carbon (teal), 4-carbon (pink), 5-carbon (orange), 6-carbon (green), or 7-carbon (purple) positions and their effects on Cp infection in HCT-8 cells. Data plotted represent mean ± SD of six replicates (three technical replicates from two independent experiments). Differences between mean Cp numbers for each metabolite and the DMSO control were analyzed using a one-way ANOVA followed by Dunnett’s test for multiple comparisons. ***p < 0.001. ILA, indole-3-lactic acid; I3AM, indole-3-acetamide; I3S, indoxyl-3-sulfate; IAA, indole-3-acetic acid; IPA, indole-3-propionic acid; Trypt, tryptamine; I3ACN, indole-3-acetonitrile; MeI, methylindole; CNI, cyanoindole; AI, aminoindole; HI, hydroxyindole; MeOHI, methoxyindole.
Figure 2.
Figure 2.. Indoles do not inhibit C. parvum (Cp) through the host AhR pathway
(A) Ratio of Cp relative to DMSO control in HCT-8 cells after 24 h treatment with serial dilutions of AhR agonists. Starting concentrations (1×) were 1 μM for VAF347 and FICZ and 1 mM for kynurenic acid, indole, and 4-methylindole. Data plotted represent mean ± SD of nine replicates (three technical replicates from three independent experiments). Differences between mean Cp ratio in 1×- or 0.5×-treated cultures versus 0.25×-treated cultures for each compound were analyzed using a two-way ANOVA followed by Dunnett’s test for multiple comparisons. ***p < 0.001. (B) Fold change in gene expression of human AHRR or CYP1A1 genes (normalized to GAPDH) in uninfected HCT-8 cultures after 24 h treatment with VAF347 (250 nM), indole (1.5 mM), or 4-hydroxyindole (4HI; 2.5 mM) relative to 1% DMSO control. Data plotted represent mean ± SD of 3 or 4 technical replicates from a single experiment. For each gene, differences between fold change in gene expression for each treatment versus DMSO control were analyzed using a one-way ANOVA followed by Dunnett’s test for multiple comparisons. ***p < 0.001. (C) Fold change in gene expression of human CYP1A1 genes (normalized to GAPDH) in uninfected HCT-8 AhR WT (gray) or KO cell lines (blue) after 24 h treatment with VAF347 (500 nM) relative to 1% DMSO control. Data plotted represent mean ± SD of three technical replicates from a single experiment. Differences between fold change in gene expression for each AhR KO versus AhR WT cell line for each treatment were analyzed using a two-way ANOVA followed by Dunnett’s test for multiple comparisons. ***p < 0.001. (D) Ratio of Cp relative to DMSO control in HCT-8 AhR WT (gray) or KO cell lines (blue) after 24 h treatment with 0.5% DMSO, indole (1 mM), 4HI (1 mM), or VAF347 (500 nM). Data plotted represent mean ± SD of six replicates (three technical replicates from two independent experiments). Differences between Cp ratio in each AhR KO versus AhR WT cell line for each treatment were analyzed using a two-way ANOVA followed by Dunnett’s test for multiple comparisons. **p < 0.01. See also Figure S1.
Figure 3.
Figure 3.. Indoles delay C. parvum (Cp) life cycle progression
(A) Ratio of Cp numbers relative to DMSO control in HCT-8 cells after treatment with 1% DMSO or EC90 concentrations of indole (880 μM) or 7-cyanoindole (7CNI; 500 μM) for the indicated hours post-infection (hpi). Data plotted represent mean ± SD of six replicates (three technical replicates from two independent experiments). Differences between mean Cp ratio in indole or 7CNI-treated cultures vs in the DMSO control at each time point were analyzed using a two-way ANOVA followed by Dunnett’s test for multiple comparisons. *p < 0.05 and ***p < 0.001. (B) Total number of Cp in HCT-8 cultures treated with 1% DMSO or EC90 concentrations of indole or 7CNI for the indicated hours post-infection. Data plotted represent mean ± SD of three independent experiments (same experiments as in C). Differences between mean Cp numbers in indole or 7CNI-treated cultures vs in the DMSO control at each time point were analyzed using a two-way ANOVA followed by Dunnett’s test for multiple comparisons. **p < 0.01 and ***p < 0.001. (C) Ratio of the number of Cp in the trophozoite, early meront, middle meront, or late meront stages in infected HCT-8 cultures treated with 1% DMSO or EC90 concentrations of indole or 7CNI at the indicated hours post-infection. N, number of nuclei per parasite. Data plotted represent mean ± SD of three independent experiments. (D) Immunofluorescence images of Cp in HCT-8 cultures treated with 1% DMSO or EC90 concentrations of indole or 7CNI 22 hpi. Parasites are labeled with membrane marker 1E12 (green) and a general Cp antibody, Pan Cp (red). Nuclei are stained with Hoechst. Scale bar, 3 μm. (E) Washout experiments in Cp-infected air-liquid interface (ALI) cultures treated with 1% DMSO or indole at EC50 (577 μM), EC90 (1,894 μM), or 2 × EC90 (3,788 μM) or 7CNI at EC50 (379 μM), EC90 (688 μM), or 2 × EC90 (1,376 mM) for 48 h before washout. Cp genome equivalents were normalized to the DMSO control at each time point. Data plotted represent mean ± SD of six replicates (three technical replicates from two independent experiments). Differences between mean percentage Cp after washout versus mean percentage Cp at time of washout (2 dpi) for each indole concentration were analyzed using a two-way ANOVA followed by Dunnett’s test for multiple comparisons. **p < 0.01 and ***p < 0.001. See also Figures S2 and S3.
Figure 4.
Figure 4.. Indole induces ER stress and transporter upregulation in HCT-8 cells
(A) Volcano plot of fold change vs p value after gene-specific analysis (GSA) of indole vs DMSO-treated HCT-8 cells highlighting genes significantly (p < 0.05) upregulated (red) or downregulated (blue) after indole treatment by >2-fold. (B–D) Hierarchical clustering analysis of the 30 most differentially regulated genes (FDR-corrected p < 1 × 10) between indole and DMSO-treated HCT-8 cells. (C and D) Gene Ontology (GO) pathway analysis performed in Enrichr using genes significantly upregulated after (C) 4 h or (D) 12 h of indole treatment as input. Upregulated genes associated with each pathway are listed to the right of the bar graph. (E) Ratio of C. parvum (Cp) relative to DMSO control in HCT-8 cells after 24 h treatment with a serial dilution of indole in growth medium supplemented with 1 mM tryptophan (Trp) or 1 mM Trp plus 1 mM phenylalanine (PHE). EC50 values were calculated for each medium using a nonlinear regression curve fit with six replicates (three technical replicates from two independent experiments) per indole concentration.
Figure 5.
Figure 5.. Indole impairs host mitochondrial ATP production and affects C. parvum (Cp) mitosome potential
(A) Metabolic analysis using the Seahorse XF Cell Mito Stress Test kit on HCT-8 cells treated for 18 h with 1% DMSO or indole (0.5, 1, or 2 mM). Data calculated asa percentage of the oxygen consumption rate (OCR) for each well relative to the mean basal OCR of DMSO control cells for that experiment. Spare respiratory capacity = maximal respiratory rate - basal respiratory rate for each well. Data plotted represent mean ± SD of 12 replicates (six technical replicates from two independent experiments). Differences between percentage OCR for each indole concentration vs the DMSO control for each measurement were analyzed using a two-way ANOVA followed by Dunnett’s test for multiple comparisons. *p < 0.05 and ***p < 0.001. (B) Metabolic analysis using the Seahorse XF Real-Time ATP Rate assay on HCT-8 cells treated for 18 h with 1% DMSO or indole (0.5, 1, or 2 mM). Data plotted represent mean ± SD of ATP production rate (pmol/min) produced by glycolysis, the mitochondria, or total ATP (glycolysis + mitochondrial ATP rates) for 12 replicates (six technical replicates from two independent experiments). For each source of ATP, differences between ATP production rate for each indole concentration vs the DMSO control were analyzed using a two-way ANOVA followed by Dunnett’s test for multiple comparisons. **p < 0.01 and ***p < 0.001. (C) Metabolic analysis using the Seahorse XF Cell Energy Phenotype Test kit on HCT-8 AhR WT cells (gray) or AhR KO cells (blue) treated for 18 h with 1% DMSO or indole (0.5, 1, or 2 mM). Data calculated as a percentage of OCR for each well relative to the mean basal OCR of DMSO control cells for that experiment. Data plotted represent mean ± SD of 12 replicates (six technical replicates from two independent experiments). For each cell line, differences between percentage OCR for each indole concentration vs the DMSO control were analyzed using a one-way ANOVA followed by Dunnett’s test for multiple comparisons. *p < 0.05, **p < 0.01, and ***p < 0.001. (D) Ratio of Cp relative to DMSO control in HCT-8 cells after 24 h treatment with serial dilutions of mitochondrial complex I and III inhibitors rotenone and antimycin A, respectively (Rot/AA); ATP synthase inhibitor oligomycin; or proton gradient uncoupler carbonyl cyanide m-chlorophenyl hydrazone (CCCP). Inhibition curves were calculated for each compound using a nonlinear regression curve fit with six replicates (three technical replicates from two independent experiments) per concentration. (E) Immunofluorescence images of Cp in HCT-8 cultures treated with 1% DMSO or 2 × EC90 concentrations of indole (1.76 mM) or 10 μM CCCP for the indicated hours post-infection. Parasites were labeled with membrane marker 1E12 (green), MitoTracker Red CMXRos (red), and nuclei were stained with Hoechst (blue). Scale bar, 3 μm. (F) Distribution of MitoTracker intensity for indole-treated parasites. Cp in HCT-8 cultures treated with 1% DMSO or 2 × EC90 concentrations of indole (1.76 mM), 7-cyanoindole (7CNI) (1 mM), or 10 μM CCCP for 2 h starting 22 hpi. Parasite fluorescence intensity was measured on the basis of MitoTracker staining collected from at least 180 parasites from two independent experiments. Statistical analyses comparing each treatment group with control were performed using two-tailed Mann-Whitney U tests. ****p < 0.0001. ns, not significant. (DMSO compared with indole shown in red asterisk, DMSO compared with 7CNI shown in blue asterisk.). See also Figure S4.
Figure 6.
Figure 6.. Exogenous indole treatment, or reconstitution with indole-producing bacteria, suppresses C. parvum (Cp) infection in GKO mice
(A) GKO mice were treated twice daily by gavage with vehicle (10% DMSO in water) or 50 mg/kg indole or 7-cyanoindole (7CNI) for 7 days. Cp oocysts numbers were quantified from a single fecal pellet per mouse collected 3, 5, 7, and 9 dpi. All data plotted represent 7 mice per treatment group sampled over time from two independent experiments. (B) Cp oocysts per mg feces for each mouse at the indicated days post-infection. Statistical analyses comparing each treatment group with vehicle control on individual days were performed using two-tailed Mann-Whitney U tests. *p < 0.05. (C) Percent of original body weight plotted as mean ± SD. Statistical analysis performed using a mixed-effects model with a Geisser-Greenhouse correction for matched values, followed by Dunnett’s test for multiple comparisons. *p < 0.05. (D) Combined survival curves of all 7 mice for the first 10 days then for the 4 mice from the second experiment for days 11–30. (E) GKO mice were treated with antibiotic to suppress endogenous flora and then reconstituted with WT B. theta or ΔtnaA B. theta followed by challenge with Cp. Oocysts numbers were quantified from fecal pellets collected 3, 5, 7, and 9 dpi. All data plotted represent 4 mice per treatment group sampled over time. (F) Estimation of bacterial burdens in the gut by 16S rRNA qPCR. Mean ± SD. Statistical analyses comparing vehicle with WT B. theta group (shown in blue asterisk) or ΔtnaA B. theta group (shown in red asterisk) on individual days were analyzed using a two-way ANOVA followed by Dunnett’s test for multiple comparisons. *p < 0.05 and **p < 0.01. (G) Relative abundance of Bacteroides at the genus level from each mouse at the indicated days post-infection. (H) Cp oocysts per mg feces for each mouse at the indicated days post-infection. Statistical analyses comparing WT B. theta group with ΔtnaA B. theta group on individual days were performed using two-tailed Mann-Whitney U tests. *p < 0.05. See Figures S5, S6, and S7.

Update of

Comment in

References

    1. O’Connor R,M, Shaffie R, Kang G, and Ward HD (2011). Cryptosporidiosis in patients with HIV/AIDS. AIDS 25, 549–560. 10.1097/QAD.0b013e3283437e88. - DOI - PubMed
    1. Putignani L, and Menichella D. (2010). Global distribution, public health and clinical impact of the protozoan pathogen cryptosporidium. Interdiscip. Perspect. Infect. Dis. 2010, 753512. 10.1155/2010/753512. - DOI - PMC - PubMed
    1. Kotloff KL, Nataro JP, Blackwelder WC, Nasrin D, Farag TH, Panchalingam S, Wu Y, Sow SO, Sur D, Breiman RF, et al. (2013). Burden and aetiology of diarrhoeal disease in infants and young children in developing countries (the Global Enteric Multicenter Study, GEMS): a prospective, case-control study. Lancet 382, 209–222. 10.1016/S0140-6736(13)60844-2. - DOI - PubMed
    1. Kotloff KL, Nasrin D, Blackwelder WC, Wu Y, Farag T, Panchalingham S, Sow SO, Sur D, Zaidi AKM, Faruque ASG, et al. (2019). The incidence, aetiology, and adverse clinical consequences of less severe diarrhoeal episodes among infants and children residing in low-income and middle-income countries: a 12-month case-control study as a follow-on to the Global Enteric Multicenter Study (GEMS). Lancet Global Health 7, e568–e584. 10.1016/S2214-109X(19)30076-2. - DOI - PMC - PubMed
    1. Levine MM, Nasrin D, Acácio S, Bassat Q, Powell H, Tennant SM, Sow SO, Sur D, Zaidi AKM, Faruque ASG, et al. (2020). Diarrhoeal disease and subsequent risk of death in infants and children residing in low-income and middle-income countries: analysis of the GEMS case-control study and 12-month GEMS-1A follow-on study. Lancet Global Health 8, e204–e214. 10.1016/S2214-109X(19)30541-8. - DOI - PMC - PubMed

Publication types