. 2023 Oct 2;83(19):3264-3283.
doi: 10.1158/0008-5472.CAN-23-0705.

Abemaciclib Is Effective in Palbociclib-Resistant Hormone Receptor-Positive Metastatic Breast Cancers

Affiliations

Abemaciclib Is Effective in Palbociclib-Resistant Hormone Receptor-Positive Metastatic Breast Cancers

Juliana Navarro-Yepes et al. Cancer Res. .

Abstract

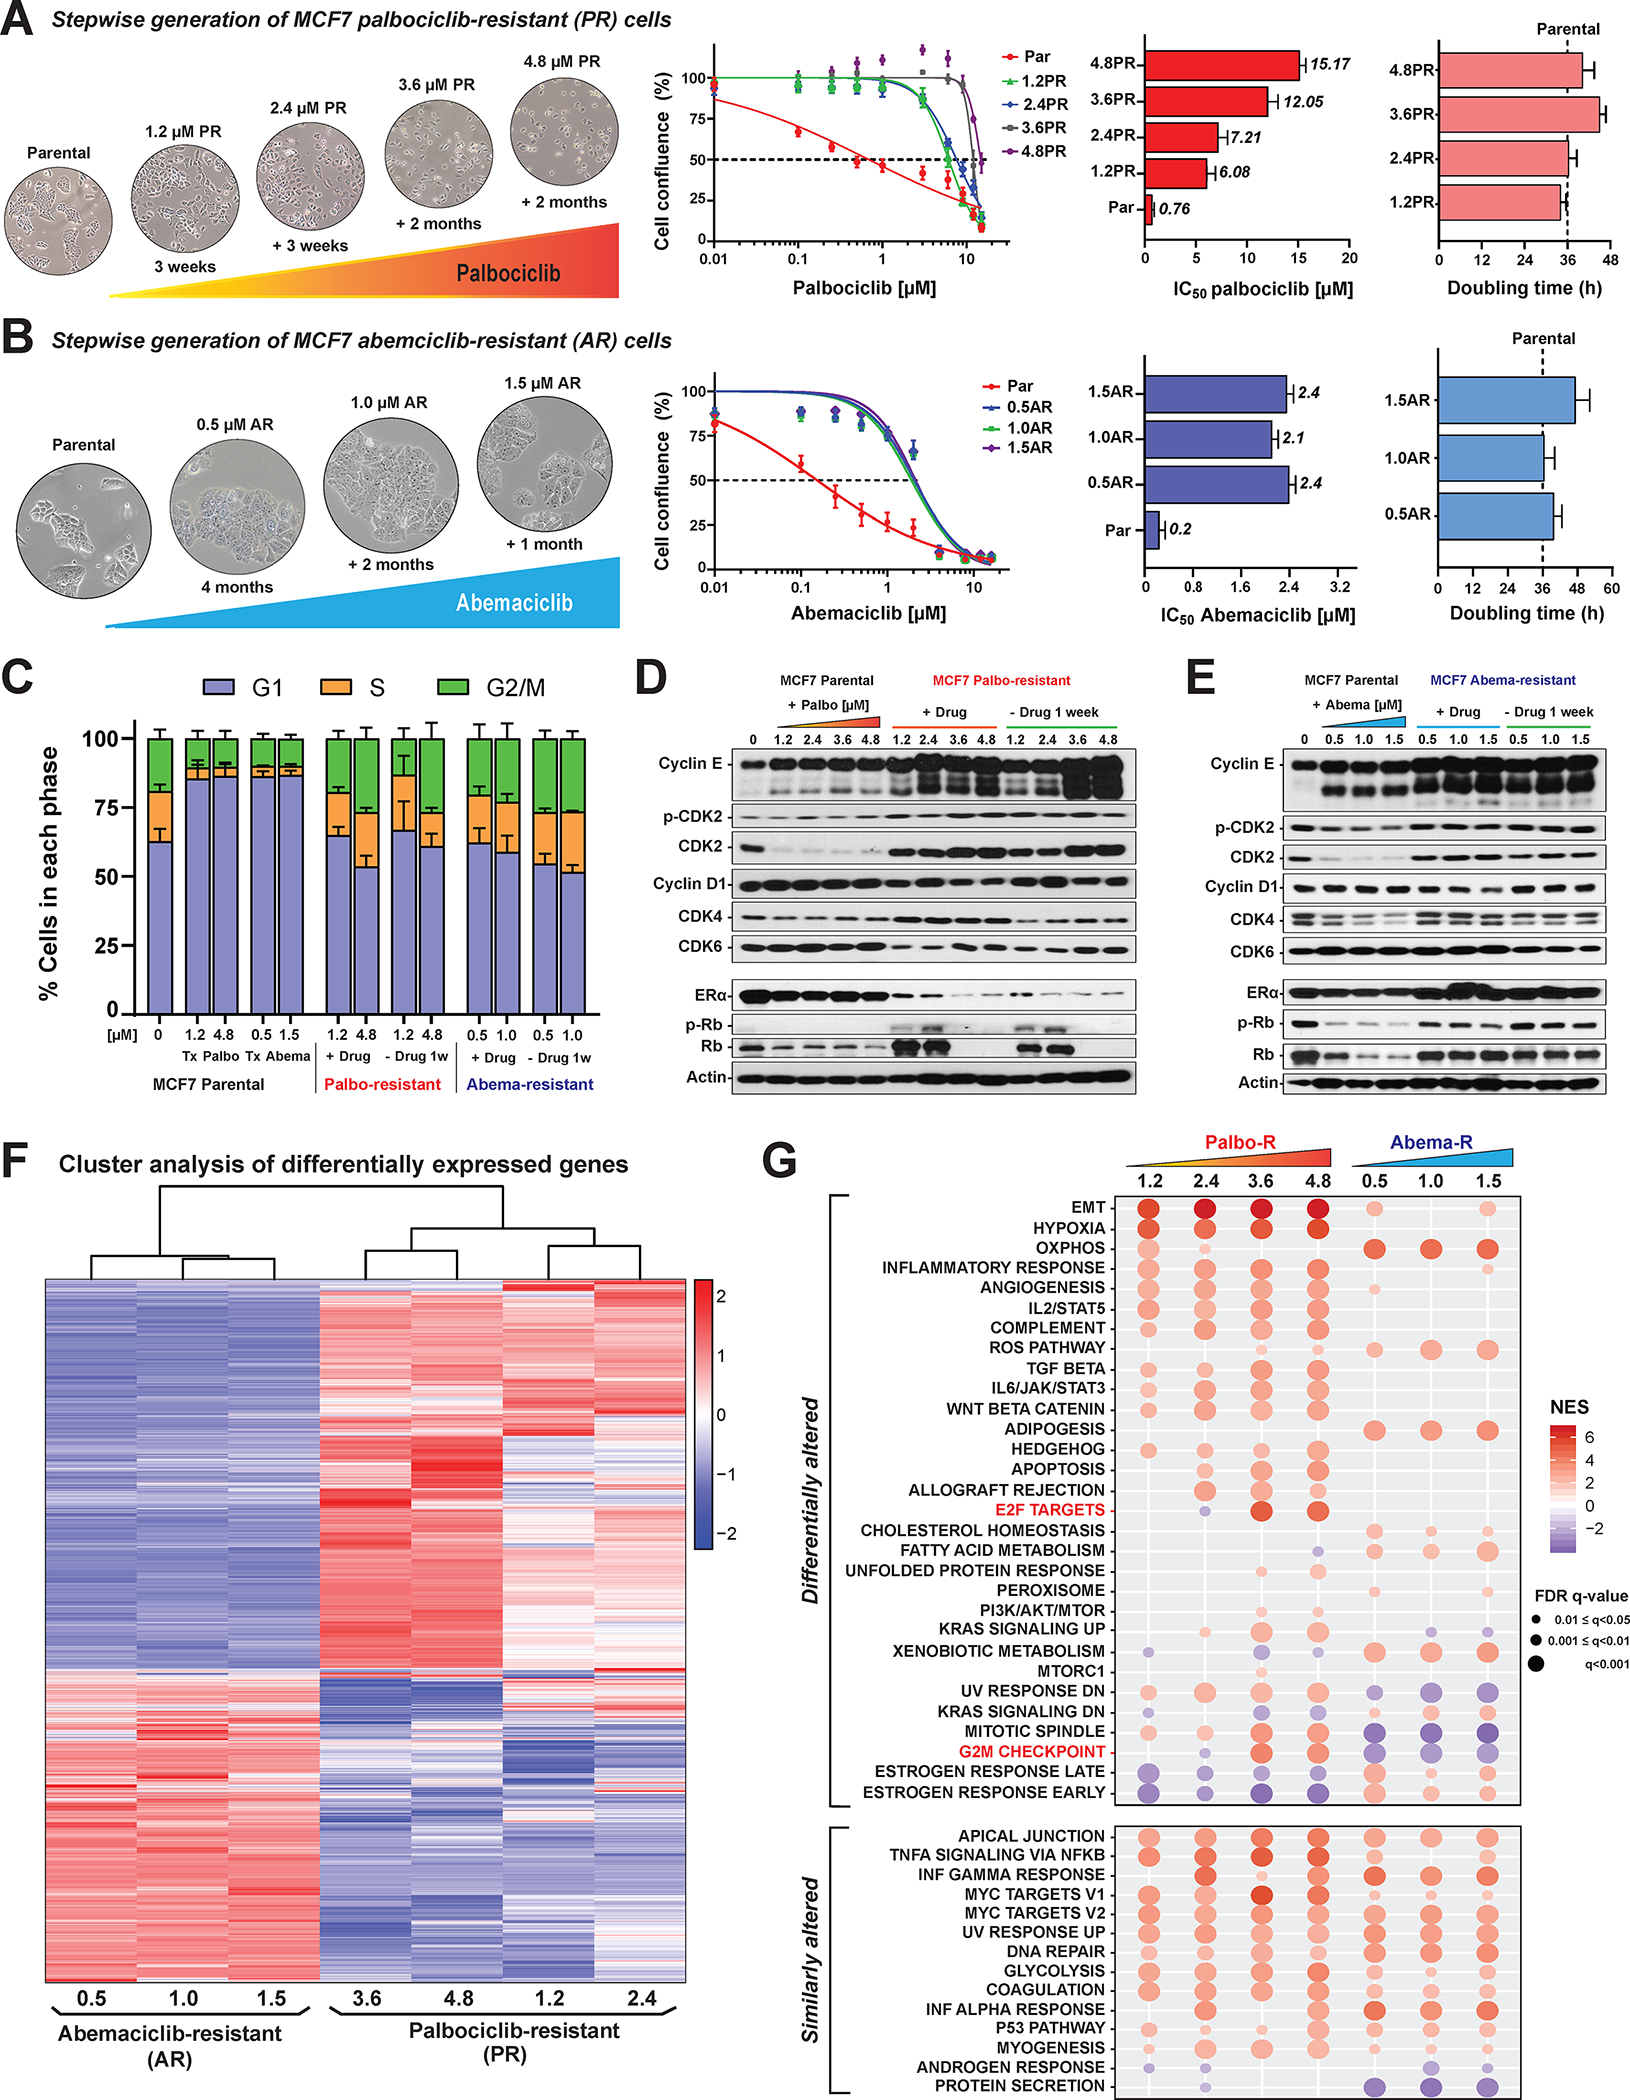
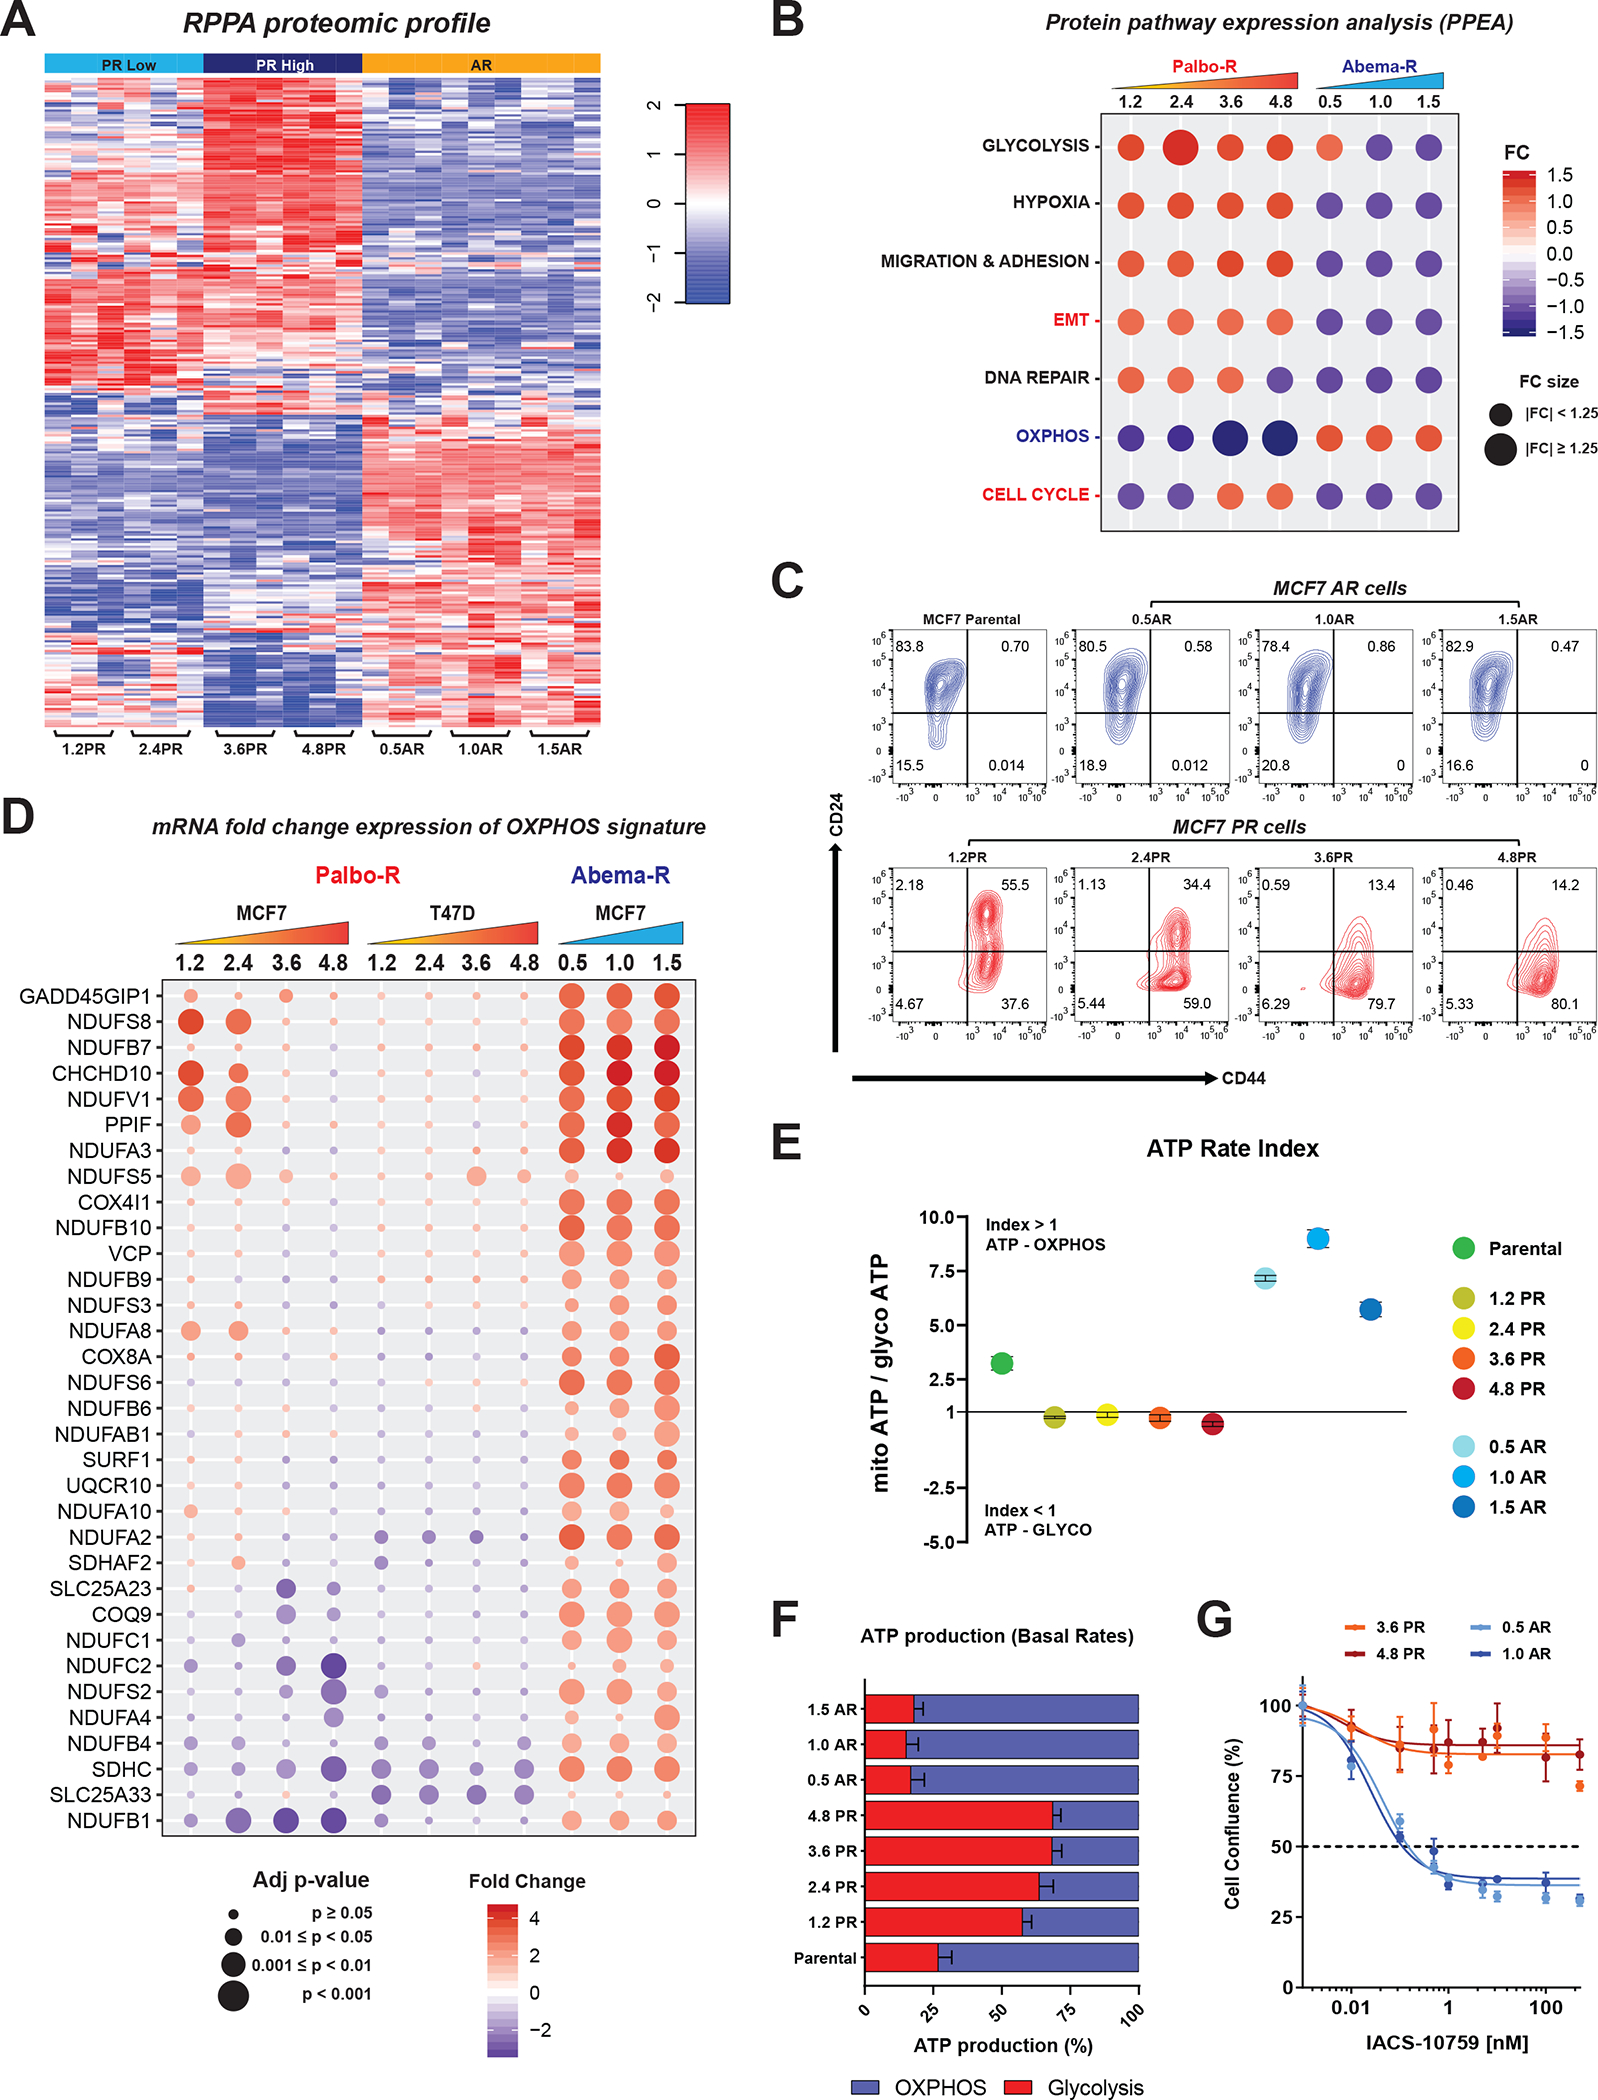
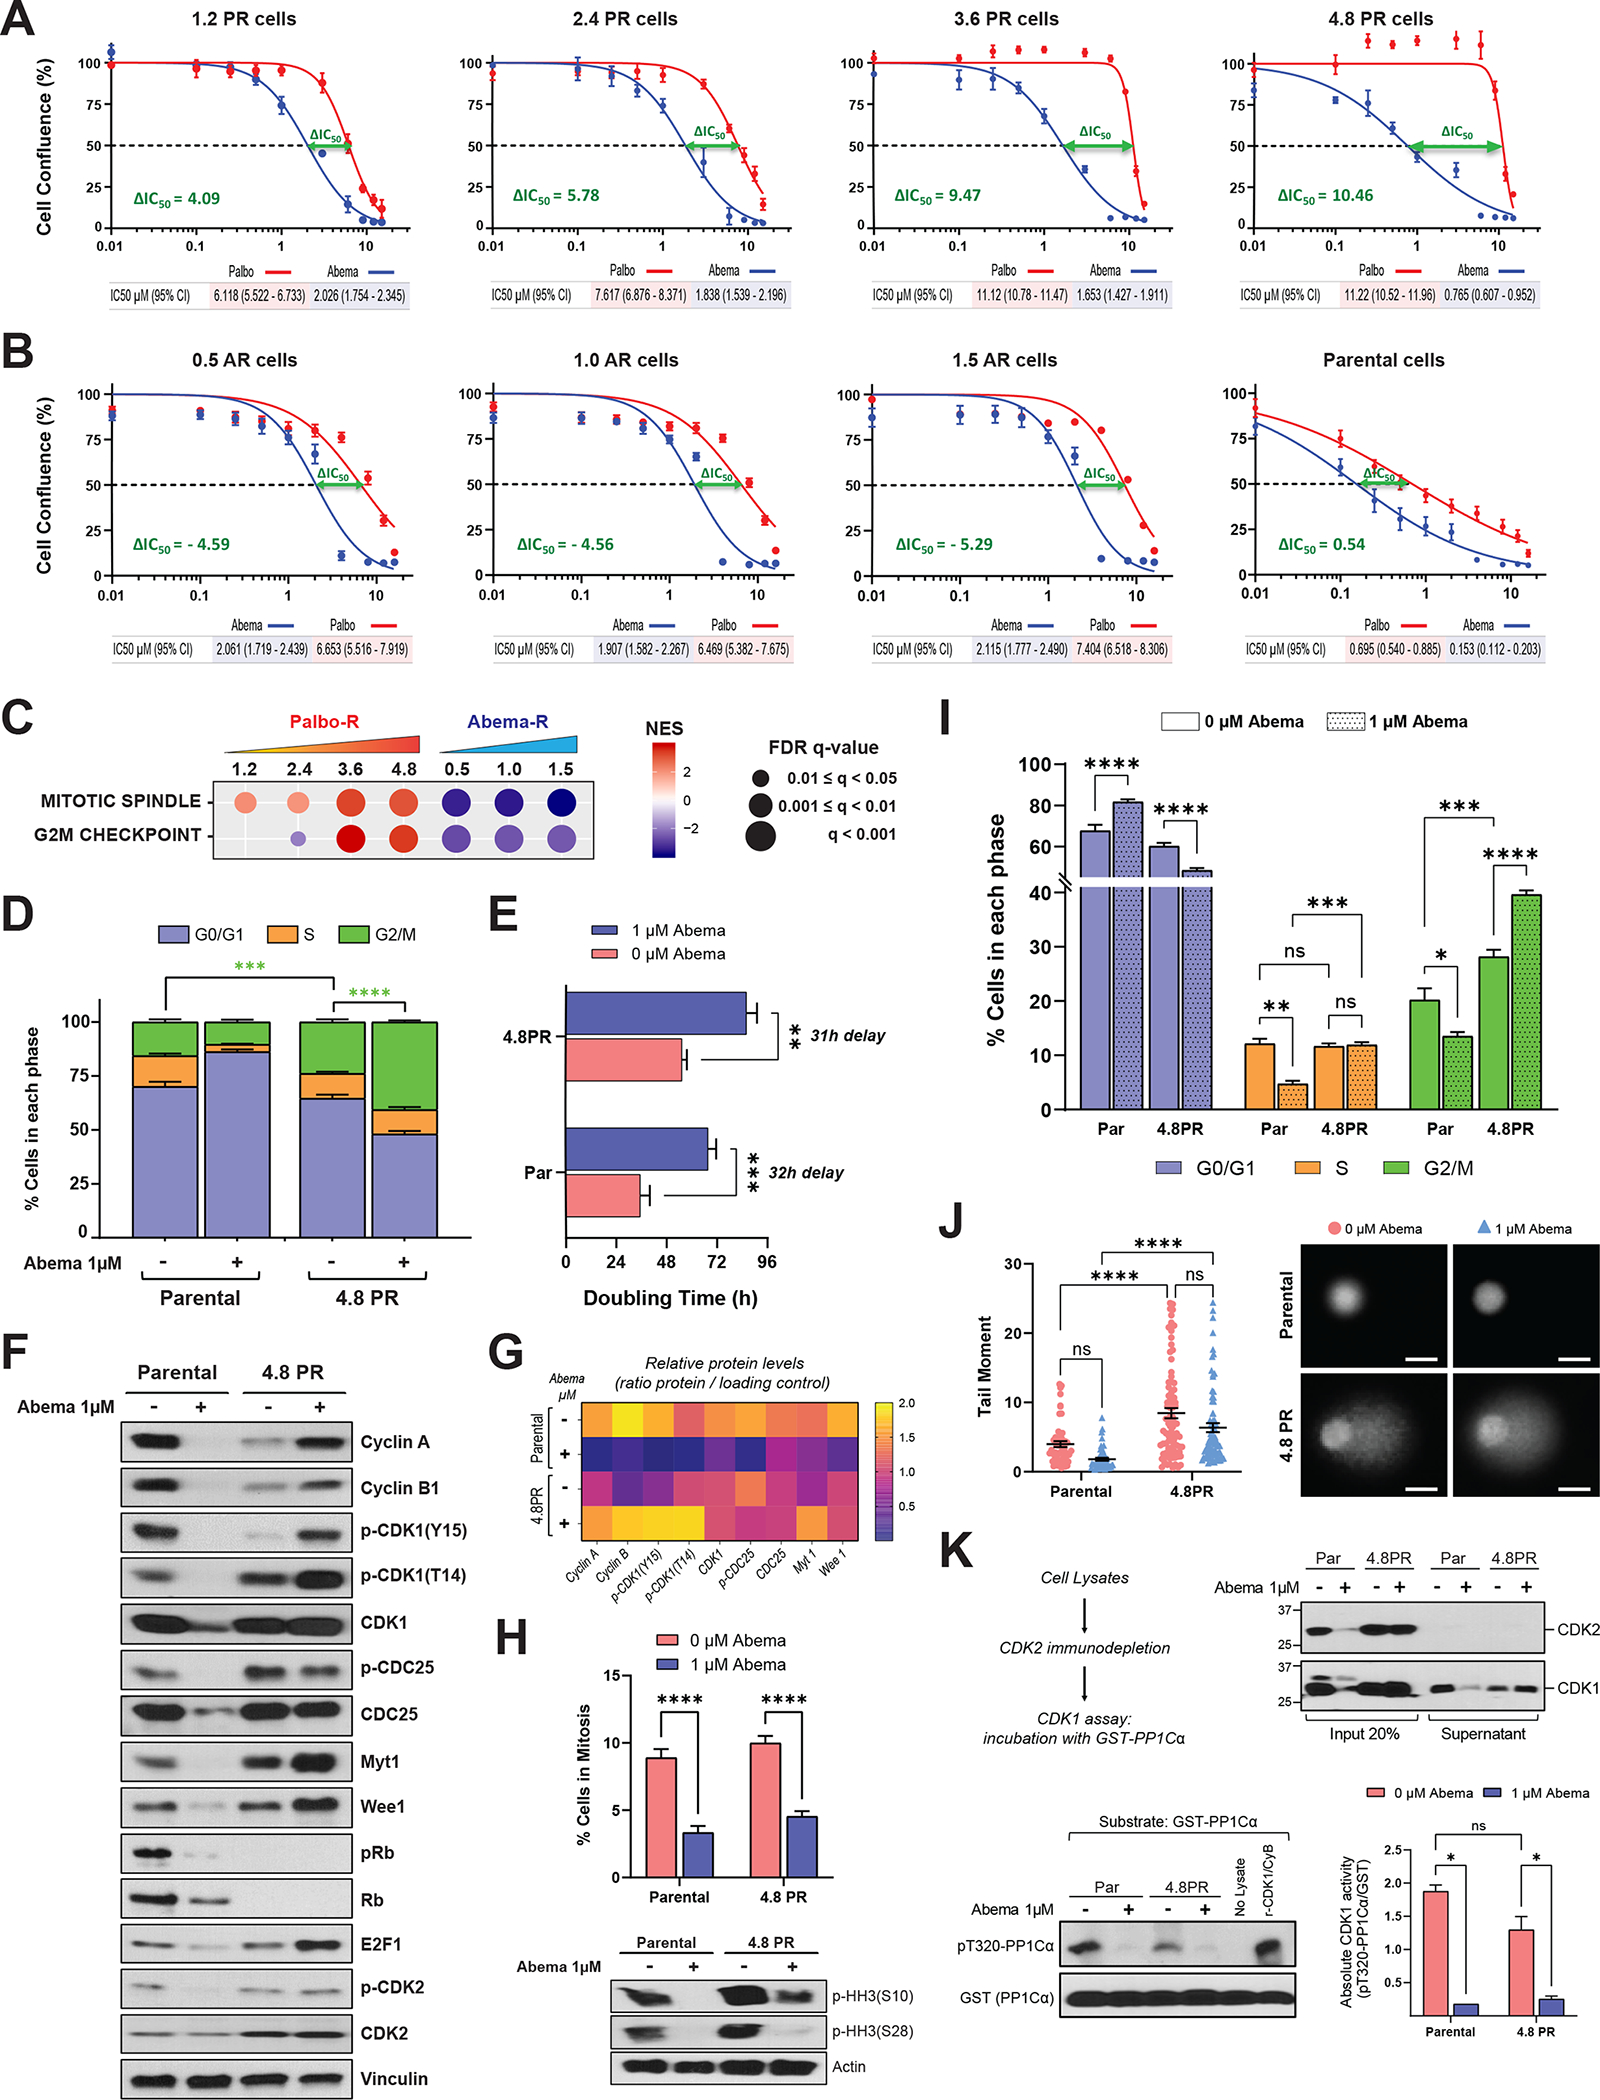
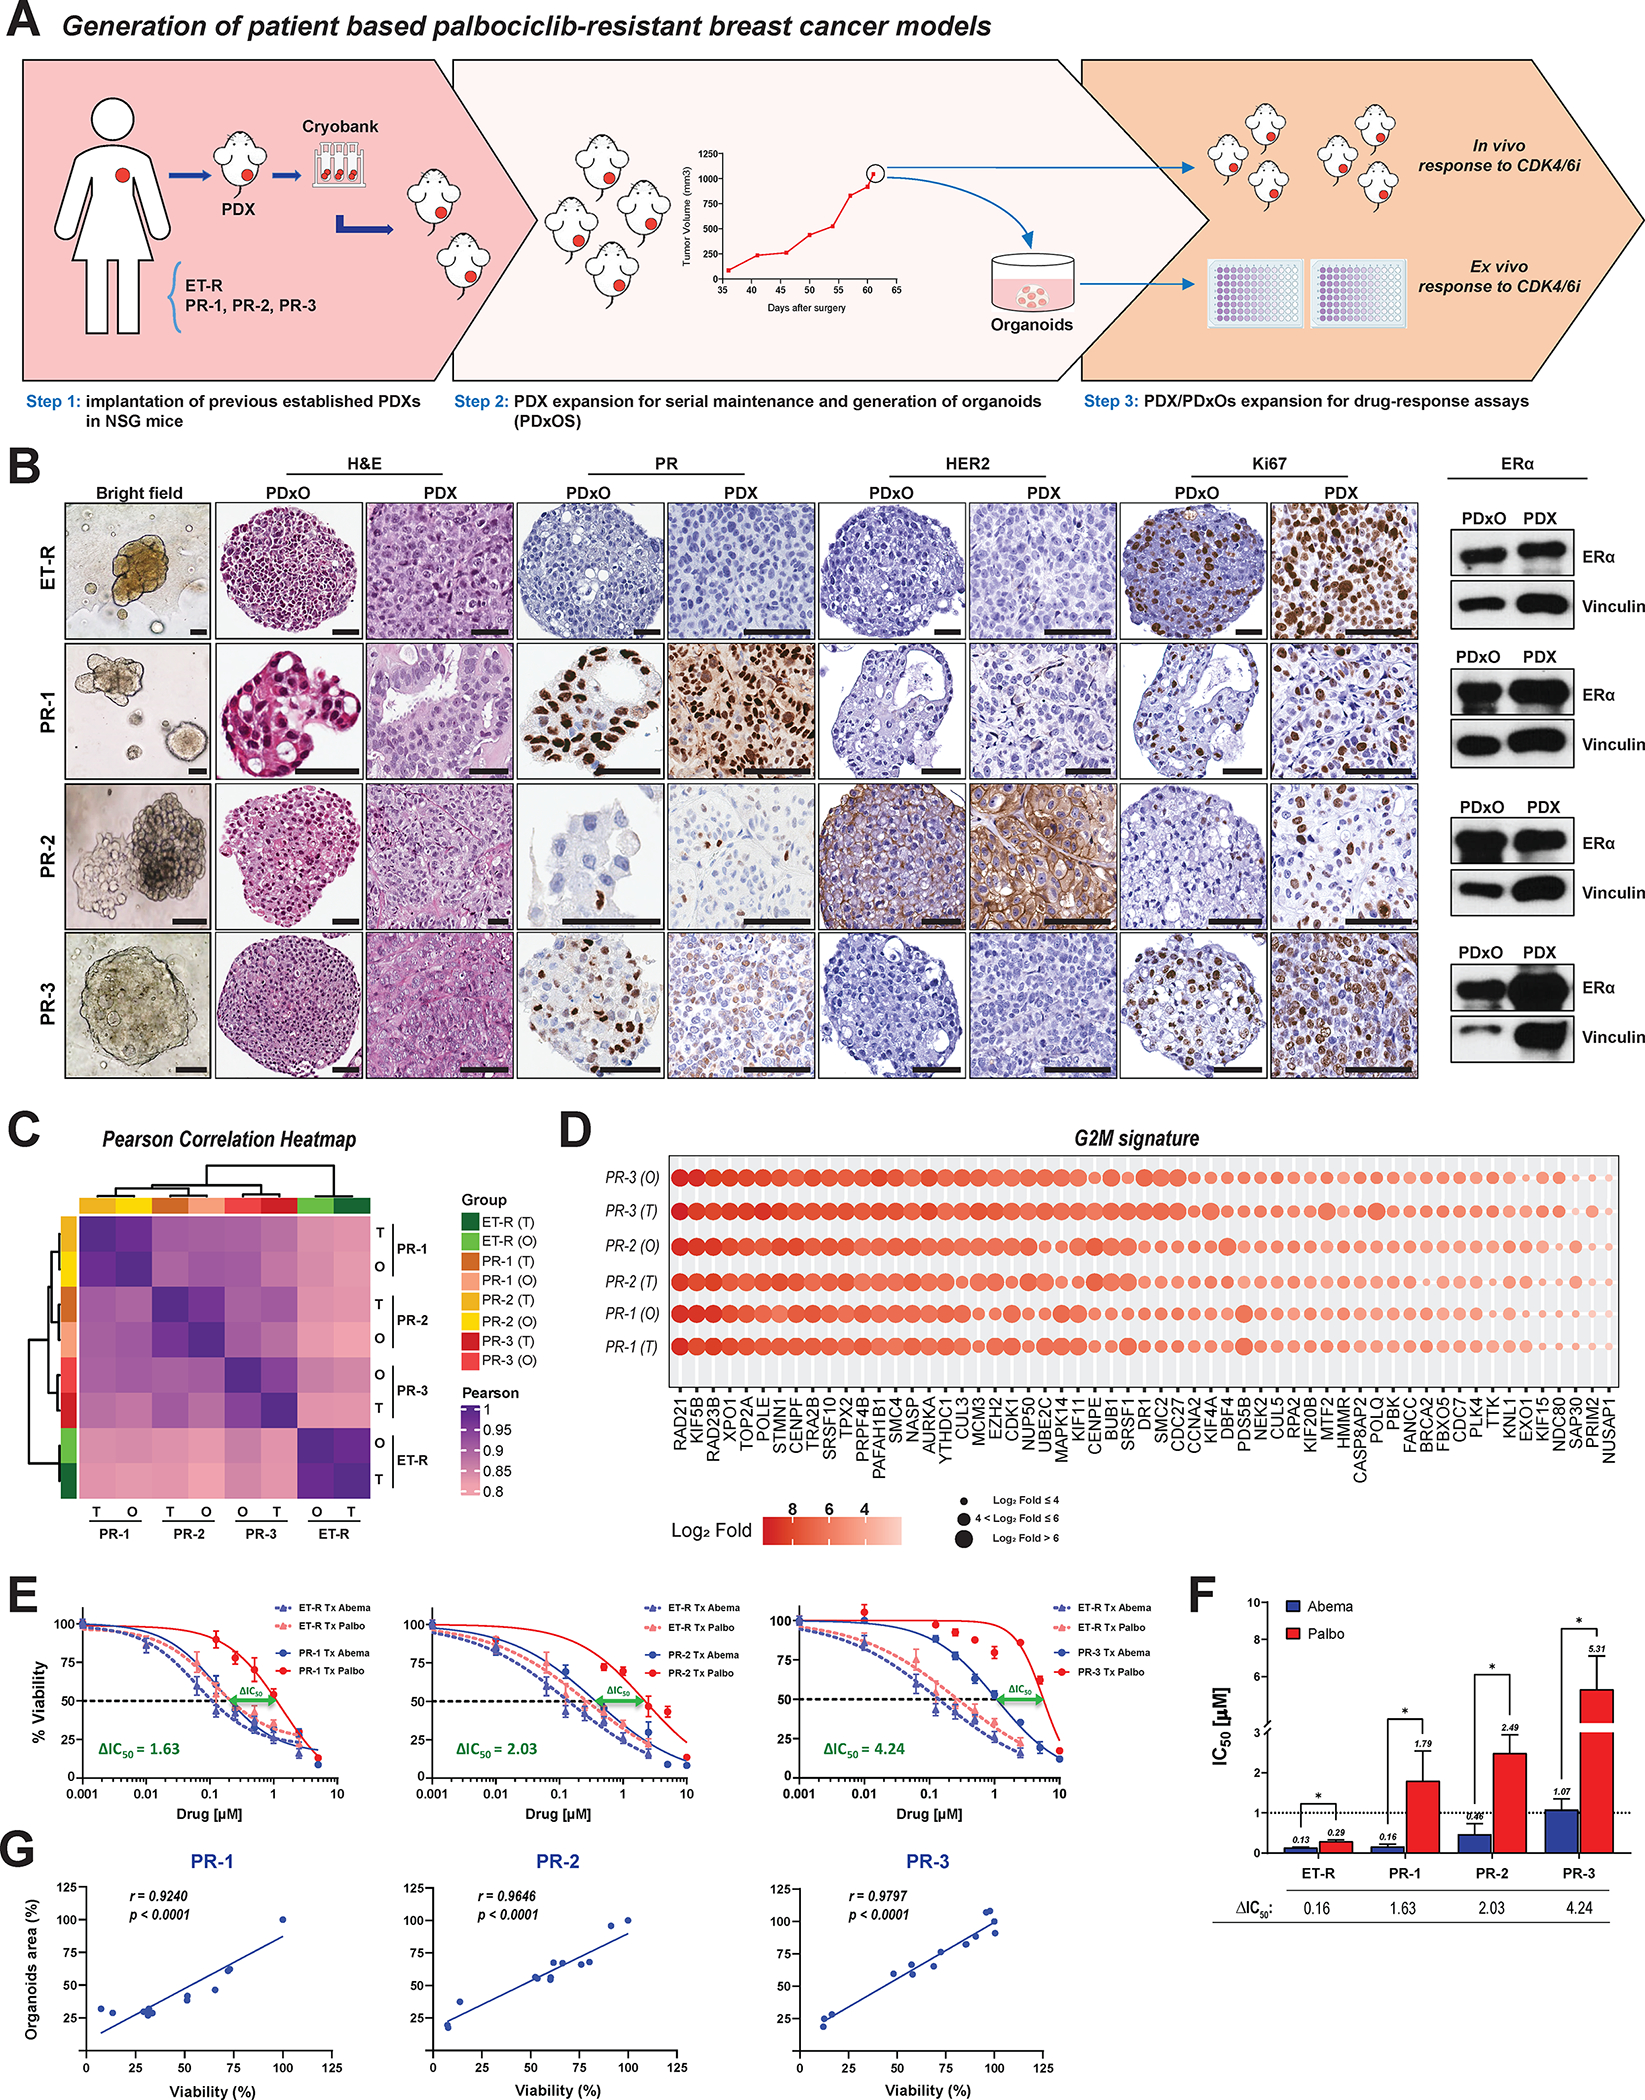
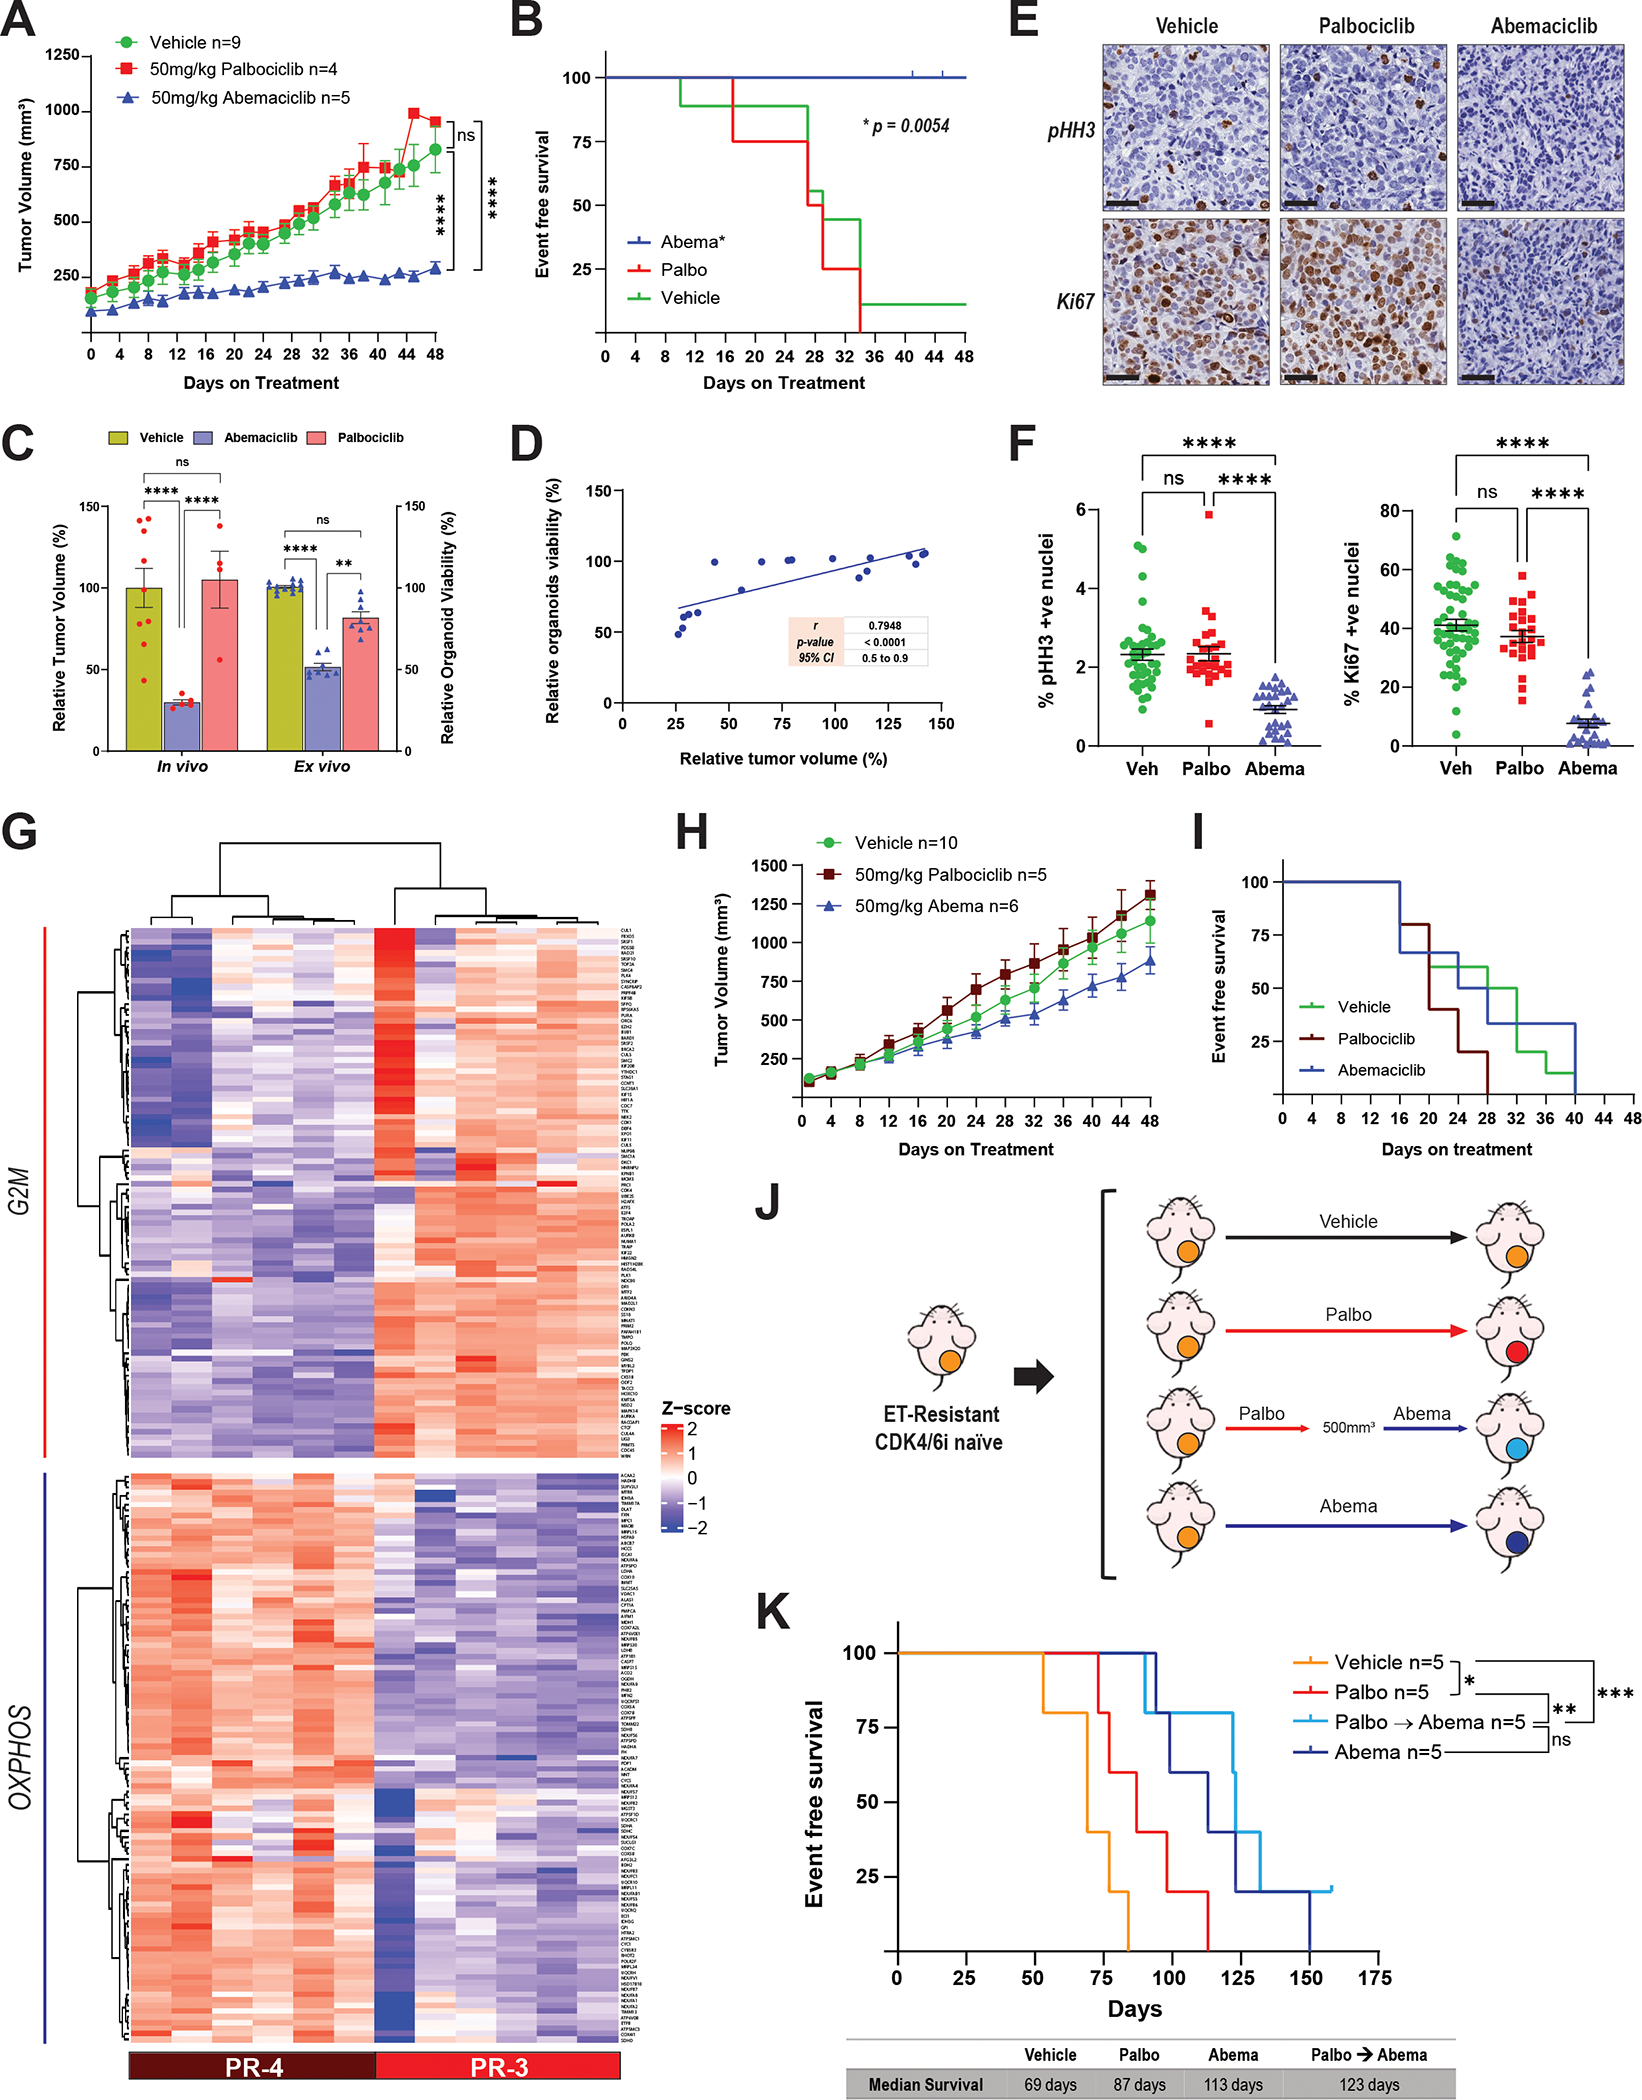
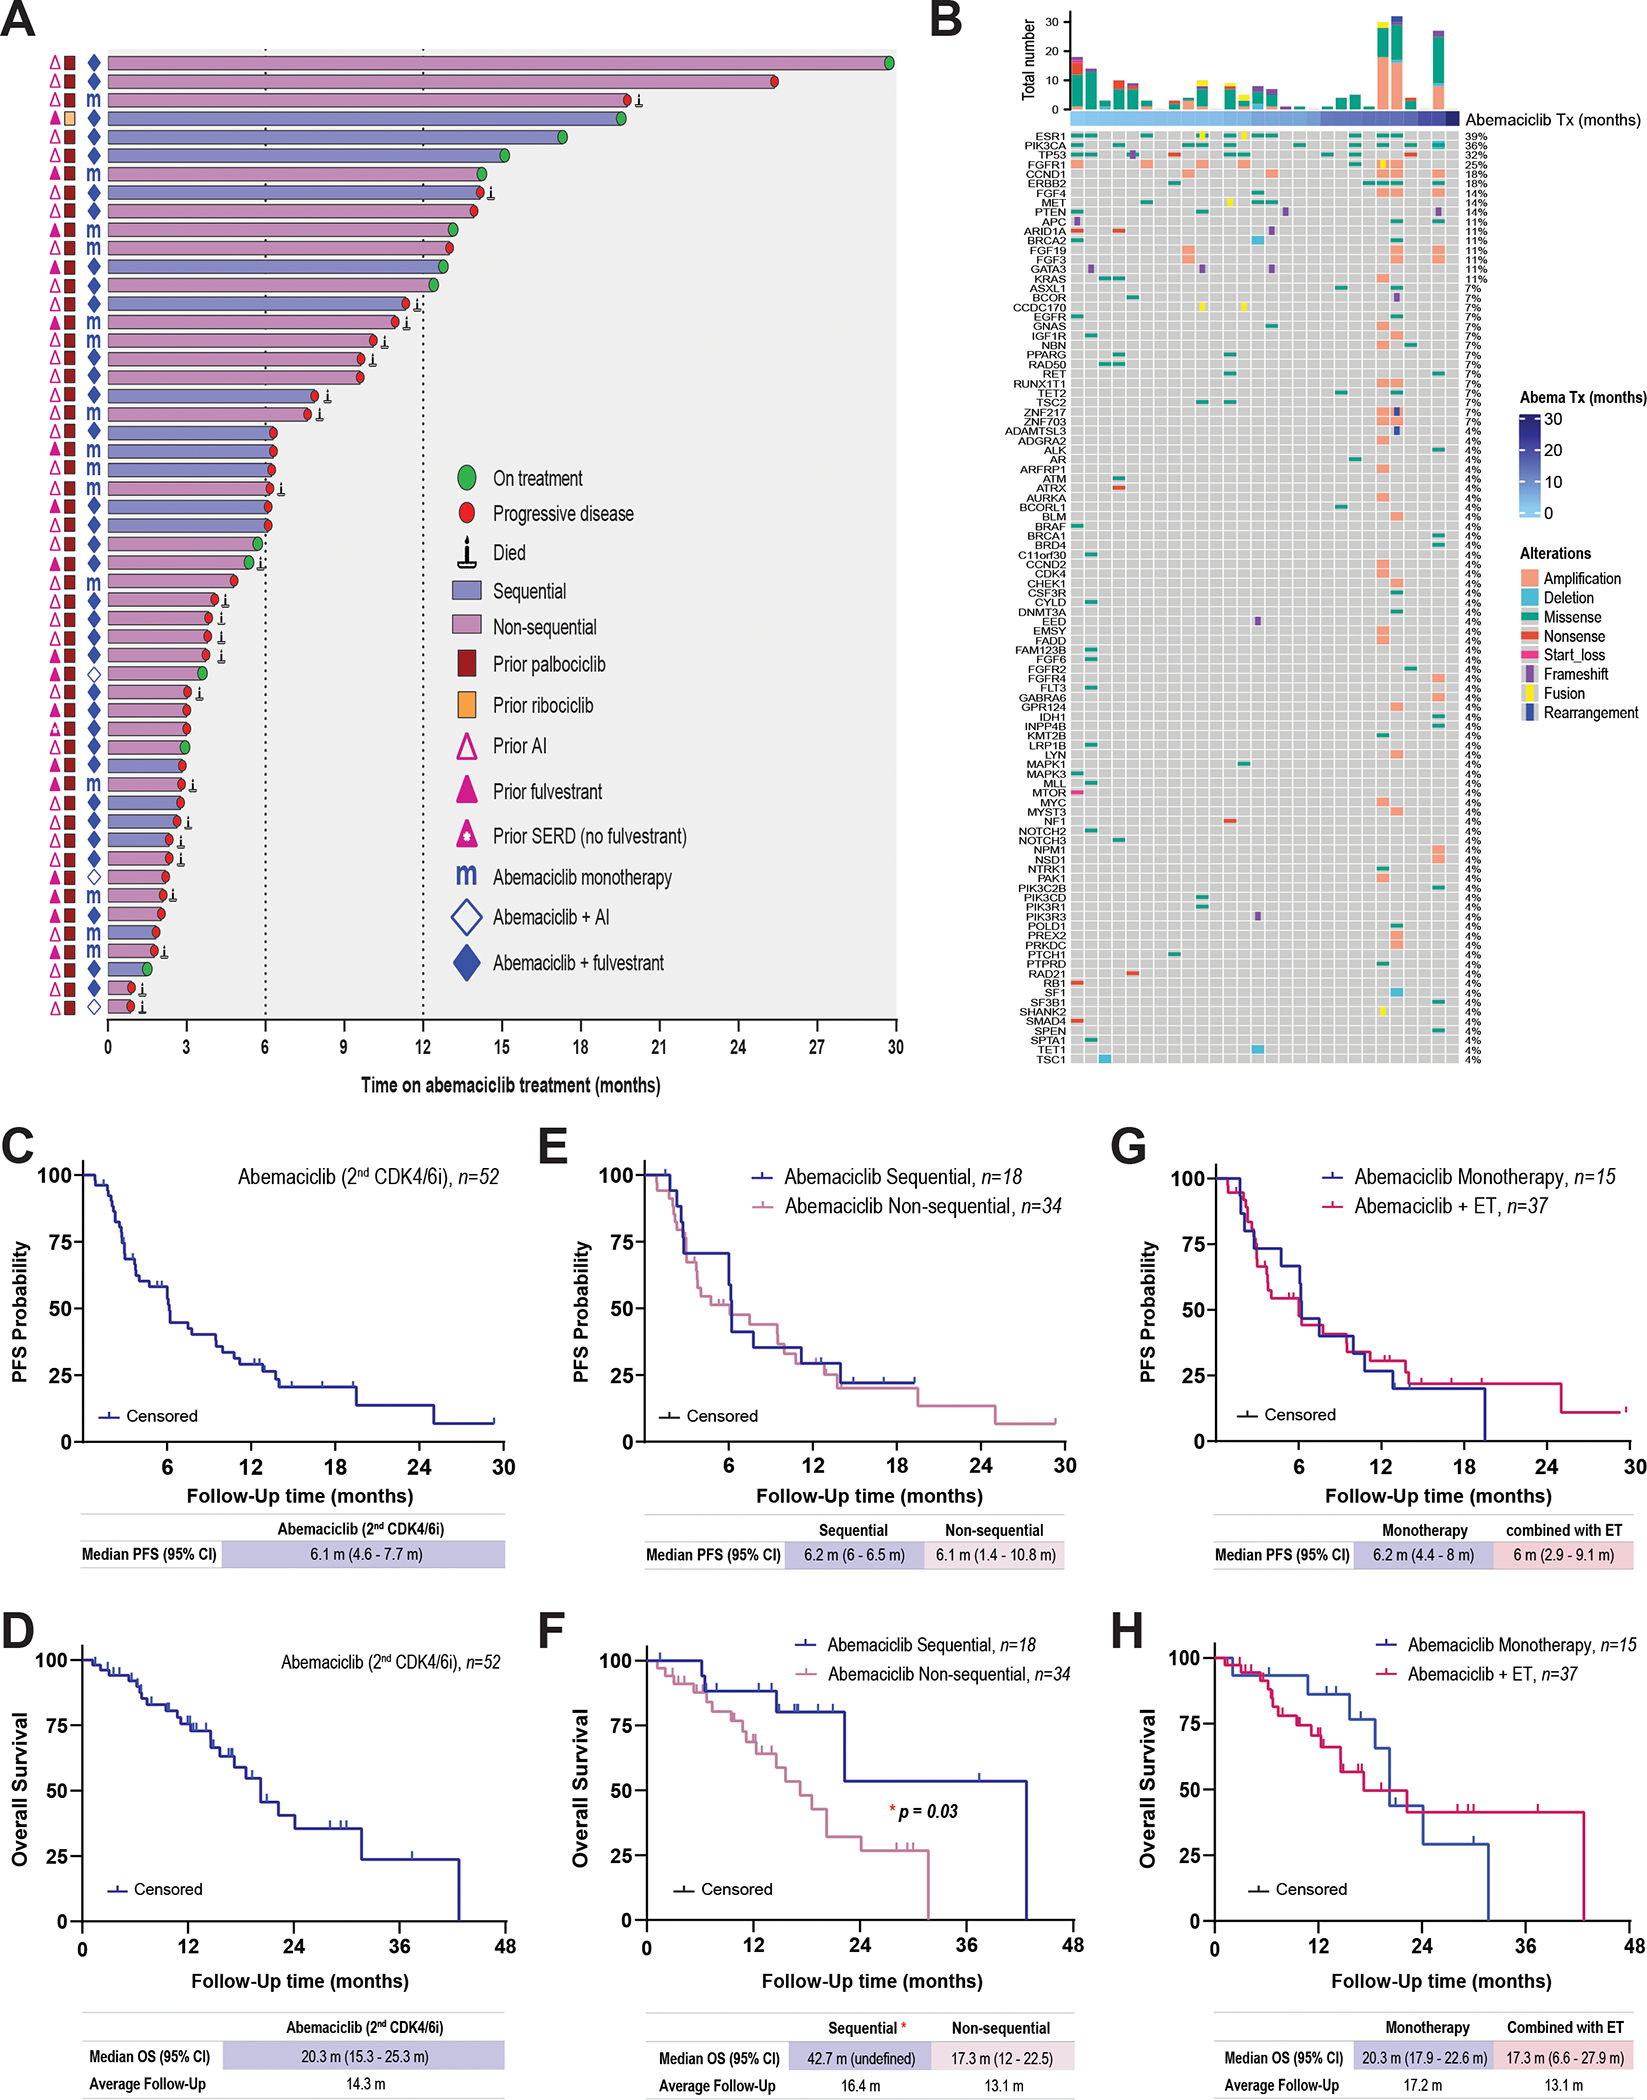
Cyclin-dependent kinases 4/6 inhibitor (CDK4/6i) plus endocrine therapy (ET) is standard of care for patients with hormone receptor (HR)-positive, HER2-negative metastatic breast cancer (MBC). However, resistance to CDK4/6is plus ET remains a clinical problem with limited therapeutic options following disease progression. Different CDK4/6is might have distinct mechanisms of resistance, and therefore using them sequentially or targeting their differentially altered pathways could delay disease progression. To understand pathways leading to resistance to the CDK4/6is palbociclib and abemaciclib, we generated multiple in vitro models of palbociclib-resistant (PR) and abemaciclib-resistant (AR) cell lines as well as in vivo patient-derived xenografts (PDX) and ex vivo PDX-derived organoids (PDxO) from patients who progressed on CDK4/6i. PR and AR breast cancer cells exhibited distinct transcriptomic and proteomic profiles that sensitized them to different classes of inhibitors; PR cells upregulated G2-M pathways and responded to abemaciclib, while AR cells upregulated mediators of the oxidative phosphorylation pathway (OXPHOS) and responded to OXPHOS inhibitors. PDX and organoid models derived from patients with PR breast cancer remained responsive to abemaciclib. Resistance to palbociclib while maintaining sensitivity to abemaciclib was associated with pathway-specific transcriptional activity but was not associated with any individual genetic alterations. Finally, data from a cohort of 52 patients indicated that patients with HR-positive/HER2-negative MBC who progressed on palbociclib-containing regimens can exhibit a meaningful overall clinical benefit from abemaciclib-based therapy when administered after palbociclib. These findings provide the rationale for clinical trials evaluating the benefit of abemaciclib treatment following progression on a prior CDK4/6i.

Significance: Palbociclib-resistant breast cancers respond to abemaciclib and express pathway-specific signatures of sensitivity, providing a biomarker-driven therapeutic option for patients with metastatic breast cancer following disease progression on cyclin-dependent kinases 4/6 inhibitors.


Conflict of interest statement

Conflict of interest:

J. Navarro-Yepes: None.

N.M. Kettner: None.

X. Rao: None.

C.S. Bishop: None

T. Bui: None.

H.F. Wingate: None.

A.S. Raghavendra: None.

Y. Wang: None.

J. Wang: None.

A. Sahin: None.

F. Meric-Bernstam: AbbVie, Aduro BioTech Inc., Aileron Therapeutics Inc., Alkermes, AstraZeneca, Black Diamond, Bayer Healthcare Pharmaceutical, Biovica, Calithera Biosciences Inc., Curis Inc., CytomX Therapeutics Inc., Daiichi Sankyo Co. Ltd., DebioPharm, Ecor1 Capital, eFFECTOR Therapeutics, Eisai, F. Hoffman-La Roche Ltd., FogPharma, GT Apeiron, Genentech Inc., Guardant Health Inc., Harbinger Health, IBM Watson, Immunomedics, Infinity Pharmaceuticals, Inflection Biosciences, Jackson Laboratory, Karyopharm Therapeutics, Kolon Life Science, Klus Pharma, Lengo Therapeutics, Loxo Oncology, Menarini Group, Mersana Therapeutics, Novartis, OnCusp Therapeutics, OrigiMed, PACT Pharma, Parexel International, Pfizer Inc., Protai Bio Ltd, Puma Biotechnology Inc., Samsung Bioepis, Sanofi, Seattle Genetics Inc., Silverback Therapeutics, Spectrum Pharmaceuticals, Taiho Pharmaceutical Co., Takeda Pharmaceutical, Tallac Therapeutics, Tyra Biosciences, Xencor, Zentalis, Zymeworks

K.K. Hunt: Armada Health, AstraZeneca, Cairn Surgical, Eli Lilly & Co, Lumicell.

S. Damodaran: EMD Serono, Guardant Health, Novartis, Pfizer, Sermonix, Taiho.

D. Tripathy: AstraZeneca, GlaxoSmithKline, Gilead, Novartis, OncoPep, Pfizer, Polyphor, Personalis, Puma Biotechnology, Sermonix, Stemline-Menarini.

K. Keyomarsi: Apeiron, BluePrint, REPARE, Schrodinger and Novartis.

Figures

Figure 1.
Figure 1.. PR and AR cells exhibit distinct transcriptomic profiles and differential altered pathways.
A, Left, Schematic representation of the generation of the PR breast cancer cell lines, with representative bright-field images (10× magnification) at each concentration. MCF7 PR cell lines were generated by culturing cells in medium supplemented with increasing concentrations of palbociclib from 1.2 to 4.8 μM in a stepwise manner over a 6-month period. Four cell lines resistant to palbociclib were generated: 1.2PR, 2.4PR, 3.6PR, and 4.8PR. Second from left: Dose-response curves for MCF7 parental and PR cells depicting the effect of treatment with 0.01–16 μM palbociclib for 6 days, followed by 6 days of recovery in drug-free medium. As a readout of cell proliferation, cell confluence (whole well) was assessed using Incucyte. Data were normalized to DMSO (100%), plotted, and analyzed by nonlinear regression using GraphPad Prism 9 software. The dashed line indicates IC50 values. Right graphs: horizontal bar graphs depicting the IC50 values and doubling times of PR cells. Each experiment included eight technical replicates per concentration. Data represent the mean ± SEM; n ≥ 3 independent experiments. B, Schematic representation, dose-response curves, IC50 values, and cell doubling times for MCF7 AR cells. The cells were generated using increasing concentrations of abemaciclib from 0.5 to 1.5 μM in a stepwise manner over a 7-month period. Three resistant cell lines were generated: 0.5AR, 1.0AR, and 1.5AR. Results are presented as described in A. C, Cell cycle analysis comparing the effect of palbociclib or abemaciclib treatment on MCF7 parental cells (first five bars), PR cell lines (middle four bars), and AR cell lines (last four bars), in the continuous presence of their respective drug (+Drug) and after 1 week of drug removal (−Drug 1w). Stacked bars represent the percentage of cells in each cell cycle phase, by color. D and E, Western blot analysis with the indicated antibodies for MCF7 parental and resistant cells under the conditions described in C. F, Heatmap depicting the hierarchical cluster analysis of differentially expressed genes in each MCF7 PR and AR cell line. Data represent the average expression of each gene for each cell line derived from three independent biological replicates. Red denotes genes with high expression levels; blue, genes with low expression levels. The color ranges from red to blue indicates the standardized log2 normalized expression from large to small. G, GSEA of cancer Hallmark gene sets in MCF7 PR and AR cells using the Molecular Signatures Database. Genes were ranked according to the significance (P values) in combination with the sign of log2 fold change values resulting from two-group comparisons (each resistant cell line at each concentration vs parental cells). The GSEA was performed for each comparison between resistant cells at each concentration of PR or AR vs parental cells. FDR (false discovery rate) cutoff of 5% was used to select significant gene sets, which were then compared across all resistant cells to analyze differential alteration between each concentration and each CDK4/6i. The upper dot plot depicts the pathways that showed a differentially altered pattern between PR and AR cells, while the bottom dot plot depicts the pathways that were similarly altered across all the resistant cell lines. The two pathways highlighted in red were downregulated in cells resistant to low concentrations and upregulated in cells resistant to high concentrations of palbociclib. NES, normalized enrichment score.
Figure 2.
Figure 2.. Divergent pathways are activated in PR and AR cells.
A, Heatmap depicting the changes in protein expression levels in PR and AR cells assayed by RPPA. Significant differences were tested with one-way ANOVA and the Tukey’s honest significance test, FDR=0.05. Three replicates for each cell line are shown. RPPA data was generated by the RPPA core facility and analyzed by the Department of Bioinformatics and Computational Biology at MDACC. B, Dot plot depicting the protein pathway enrichment analysis (PPEA) using the RPPA data. The fold change (FC) for each pathway corresponds to the average of the individual fold change values for the proteins that contribute to that pathway. C, Flow cytometry analysis of CD44 and CD24 markers showing the enrichment of the CSCs population (CD44+/high/CD24−/low) in PR and AR cells. Contour plots are representative of at least three independent experiments. D, mRNA fold change expression of an OXPHOS gene signature generated from the literature (see Supplementary Methods) across MCF7 and T47D PR cells and MCF7 AR cells. Fold change gene expression values correspond to the average of three biological replicates per cell line. E, Real-time ATP rate assay in MCF7 parental, PR, and AR cells. The ATP rate index is the ratio of oxygen consumption rate to extracellular acidification rate. A high index value represents a more oxidative, less glycolytic phenotype, and vice versa. Graphed values correspond to one representative experiment. Data represent the mean ± SEM; n = 3 biological replicates. F, Percentage of ATP production from OXPHOS and glycolysis in MCF7 parental, PR, and AR cells. Bars represent the mean ± SEM; n = 3 independent experiments. G, Dose-response curves in MCF7 PR and AR cells depicting the effect of treatment with increasing concentrations of the OXPHOS inhibitor IACS-10759 (0.001–500 nM) for 72 hours. Cell confluence (whole well) was assessed using Incucyte. Data were normalized to DMSO (100%), plotted, and analyzed by nonlinear regression using GraphPad Prism 9 software. The dashed line indicates IC50 values. Data represent the mean ± SEM; n = 4 biological replicates.
Figure 3.
Figure 3.. Abemaciclib induces G2 arrest and overrides entry into mitosis in PR cells.
A and B, Dose-response curves in MCF7 PR (A), AR (B), and parental (B) cells depicting the effect of treatment with increasing concentrations of abemaciclib or palbociclib (0.01–16 μM) for 6 days, followed by 6 days of recovery in drug–free medium. As a readout of cell proliferation, cell confluence (whole well) was assessed using Incucyte. Data were normalized to DMSO (100%), plotted, and analyzed by nonlinear regression using GraphPad Prism 9 software. Each experiment included eight biological replicates per concentration and was repeated at least 3 times. Data represent the mean ± SEM; n ≥ 3 independent experiments. The IC50 values are indicated by the dashed line and specified below each plot including the 95% CI. The difference between the IC50 values for palbociclib and abemaciclib, or ΔIC50, was calculated by subtracting the IC50 of the tested drug from the IC50 of the drug to which the cells were resistant: For PR cells, ΔIC50 = (IC50 palbociclib − IC50 abemaciclib); for AR cells, ΔIC50 = (IC50 abemaciclib − IC50 palbociclib). The ΔIC50 is indicated in each plot. C, GSEA of two cancer hallmark gene sets, mitotic spindle and G2/M, in MCF7 PR and AR cells (see Fig. 1G). FDR, false discovery rate; NES, normalized enrichment score. D, Cell cycle analysis in MCF7 parental and 4.8PR cells comparing the effect of treatment with 1 μM abemaciclib for 6 days. Stacked bars represent the percentage of cells in each cell cycle phase. The difference in the percentages of cells in G2/M phase between the indicated groups was evaluated by two-way ANOVA, Tukey’s multiple comparisons test. *** P = 0.0003; **** P < 0.0001. Data represent the mean ± SEM; n ≥ 4 independent experiments. E, Bar graph depicting the effect of 1 μM abemaciclib treatment for 6 days on the doubling time of MCF7 parental and 4.8PR cells. Cells were counted on day 0 and on day 6, after treatment. The difference between groups was evaluated by two-way ANOVA, Šídák’s multiple comparisons test. ** P = 0.0010; *** P = 0.0004. Data represent the mean ± SEM; n ≥ 4 independent experiments. F, Western blot analysis of the indicated proteins in MCF7 parental and 4.8PR cells treated with 1 μM abemaciclib for 6 days. G, Densitometry analysis for the western blots in F showing the average protein levels (ratio for each protein/loading control) of three independent experiments. H, Top: Percentage of MCF7 parental and 4.8PR cells in mitosis after treatment with 1 μM abemaciclib for 6 days evaluated by flow cytometry. The percentage of cells in mitosis was determined by quantitation of histone H3 phosphorylated at S28 (pHH3-S28) in parallel with DNA content (propidium iodide) to evaluate the cell cycle. Percentage of cells in mitosis = (cells in mitosis / cells in G2/M) × 100. The difference between groups was evaluated by two-way ANOVA, Dunnett’s multiple comparisons test. **** P ≤ 0.0001. Bottom: Western blot analysis of pHH3 (phosphorylated at S28 and S10) using cell lysates from two independent representative experiments with MCF7 parental and 4.8PR cells treated under the same conditions. I, Percentages of cells gated in each cell cycle phase according to the DNA content (measured by propidium iodide) from the experiments in H. Multiple comparisons were evaluated by two-way ANOVA, Tukey’s multiple comparisons test. * P = 0.0139; ** P = 0.0052; *** P ≤ 0.0007; **** P ≤ 0.0001; ns: not significant. Data represent the mean ± SEM; n ≥ 4 independent experiments. Cell cycle experiments in I are independent from those in D. J, DNA damage in MCF7 parental and 4.8PR cells upon 1μM abemaciclib treatment for 6 days evaluated by comet assay. Representative images of different conditions are shown. Images were captured using 20× magnification. Bars = 25 μm. Cells were scored using the Comet Assay Software Project (CASP) tool; 50–100 cells were scored per condition per independent experiment. Each experiment included two biological replicates per concentration and was repeated twice. Data are representative of one independent experiment and depict the tail moment mean ± SEM. Tail moment = percentage of DNA in the tail × tail length. The difference between groups was evaluated by two-way ANOVA, Šídák’s multiple comparisons test. **** P ≤ 0.0001; ns: not significant. K, In vitro CDK1 kinase activity measured by quantitation of the phosphorylation levels on T320 of the substrate protein phosphatase 1Cα (pT320-PP1Cα). Top left: Experimental flow chart. Top right: Western blot analysis with both CDK2 and CDK1 antibodies showing the presence of CDK1 after immunodepletion of CDK2. Bottom left: CDK2-immunodepleted lysates were incubated with recombinant GST-PP1Cα and assayed for pT320-PP1Cα by western blot analysis. Recombinant CDK1/cyclin B (CyB) complex was used as a positive control. Bottom right: Bar graph shows absolute in vitro CDK1 activity quantified as the ratio of pT320-PP1Cα to GST from two independent experiments. Densitometry analysis was performed using ImageJ software. The difference between groups was evaluated by two-way ANOVA, Tukey’s multiple comparisons test. * P < 0.05; ns: not significant.
Figure 4.
Figure 4.. Patient-derived palbociclib resistant breast cancer models retain abemaciclib sensitivity.
A, Schema for establishing human PDXs and long-term organoid cultures from PDXs (PDxOs). See Supplementary Fig. S8A for additional details on the PDX models. B, Morphological and histological characterization of matched PDxOs and PDXs. First column: Bright-field images (20× magnification) from the four PDxO models depicting the organoid phenotypes. ET-R and PR-3 had cohesive, dense/solid organoids; PR-1 had cohesive organoids, with a mix of cystic/hollow and dense/solid organoids; and PR-2 had discohesive organoids. Second and third columns: H&E staining comparing the histopathological features of PDxOs and their matched PDXs. PDxOs show a tissue architecture/organization reminiscent of the original PDX lesions, high-grade adenocarcinoma. ET-R, PR-1, and PR-2 exhibited some areas forming tubular gland structures, while PR-3 exhibited marked nuclear atypia and mitotic activity with no glandular/tubular differentiation. Fourth to ninth columns and ERα column: IHC staining for progesterone receptor (PgR), HER2, and Ki67 and western blot analysis of ERα showing the concordance of the hormone receptor status and proliferation status of the PDX/PDxO pairs with the originating patient tumors (details in Supplementary Fig. S8A). Scale bars: 50μm. C, Hierarchical clustering correlation heatmap illustrating transcriptome fidelity between PDX tumors (T) and their derived organoids (O). The color scale within the heatmap indicates the Pearson correlation coefficient. Hierarchical clustering on the top and left side depicts the distance between models. D, G2/M gene signature expression in PR PDX tumors (T) and their derived PDxOs (O). Color scale indicates the extent of gene expression levels (on log2 scale). E, Dose-response curves for PDxO models depicting the effect of treatment with 0.001–10 μM concentrations of abemaciclib or palbociclib for 6 days, followed by 6 days of recovery in drug-free medium. Organoid viability was assessed by Cell Titer-Blue assay. Data were normalized to DMSO (100%), plotted, and analyzed by nonlinear regression using GraphPad Prism 9 software. The dashed lines indicate IC50 values. The difference between the IC50 values for palbociclib and abemaciclib treatment, or ΔIC50, was calculated as IC50 palbociclib – IC50 abemaciclib. Each experiment included three biological replicates per concentration. Data represent the mean ± SEM; n ≥ 3 independent experiments. F, Bar graph summarizing differences in IC50 values for each PDxO model. G, Pearson correlation between the PDxO drug response assessed by Cell Titer-Blue viability assay and by measuring the organoid area.
Figure 5.
Figure 5.. Abemaciclib inhibits tumor growth and prolongs survival after progression on palbociclib therapy.
A, Tumor growth curves of female nude mice bearing the PR-3 PDX model and treated with abemaciclib (50 mg/kg PO, every day), palbociclib (50 mg/kg PO, 21-day cycle), or vehicle for 48 days. Before treatment, tumors were allowed to grow until they reached a volume of 100–200 mm3 in the presence of E2 (8 μg/mL) supplementation in the drinking water. Once treatment started, the E2 supplementation was removed to mimic the effect of ET. The length and width of tumor xenografts were measured by calipers 2–3 times per week, and the tumor volume was calculated as (length × (width)2)/2. All tumors were collected at the same time and processed for biomarker analysis. The differences between groups were evaluated by two-way ANOVA, Tukey’s multiple comparisons test. **** P ≤ 0.0001; ns: not significant. Data represent the tumor volume mean ± SEM; n = 9 mice for vehicle, n = 4 mice for palbociclib, n = 5 mice for abemaciclib. B, Survival analysis of female nude mice bearing the PR-3 PDX model and treated as described in A. Event-free survival was calculated based on the time on treatment when tumor volume reached 500 mm3. The difference between survival curves was calculated using the log-rank (Mantel-Cox) test. C, Comparison of the response to abemaciclib and palbociclib treatment in the PR-3 PDX model (in vivo) and its matched organoids (ex vivo). Relative tumor volume (%) was calculated from the experiment shown in A, and relative organoid viability (%) was calculated from the experiments shown in Fig. 4E. The difference between groups was evaluated by two-way ANOVA, Tukey’s multiple comparisons test. ** P ≤ 0.0085; **** P ≤ 0.0001; ns: not significant. D, Pearson correlation between the tumor volume and the organoid viability from experiments in A and Fig. 4E, respectively. E and F, pHH3 and Ki67 immunohistochemistry analysis of PR-3 PDX tumor tissues from the experiment shown in A. Representative images (40× magnification, Scale bars: 50μm) are shown in E. Quantification of Ki67- and pHH3-positive nuclei was performed using QuPath software (and independently by a pathologist) by assessing multiple areas in each individual tumor for each treatment to cover the entire tumor, and data are presented as mean ± SEM. The difference between groups was evaluated by two-way ANOVA, Tukey’s multiple comparisons test. **** P ≤ 0.0001; ns: not significant. G, Hierarchical clustering heatmap depicting the leading-edge gene expression of G2/M and OXPHOS pathways in PR-3 (n = 6 mice) compared to PR-4 (n = 6 mice) models. H, Tumor growth curves of female nude mice bearing the PR-4 PDX model and treated as described in A. The difference between groups was evaluated by two-way ANOVA, Tukey’s multiple comparisons test; no significant differences were observed. Data represent the tumor volume mean ± SEM; n = 10 mice for vehicle, n = 5 mice for palbociclib, n = 6 mice for abemaciclib. I, Survival analysis of female nude mice bearing the PR-4 PDX model and treated as described in A. Event-free survival was calculated based on the time on treatment when tumor volume reached 500 mm3. The difference between survival curves was calculated using the log-rank (Mantel-Cox) test. No significant differences were observed. J, Preclinical experimental design to assess the response to abemaciclib following lack of response to palbociclib in an endocrine therapy–resistant (ET-R) and CDK4/6i-naive PDX model. Female nude mice bearing the ET-R PDX model were randomized into four arms as indicated and treated with vehicle; palbociclib (75 mg/kg PO, 21-day cycle); palbociclib as the first CDK4/6i followed by sequential treatment with abemaciclib once the tumors reached 500 mm3; or abemaciclib (50 mg/kg PO, every day). E2 supplementation was given as described in A. K, Survival analysis of mice treated as described in J. Event-free survival was calculated based on the duration of treatment prior to the tumor burden reaching the ethical endpoint. The difference between survival curves was calculated using the log-rank (Mantel-Cox) test. * P ≤ 0.05; ** P ≤ 0.01; *** P ≤ 0.001; ns: not significant.
Figure 6.
Figure 6.. Clinical outcomes in patients with HR+/HER2-negative metastatic breast cancer treated with abemaciclib after progression on prior CDK4/6i treatment.
A, Swimmer plot depicting the prior CDK4/6i treatment course, duration of abemaciclib-based therapy, and subsequent clinical outcome. From left to right: pink triangles represent prior ET. Red and yellow squares represent the initial CDK4/6i agent received. Blue “m” and diamonds represent the abemaciclib treatment regimen received after progression on the first CDK4/6i: blue “m”, monotherapy; blue diamonds, combinations with ET. The bars indicate the abemaciclib treatment sequence after the prior CDK4/6i: blue, sequential; purple, non-sequential. The symbols at the ends of the bars represent the clinical outcome on abemaciclib treatment: green circle, still receiving abemaciclib treatment at data cutoff in December 2022; red circle, disease progressed; candle, patient died. B. Distribution of alterations on the gene panel of the patient baseline biopsies (n = 28). Oncoprint plot shows all the genes of interest sorted by mutation frequency form high to low (see supplemental Materials and Methods). The percentage of samples with any gene alteration is indicated on the right side. Each column represents a patient sample. Samples are ordered by abemaciclib treatment time in months. Total number of alterations for each sample is indicated in the bar plot on the top. Colors and shapes refer to different variant types. C and D, Kaplan–Meier analysis of PFS (C) and OS (D) in patients receiving abemaciclib therapy after prior disease progression on palbociclib or ribociclib. E and F, PFS (E) and OS (F) in patients stratified based on whether they received abemaciclib treatment sequentially or non-sequentially after the prior CDK4/6i. G and H, PFS (G) and OS (H) in patients stratified based on whether they received abemaciclib as monotherapy or combined with ET. Survival curves were compared using the log-rank (Mantel-Cox) test.

Comment in

References

    1. Noone AM, Cronin KA, Altekruse SF, Howlader N, Lewis DR, Petkov VI, et al. Cancer Incidence and Survival Trends by Subtype Using Data from the Surveillance Epidemiology and End Results Program, 1992–2013. Cancer Epidemiol Biomarkers Prev 2017;26:632–41 - PMC - PubMed
    1. Mariotto AB, Etzioni R, Hurlbert M, Penberthy L, Mayer M. Estimation of the Number of Women Living with Metastatic Breast Cancer in the United States. Cancer Epidemiol Biomarkers Prev 2017;26:809–15 - PMC - PubMed
    1. Baselga J, Campone M, Piccart M, Burris HA, 3rd, Rugo HS, Sahmoud T, et al. Everolimus in postmenopausal hormone-receptor-positive advanced breast cancer. N Engl J Med 2012;366:520–9 - PMC - PubMed
    1. Andre F, Ciruelos E, Rubovszky G, Campone M, Loibl S, Rugo HS, et al. Alpelisib for PIK3CA-Mutated, Hormone Receptor-Positive Advanced Breast Cancer. N Engl J Med 2019;380:1929–40 - PubMed
    1. Cristofanilli M, Turner NC, Bondarenko I, Ro J, Im SA, Masuda N, et al. Fulvestrant plus palbociclib versus fulvestrant plus placebo for treatment of hormone-receptor-positive, HER2-negative metastatic breast cancer that progressed on previous endocrine therapy (PALOMA-3): final analysis of the multicentre, double-blind, phase 3 randomised controlled trial. Lancet Oncol 2016;17:425–39 - PubMed

Publication types

MeSH terms