. 2023 Jul 14;137(13):995-1011.
doi: 10.1042/CS20230413.

Absence of gut microbiota reduces neonatal survival and exacerbates liver disease in Cyp2c70-deficient mice with a human-like bile acid composition

Affiliations

Absence of gut microbiota reduces neonatal survival and exacerbates liver disease in Cyp2c70-deficient mice with a human-like bile acid composition

Wilhelm Sjöland et al. Clin Sci (Lond). .

Abstract

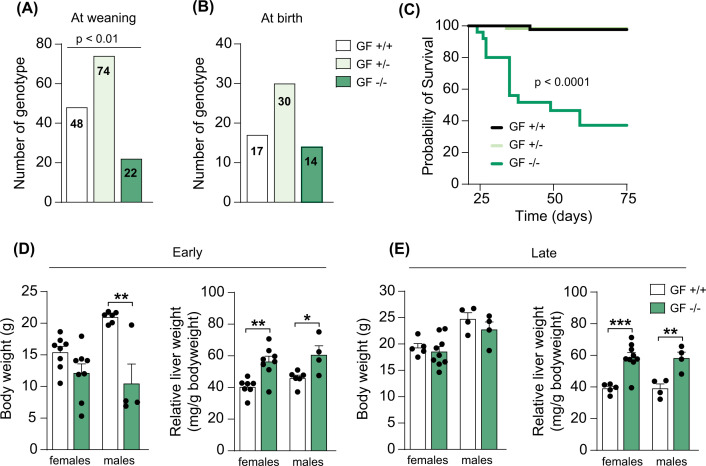
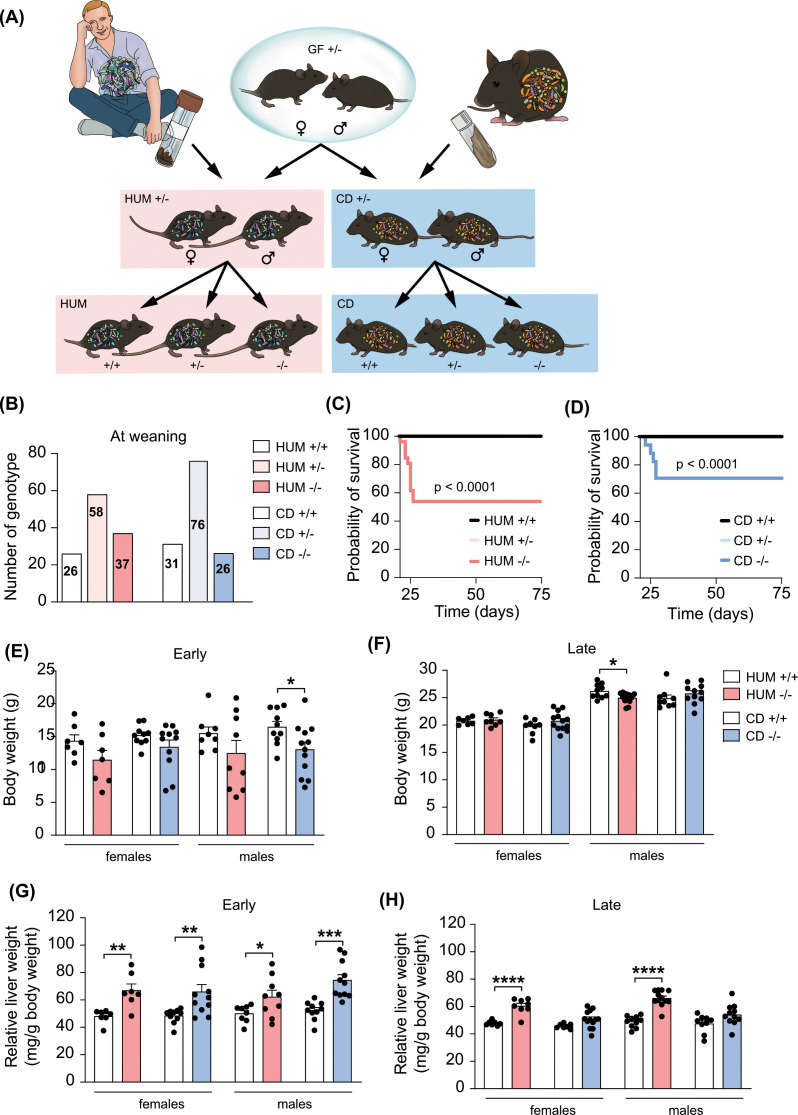
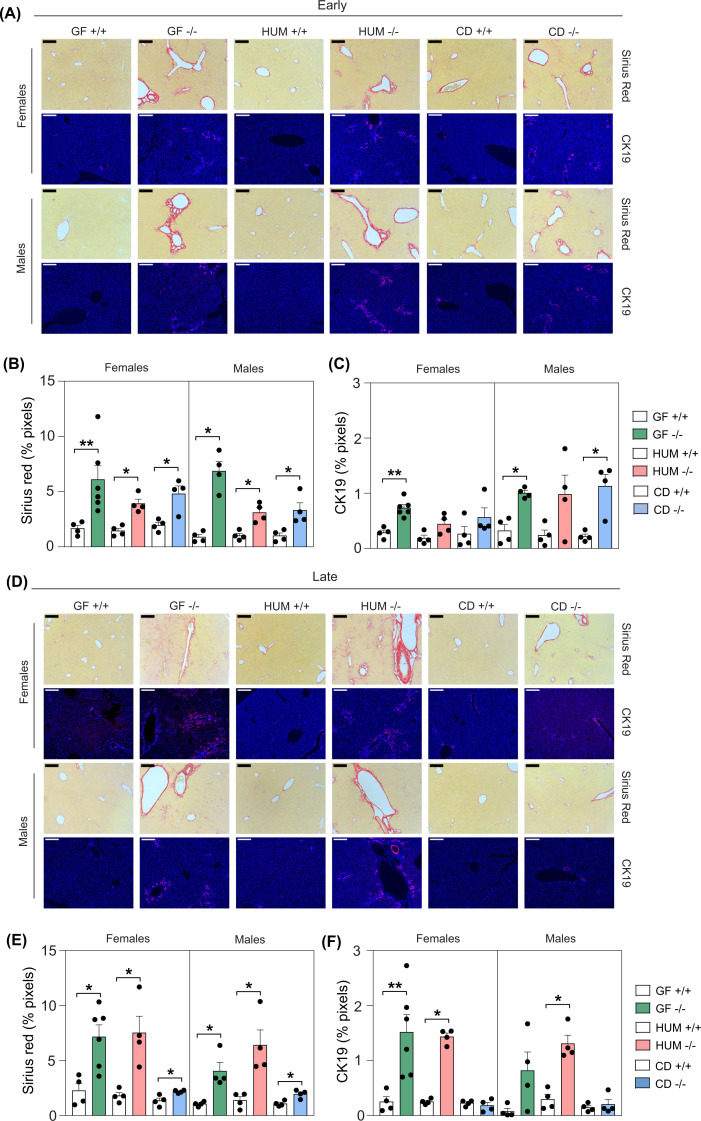
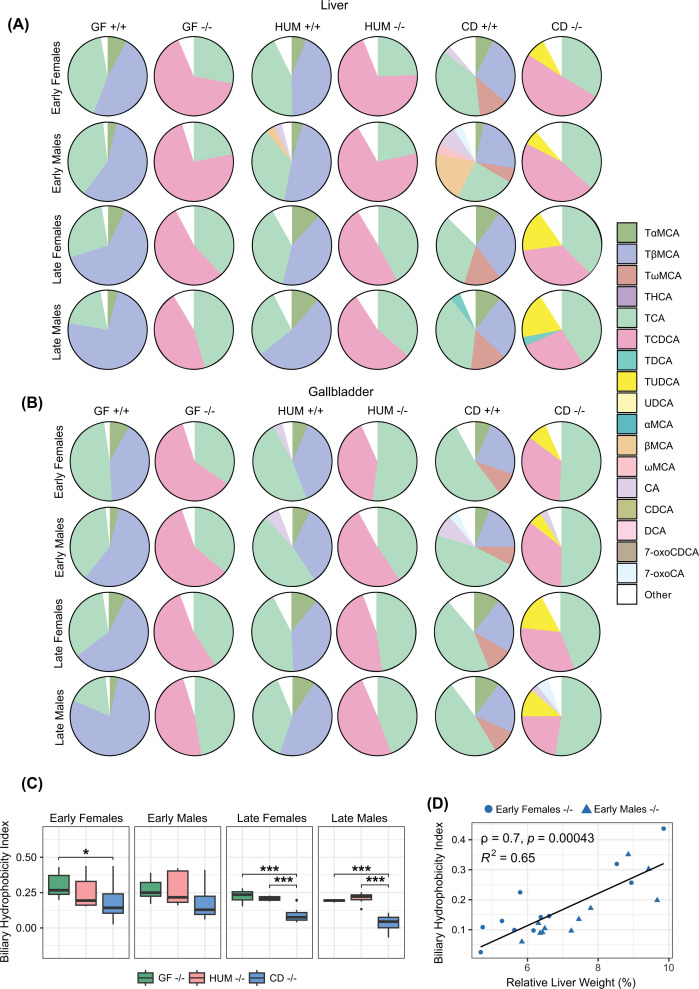
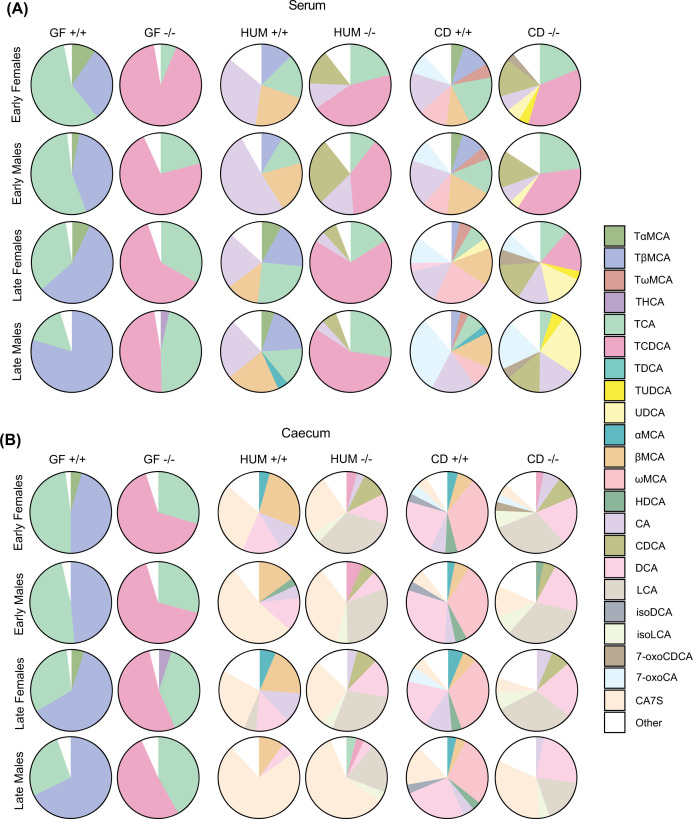
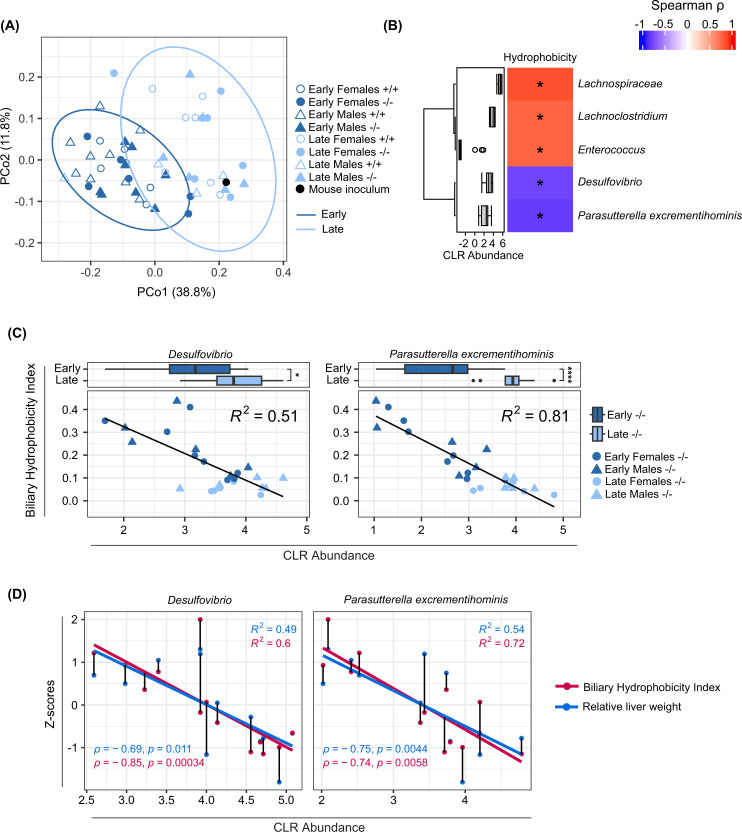
Mice with deletion of Cyp2c70 have a human-like bile acid composition, display age- and sex-dependent signs of hepatobiliary disease and can be used as a model to study interactions between bile acids and the gut microbiota in cholestatic liver disease. In the present study, we rederived Cyp2c70-/- mice as germ-free (GF) and colonized them with a human or a mouse microbiota to investigate whether the presence of a microbiota can be protective in cholangiopathic liver disease associated with Cyp2c70-deficiency. GF Cyp2c70-/- mice showed reduced neonatal survival, liver fibrosis, and distinct cholangiocyte proliferation. Colonization of germ-free breeding pairs with a human or a mouse microbiota normalized neonatal survival of the offspring, and particularly colonization with mouse microbiota from a conventionally raised mouse improved the liver phenotype at 6-10 weeks of age. The improved liver phenotype in conventionalized (CD) Cyp2c70-/- mice was associated with increased levels of tauro-ursodeoxycholic acid (TUDCA) and UDCA, resulting in a more hydrophilic bile acid profile compared with GF and humanized Cyp2c70-/- mice. The hydrophobicity index of biliary bile acids of CD Cyp2c70-/- mice was associated with changes in gut microbiota, liver weight, liver transaminases, and liver fibrosis. Hence, our results indicate that neonatal survival of Cyp2c70-/- mice seems to depend on the establishment of a gut microbiota at birth, and the improved liver phenotype in CD Cyp2c70-/- mice may be mediated by a larger proportion of TUDCA/UDCA in the circulating bile acid pool and/or by the presence of specific bacteria.

Keywords: bile acids; cyp2c70; faecal microbiota transplantation; gut microbiota; hepatobiliary disease; ursodeoxycholic acid.


Conflict of interest statement

F.B. receives research funding from Biogaia AB, is co-founder and shareholder of Roxbiosens Inc and Implexion AB, and is on the scientific advisory board of Bactolife A/S. The other authors declare no competing financial interests of relevance for this manuscript.

Figures

Figure 1
Figure 1. Reduced survival and increased relative liver weight in GF Cyp2c70−/− mice.
(A,B) Number of GF mice genotyped at weaning (three weeks of age) (A) and immediately after birth (B). (C) Kaplan–Meier estimator of survival over time in GF Cyp2c70 mice (Cyp2c70+/+, n=46, Cyp2c70+/−, n=61, Cyp2c70−/−, n=25) analyzed with Log-rank (Mantel-Cox) test. (D,E) Body weight and relative liver weight in GF Cyp2c70+/+ and Cyp2c70−/− mice at the early timepoint (D) (n=4–8 mice per group) and the late timepoint (E) (n=4–9 mice per group). Data are presented as mean ± SEM, *P<0.05, **P<0.01, ***P<0.001 indicate differences between female or male GF Cyp2c70+/+ and GF Cyp2c70−/− mice analyzed with two-tailed unpaired t-tests.
Figure 2
Figure 2. Colonization of Cyp2c70+/− mice with human or mouse microbiota
(A) Graphical illustration of the experimental design for the colonization experiments. (B) Number of HUM and CD mice genotyped at weaning (3 weeks of age). (C,D) Kaplan–Meier estimator of survival over time in HUM mice (C) (Cyp2c70+/+, n=21; Cyp2c70+/−, n=45; Cyp2c70−/−, n= 26) and CD Cyp2c70 mice (D) (Cyp2c70+/+, n=25, Cyp2c70+/−, n=37, Cyp2c70−/−, n=17) analyzed with Log-rank (Mantel-Cox) tests. (E,F) Body weight in HUM and CD Cyp2c70+/+ and Cyp2c70−/− mice at the early timepoint (E) (HUM n=7–9 mice per group, CD n=8–11 mice per group) and the late timepoint (F) (HUM n=7–9 mice per group, CD n=8–13 mice per group). (G,H) Relative liver weight of HUM and CD Cyp2c70+/+ and Cyp2c70−/− mice at the early timepoint (G) (same mice as in panel E) and the late timepoint (H) (same mice as in panel F). Data are presented as mean ± SEM; *P<0.05, **P<0.01, ***P<0.001, ****P<0.0001 indicate differences between female or male Cyp2c70+/+ and Cyp2c70−/− mice within each group (HUM or CD) analyzed with two-tailed unpaired t-tests.
Figure 3
Figure 3. Ameliorated liver phenotype in CD Cyp2c70−/− mice
(A–F) Histological and immunological staining and quantification showing Sirius Red and CK19 in livers from female and male GF, HUM and CD Cyp2c70+/+ and Cyp2c70−/− mice at the early timepoint (A–C) and at the late timepoint (D–F). 200 µm indicators are shown. To increase visibility and brightness for the visual presentation of CK19-stained area the γ was set to 0.8 and gain to 1.7 (Blue: Hoechst, Red: CK19). Data are presented as mean ± SEM; *P<0.05 and **P<0.01 indicate differences between female or male Cyp2c70+/+ and Cyp2c70−/− mice within each group (GF, HUM or CD) analyzed with Wilcoxon rank sum tests.
Figure 4
Figure 4. Bile acid profiles in liver and gallbladder from GF, HUM, and CD mice
(A,B) Bile acid profiles in liver (A) and gallbladder (B) from female and male GF, HUM, and CD Cyp2c70+/+ and Cyp2c70/− mice at early and late timepoints. (C) Biliary hydrophobicity index of female and male GF, HUM, and CD Cyp2c70−/− mice at the early and late timepoints presented with a box plot. The lower (quartile 1) and upper (quartile 3) quartiles form the box with median represented by the central line. Whiskers reach to 1.5× the inner quartile range. Outliers are presented with visible points beyond the whiskers. (D) Scatterplot with a linear model fit and Spearman’s correlation analysis of biliary hydrophobicity index, and relative liver weight in CD Cyp2c70−/− mice at the early timepoint. *P<0.05, **P<0.01, ***P<0.001 indicate differences between female or male GF, HUM and CD Cyp2c70−/− mice analyzed with Kruskal–Wallis H tests with the Conover-Iman test as post hoc using Benjamini and Hochberg correction for multiple testing adjustment. Females, n = 5–12 mice per group; males, n = 4–12 mice per group. αMCA, α-muricholic acid; βMCA, β-muricholic acid; ωMCA, ω-muricholic acid; 7-oxoCDCA, 7-oxochenodeoxycholic acid; 7-oxoCA, 7-oxocholic acid; CA, cholic acid; CDCA, chenodeoxycholic acid; DCA, deoxycholic acid; TαMCA, tauro-α-muricholic acid; TβMCA, tauro-β-muricholic acid; TωMCA, tauro-ω-muricholic acid; TCA, tauro-cholic acid; TCDCA, tauro-chenodeoxycholic acid; TDCA, tauro-deoxycholic acid; THCA, tauro-hyocholic acid; TUDCA, tauro-ursodeoxycholic acid; UDCA, ursodeoxycholic acid.
Figure 5
Figure 5. Bile acid profiles in serum and caecum from GF, HUM, and CD mice
(A,B) Bile acid profiles in serum (A) and caecum (B) from female and male GF, HUM, and CD Cyp2c70+/+ and Cyp2c70/− mice at the early and late timepoint. Females, n=4–13 mice per group; males, n=4–13 mice per group. αMCA, α-muricholic acid; βMCA, β-muricholic acid; ωMCA, ω-muricholic acid; 7-oxoCDCA, 7-oxochenodeoxycholic acid; 7-oxoCA, 7-oxocholic acid; CA7S, cholic acid-7-sulfate; CA, cholic acid; CDCA, chenodeoxycholic acid; DCA, deoxycholic acid; HDCA, hyodeoxycholic acid; isoDCA, iso-deoxycholic acid (3β-deoxycholic acid); isoLCA, iso-lithocholic acid (3β-lithocholic acid); LCA, lithocholic acid; TαMCA, tauro-α-muricholic acid; TβMCA, tauro-β-muricholic acid; TωMCA, tauro-ω-muricholic acid; TCA, tauro-cholic acid; TCDCA, tauro-chenodeoxycholic acid; TDCA, tauro-deoxycholic acid; THCA, tauro-hyocholic acid; TUDCA, tauro-ursodeoxycholic acid; UDCA, ursodeoxycholic acid.
Figure 6
Figure 6. Caecal microbiota analyses in CD mice
(A) Microbiota analysis by 16S rRNA sequencing of caecum from CD mice showing first and second Principal Coordinates of the weighted UniFrac distance matrix of CD Cyp2c70+/+ and Cyp2c70−/− mice at early and late timepoints and the mouse inoculum. Ellipses indicate 95% confidence assuming a multivariate t-distribution. (B) Spearman's correlation between biliary hydrophobicity index and caecal bacterial taxa of CD Cyp2c70−/− mice at the early timepoint. Distribution of bacterial abundance is presented as centered log-ratio (CLR) abundance with a box plot. The lower (quartile 1) and upper (quartile 3) quartiles form the box with the median represented by the central line. Whiskers reach to 1.5× the inner quartile range. Outliers are presented with visible points beyond the whiskers. (C) Scatterplots with linear models fitted of biliary hydrophobicity index and bacterial taxa presented as CLR abundance for CD Cyp2c70−/− mice at early and late timepoints. Distribution of bacterial abundance is presented with a box plot. The lower (quartile 1) and upper (quartile 3) quartiles form the box with the median represented by the central line. Whiskers reach to 1.5× the inner quartile range. Outliers are presented with visible points beyond the whiskers. (D) Scatterplots with linear models fitted of bacterial taxa presented as CLR abundance that correlate with biliary hydrophobicity index and relative liver weight in CD Cyp2c70−/− mice at the early timepoint. Lines between points signify that the observations are from the same mouse; *P<0.05, **P<0.01, ***P<0.001, ****P<0.0001 indicate differences between Cyp2c70−/− mice at early and late timepoints analyzed with Wilcoxon rank sum tests.

References

    1. Sayin S.I., Wahlstrom A., Felin J., Jantti S., Marschall H.U., Bamberg K.et al. (2013) Gut microbiota regulates bile acid metabolism by reducing the levels of tauro-beta-muricholic acid, a naturally occurring FXR antagonist. Cell Metab. 17, 225–235 10.1016/j.cmet.2013.01.003 - DOI - PubMed
    1. Wahlstrom A., Sayin S.I., Marschall H.U. and Backhed F. (2016) Intestinal crosstalk between bile acids and microbiota and its impact on host metabolism. Cell Metab. 24, 41–50 10.1016/j.cmet.2016.05.005 - DOI - PubMed
    1. Takahashi S., Fukami T., Masuo Y., Brocker C.N., Xie C., Krausz K.W.et al. (2016) Cyp2c70 is responsible for the species difference in bile acid metabolism between mice and humans. J. Lipid Res. 57, 2130–2137 10.1194/jlr.M071183 - DOI - PMC - PubMed
    1. Honda A., Miyazaki T., Iwamoto J., Hirayama T., Morishita Y., Monma T.et al. (2020) Regulation of bile acid metabolism in mouse models with hydrophobic bile acid composition. J. Lipid Res. 61, 54–69 10.1194/jlr.RA119000395 - DOI - PMC - PubMed
    1. de Boer J.F., Verkade E., Mulder N.L., de Vries H.D., Huijkman N., Koehorst M.et al. (2020) A human-like bile acid pool induced by deletion of hepatic Cyp2c70 modulates effects of FXR activation in mice. J. Lipid Res. 61, 291–305 10.1194/jlr.RA119000243 - DOI - PMC - PubMed

Publication types

Substances