. 2023 Jun 30;380(6652):1372-1380.
doi: 10.1126/science.abn1725. Epub 2023 Jun 29.

Metabolic orchestration of cell death by AMPK-mediated phosphorylation of RIPK1

Affiliations

Metabolic orchestration of cell death by AMPK-mediated phosphorylation of RIPK1

Tao Zhang et al. Science. .

Abstract

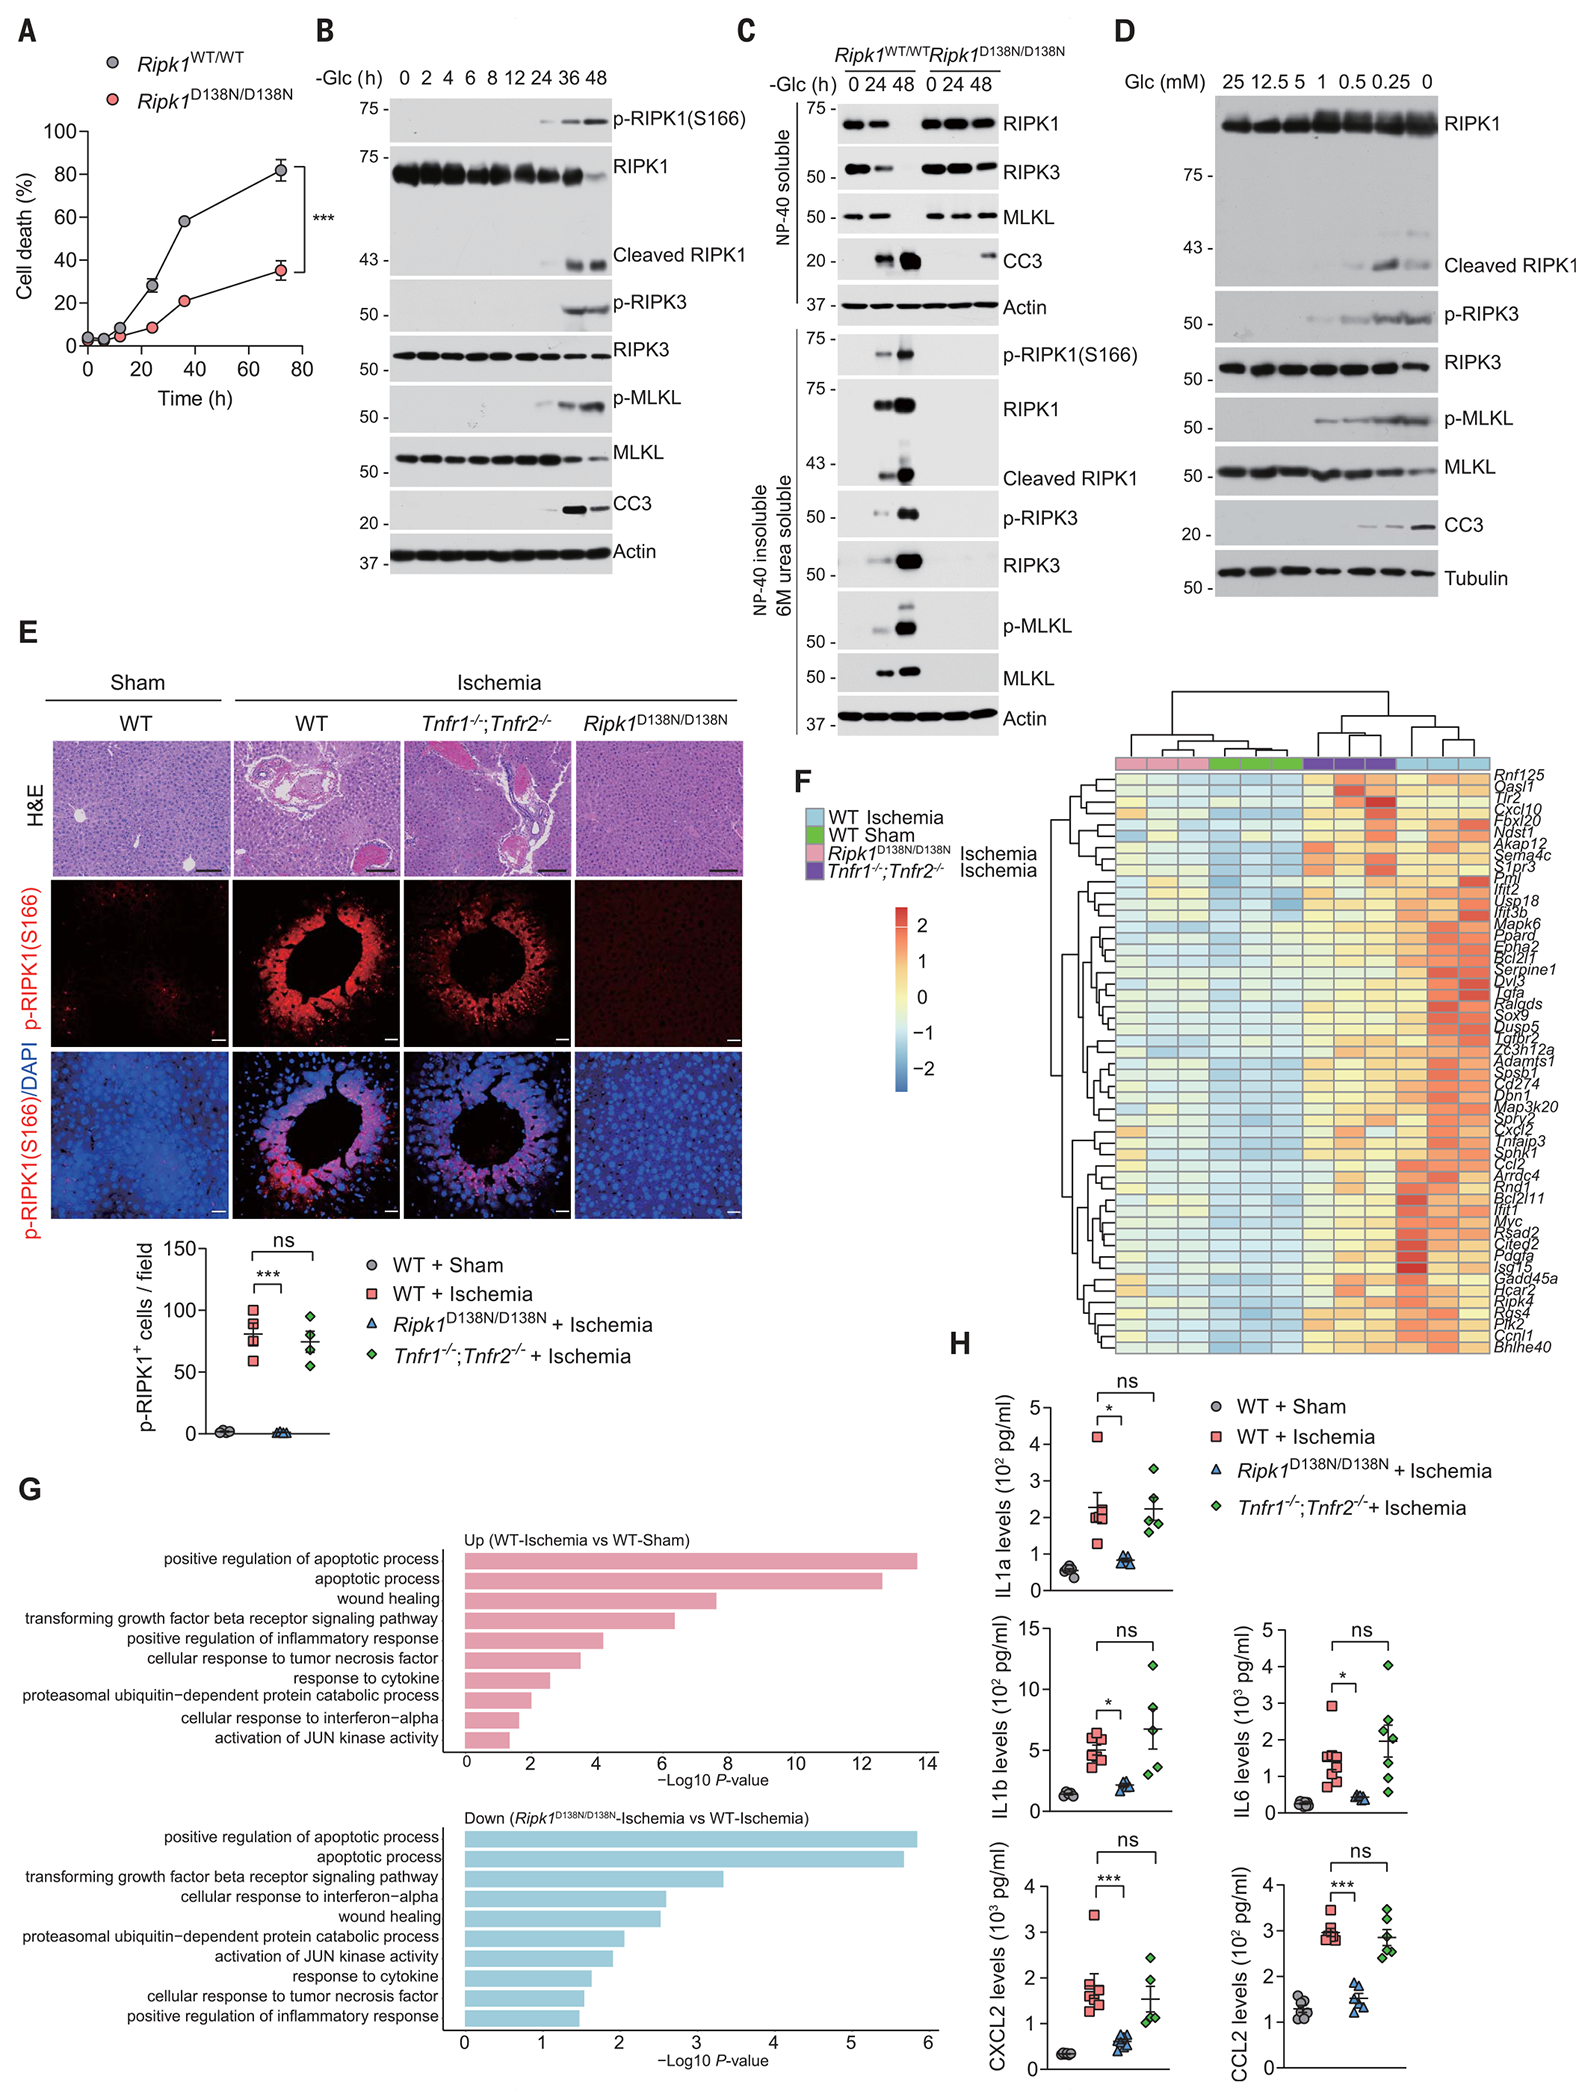
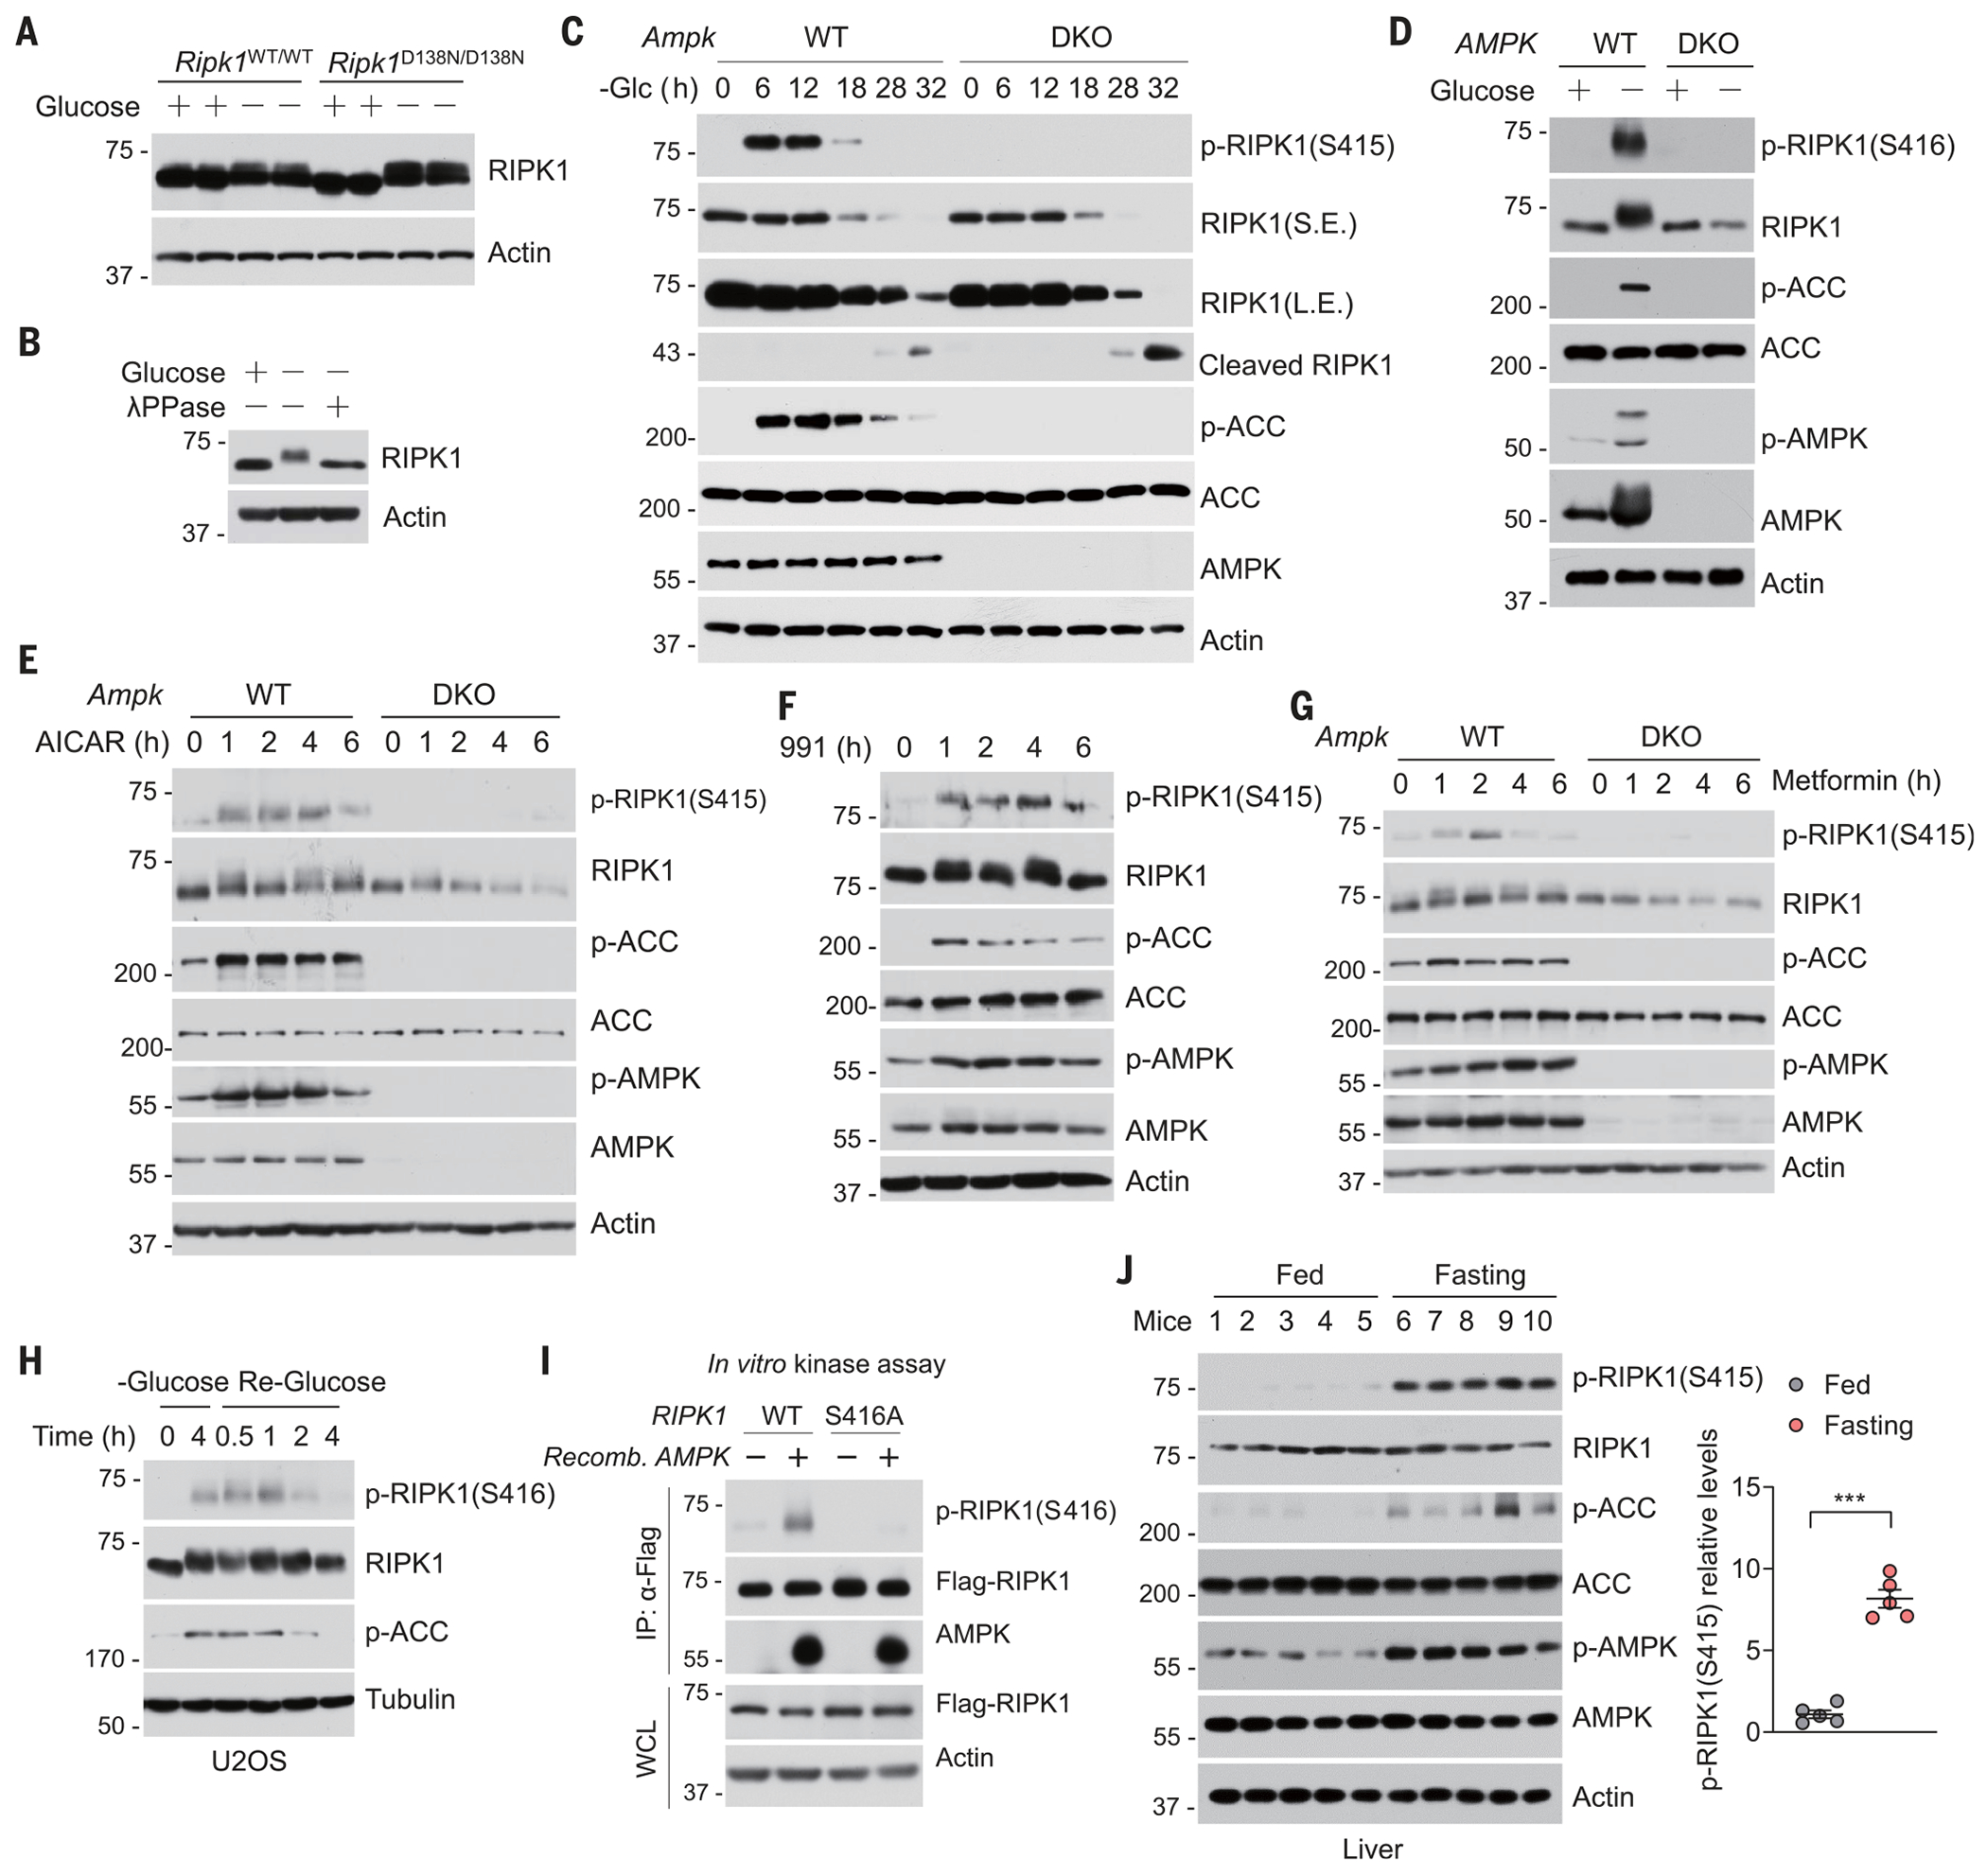
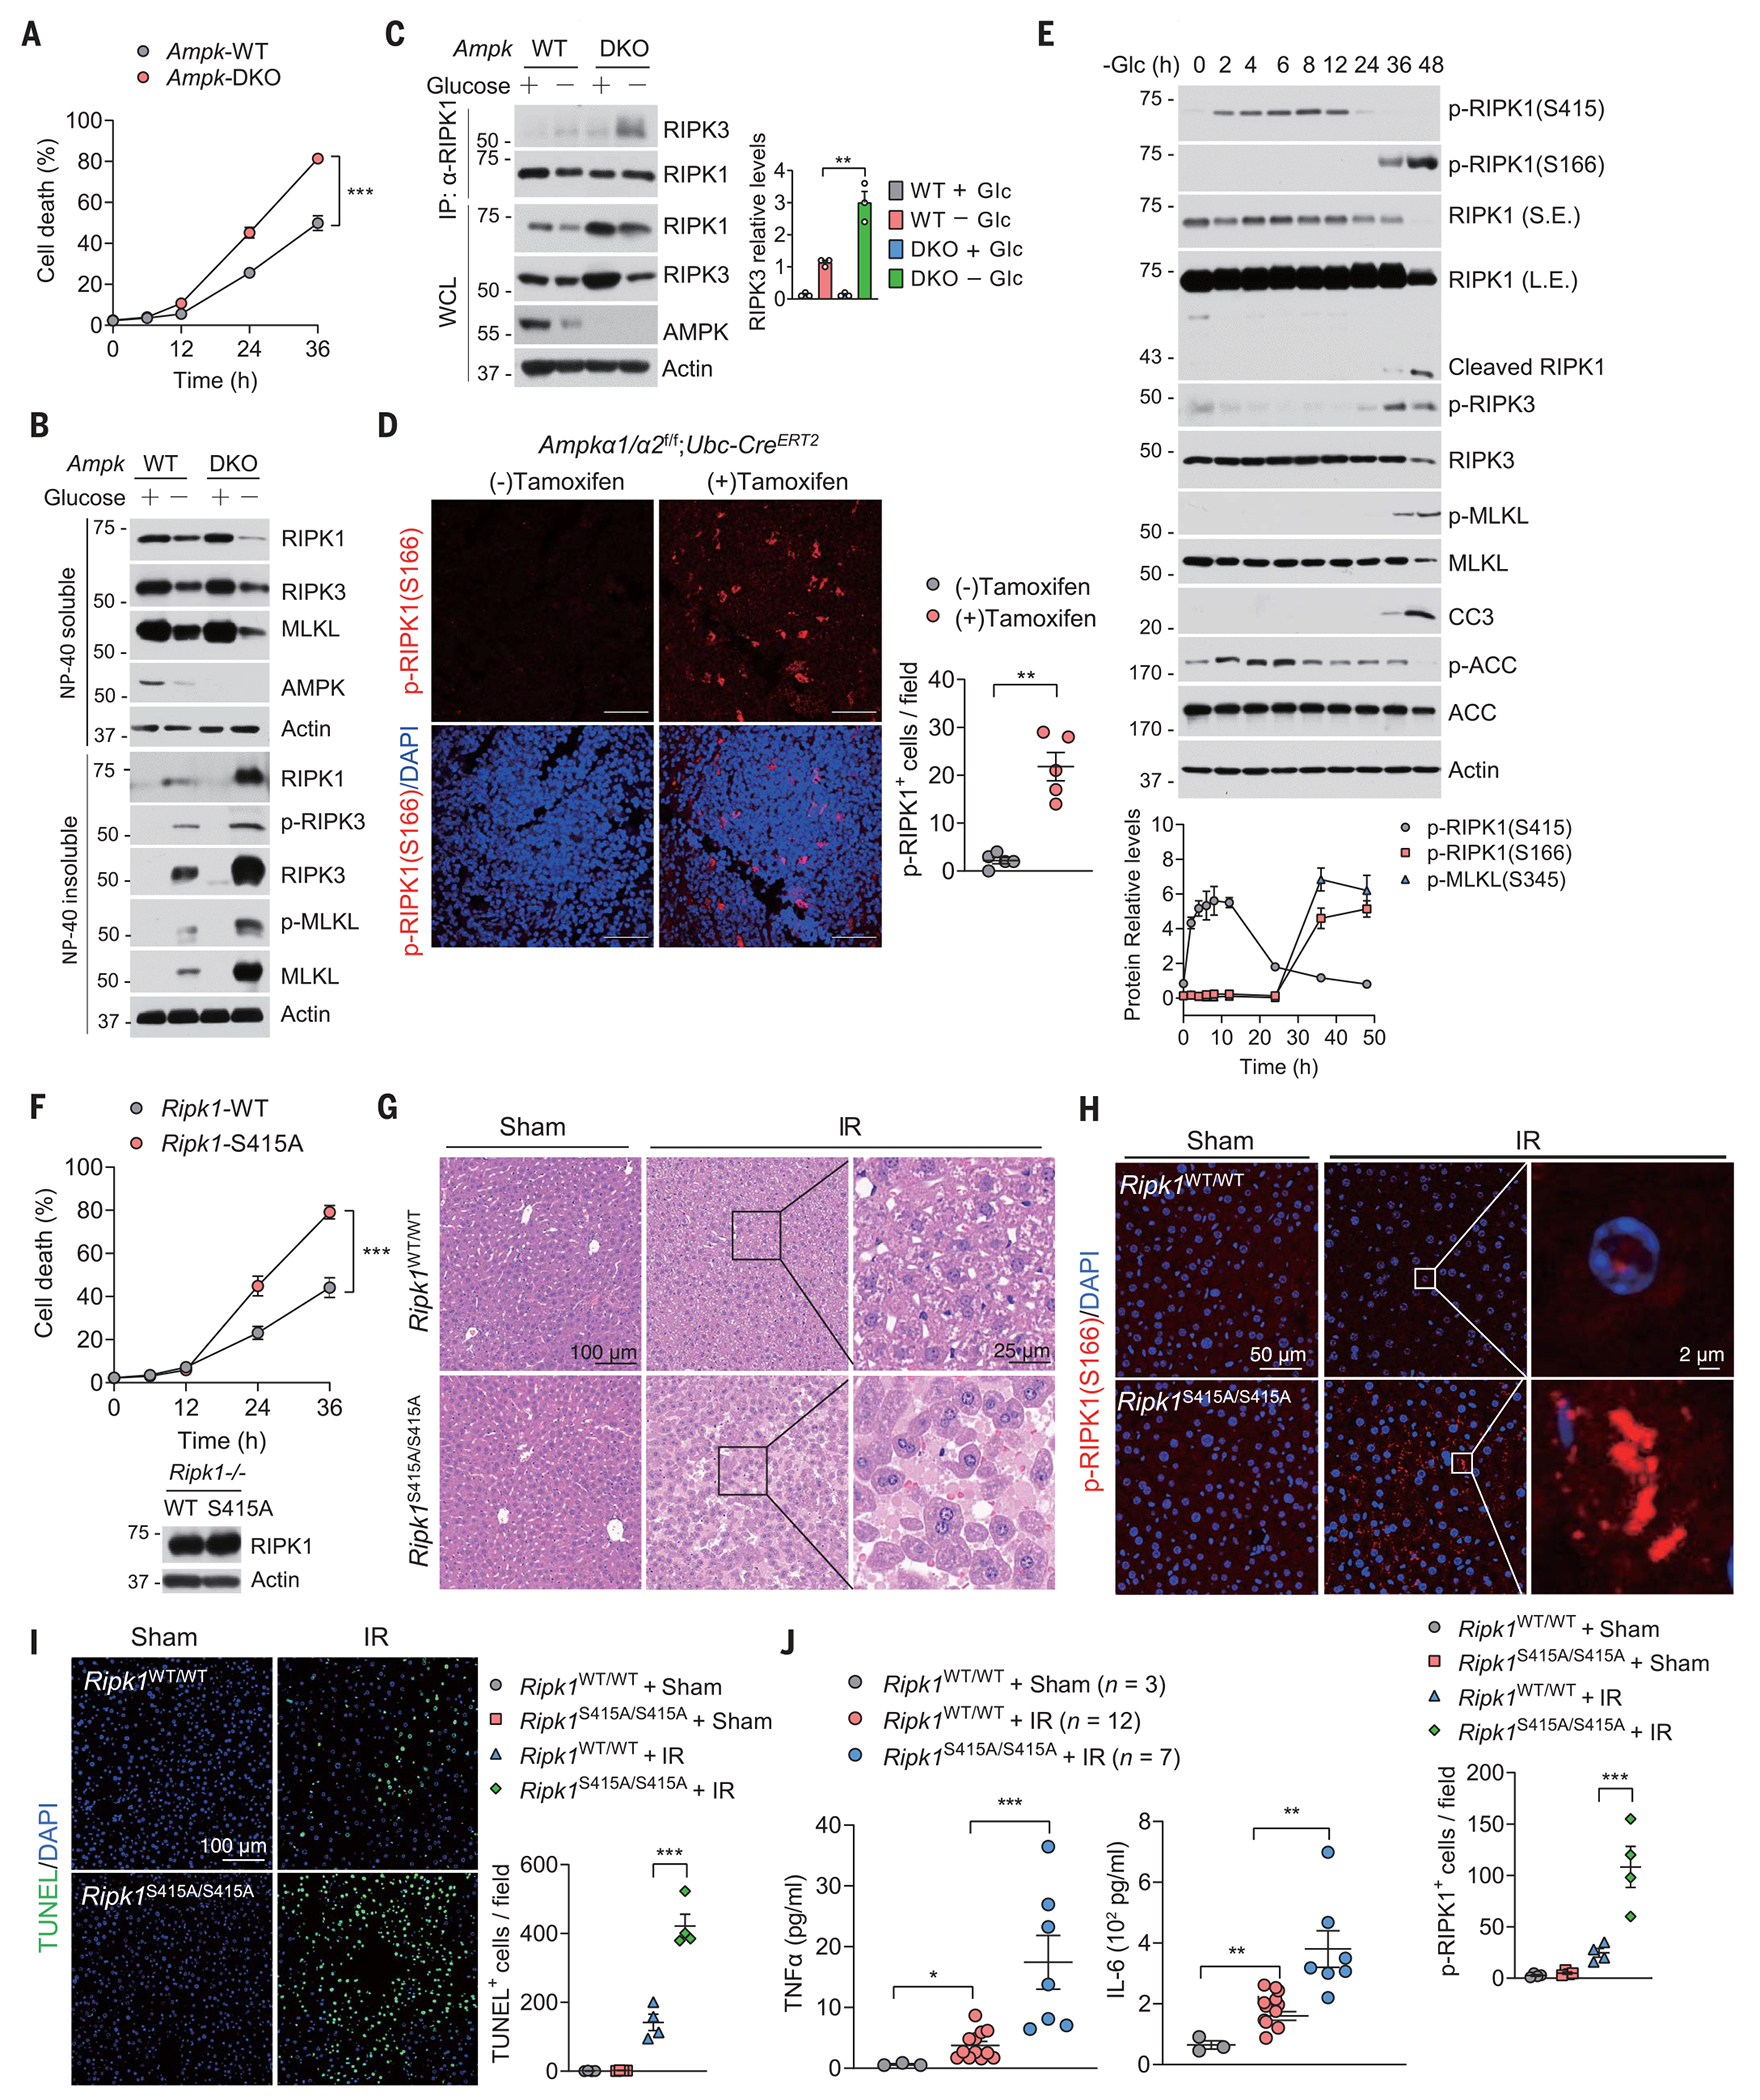
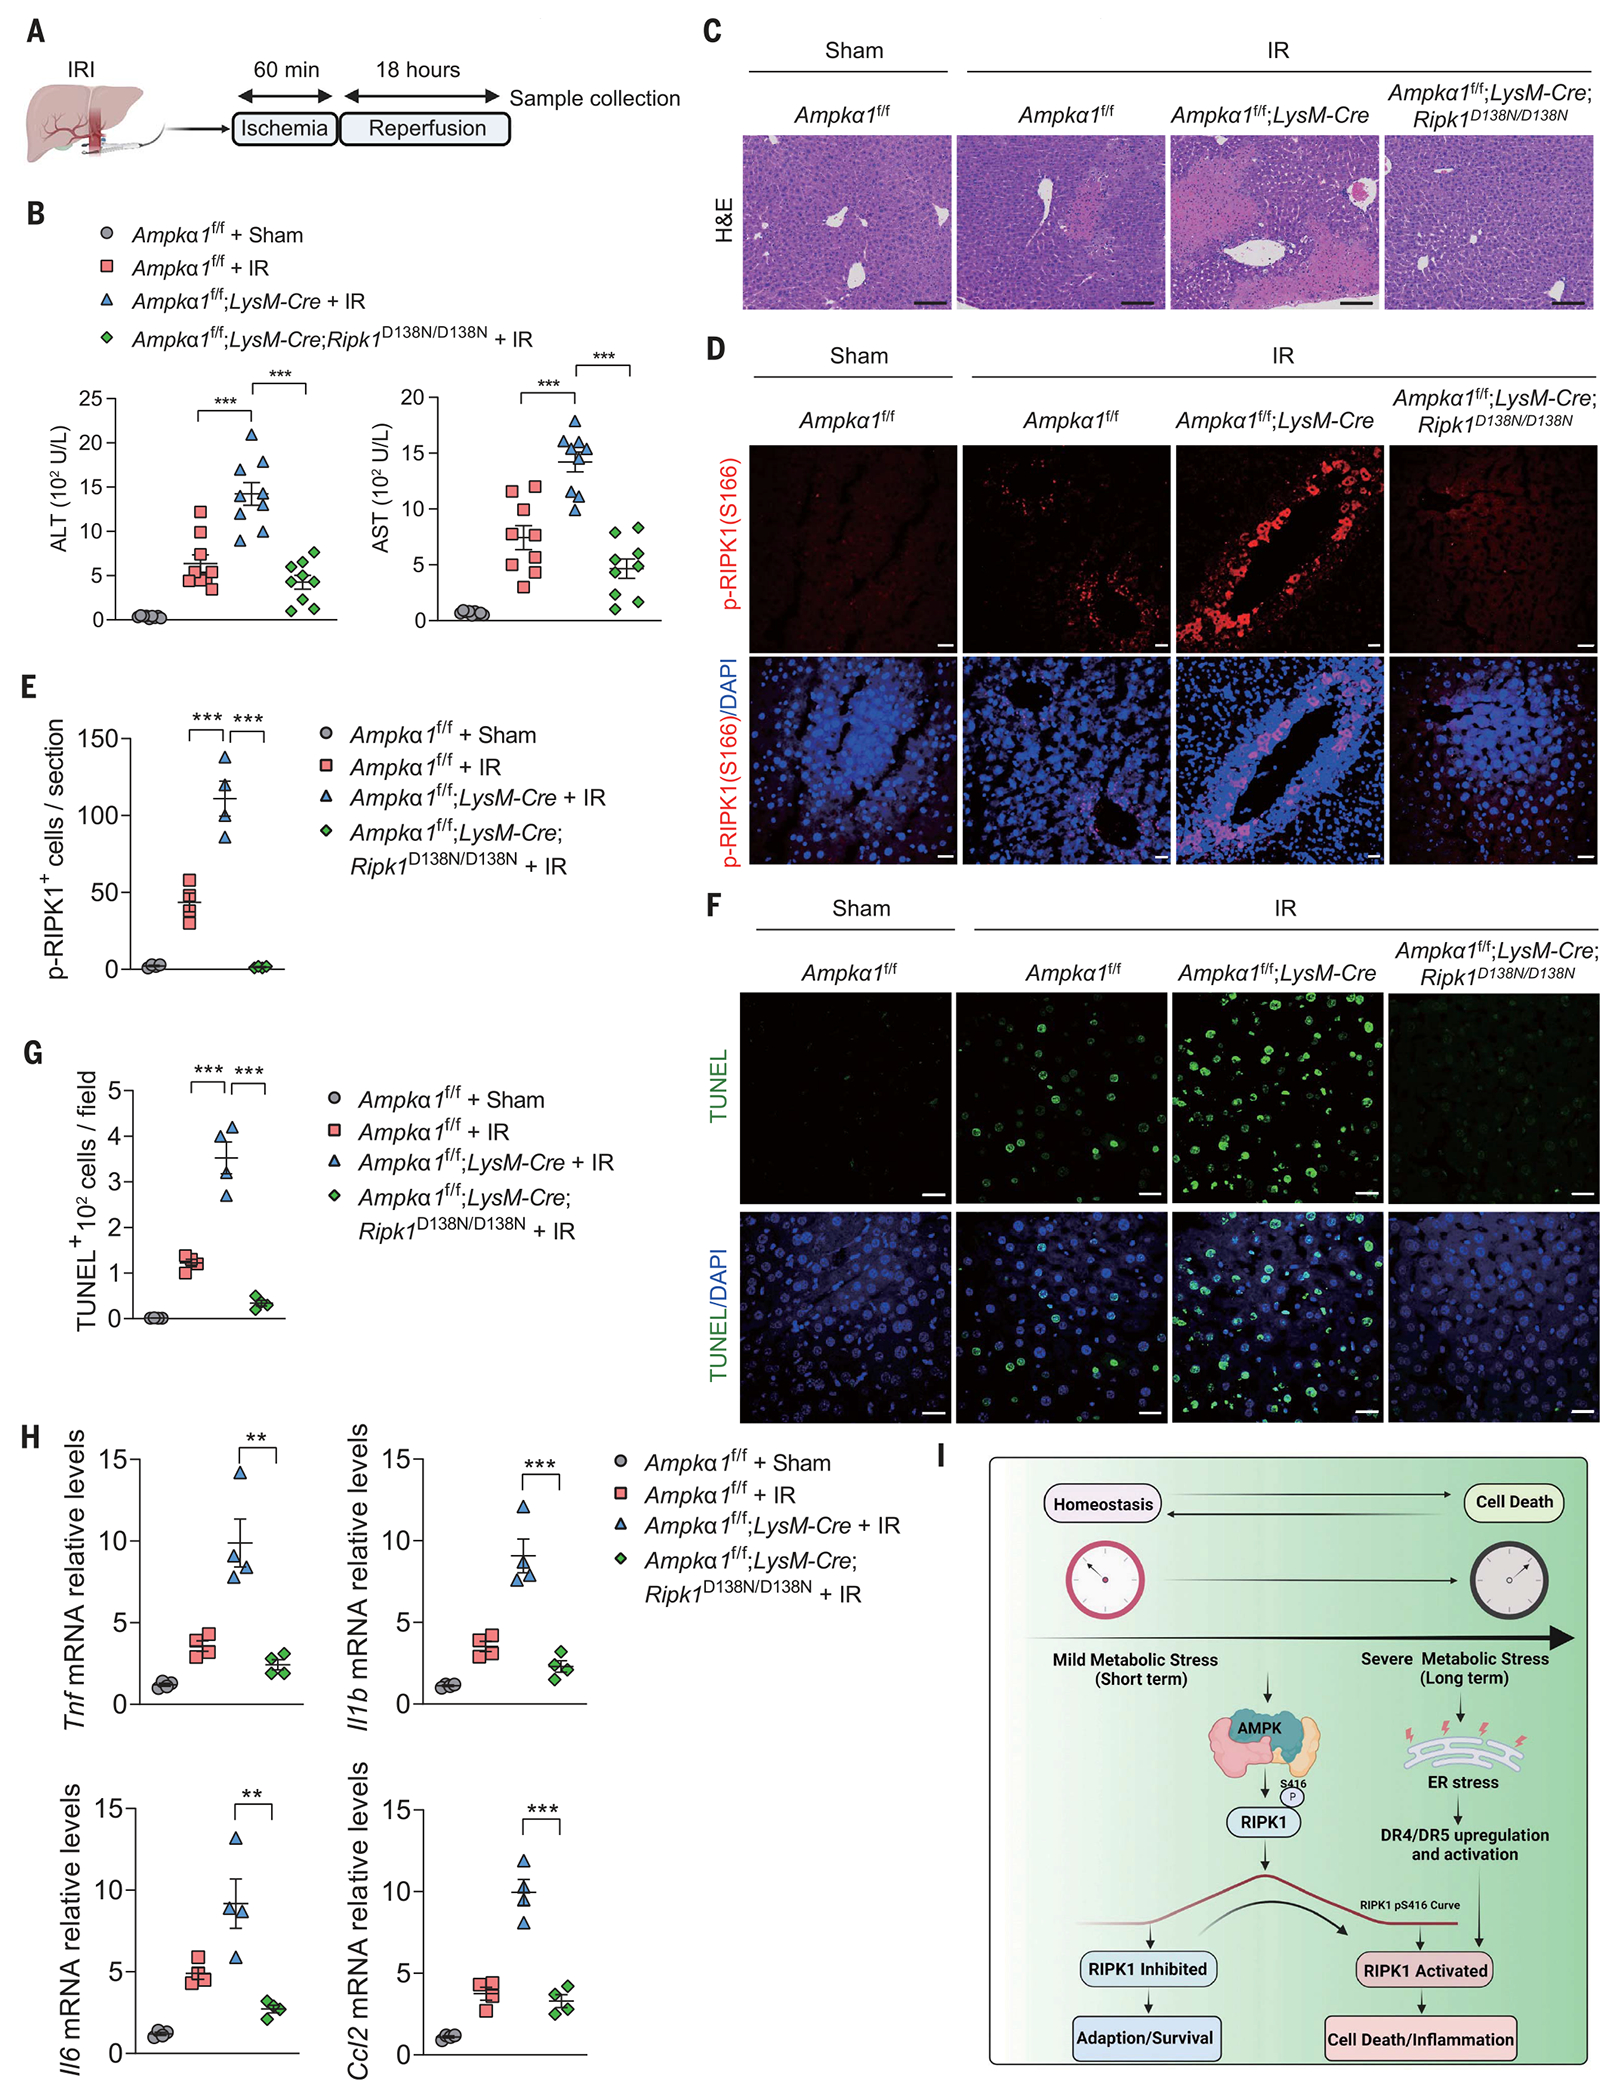
Adenosine monophosphate-activated protein kinase (AMPK) activity is stimulated to promote metabolic adaptation upon energy stress. However, sustained metabolic stress may cause cell death. The mechanisms by which AMPK dictates cell death are not fully understood. We report that metabolic stress promoted receptor-interacting protein kinase 1 (RIPK1) activation mediated by TRAIL receptors, whereas AMPK inhibited RIPK1 by phosphorylation at Ser415 to suppress energy stress-induced cell death. Inhibiting pS415-RIPK1 by Ampk deficiency or RIPK1 S415A mutation promoted RIPK1 activation. Furthermore, genetic inactivation of RIPK1 protected against ischemic injury in myeloid Ampkα1-deficient mice. Our studies reveal that AMPK phosphorylation of RIPK1 represents a crucial metabolic checkpoint, which dictates cell fate response to metabolic stress, and highlight a previously unappreciated role for the AMPK-RIPK1 axis in integrating metabolism, cell death, and inflammation.


Conflict of interest statement

Competing interests: W.W. is a cofounder and consultant for ReKindle Therapeutics. P.S. has been a consultant at Novartis, Genovis, Guidepoint, The Planning Shop, ORIC Pharmaceuticals, Cedilla Therapeutics, Syros Pharmaceuticals, Exo Therapeutics, Curie Bio Operations, Exscientia, Ligature Therapeutics, and Redesign Science; and his laboratory receives research funding from Novartis. G.Sz. is a paid consultant for Cyta Therapeutics, Durect Co, Evive, Merck, Pfizer, Surrozen, Terra Firma, Pandion Therapeutics, LabCorp, Glympse Bio, Satellite Bio, and Zomagen. G.Sz. has additional financial interests in Glympse Bio, Satellite Bio, and Zomagen. The other authors declare that they have no competing financial interests.

Figures

Fig. 1.
Fig. 1.. Metabolic stress promotes cell death and inflammation in a RIPK1-dependent manner.
(A) WT or Ripk1D138N/D138N MEFs were cultured in glucose-free medium for the indicated times (hours), followed by cell viability analyses using propidium iodide (PI) uptake assay. Data are mean ± SD of n = 3 biological independent samples. Two-way analysis of variance (ANOVA); ***P < 0.001. (B) MEFs were cultured in glucose-free medium for the indicated times. The levels of proteins were determined by immunoblotting. n = 3 independent biological repeats. (C) WT or Ripk1D138N/D138N MEFs were cultured in glucose-free medium for the indicated times. The levels of proteins in mild-detergent (NP-40)–soluble fraction and 6 M urea–soluble fraction were determined by immunoblotting. n = 3 independent biological repeats. (D) MEFs were cultured in the medium with different glucose concentrations for 36 hours. The levels of proteins were determined by immunoblotting. n = 3 independent biological repeats. (E) WT, Tnfr1/2 DKO, and Rpik1D138N/D138N mice were subjected to a protocol of liver ischemia for 18 hours. Histological analysis and immunostaining for p-RIPK1(S166) were performed on liver sections (n = 4 mice in each group). DAPI (4’,6-diamidino-2-phenylindole) for nuclei. Representative images are shown. Quantification of p-RIPK1(S166)–positive cells is shown at the bottom. Data are mean ± SEM, one-way ANOVA, post hoc Dunnett’s test; ***P < 0.001; n.s., not significant. Scale bars, 100 μm. (F) Heatmap of genes differentially expressed in the whole livers derived of WT, Tnfr1/2 DKO, and Rpik1D138N/D138N mice subjected to liver ischemia for 18 hours. (G) Gene Ontology analysis of genes that are up-regulated in the livers of mice subjected to liver ischemia for 18 hours in a RIPK1-dependent manner. (H) ELISA analyses of the levels of indicated cytokines and chemokines in serum from WT, Tnfr1/2 DKO, and Rpik1D138N/D138N mice subjected to liver ischemia for 18 hours. Data are presented as mean ± SEM, and each dot represents one mouse. One-way ANOVA, post hoc Dunnett’s test; *P < 0.05, ***P < 0.001.
Fig. 2.
Fig. 2.. AMPK phosphorylates RIPK1 at S416 in response to metabolic stress.
(A) WT or Ripk1D138N/D138N MEFs were cultured in glucose-free medium for 12 hours. Cell lysates were then subjected to immunoblotting using anti-RIPK1 antibody. n = 3 independent biological repeats. (B) U2OS were cultured in glucose-free medium for 4 hours. Cell lysates were treated with lambda-phosphatase (λPPase), as indicated, for 30 min and then subjected to immunoblotting using anti-RIPK1 antibody. (C) WT and Ampk DKO MEFs were cultured in glucose-free medium for the indicated times. The levels of proteins were determined by immunoblotting. n = 3 independent biological repeats. (D) WT and AMPK DKO HT-29 cells were cultured in glucose-free medium for 12 hours. The levels of proteins were determined by immunoblotting. n = 3 independent biological repeats. (E) WT and Ampk DKO MEFs were treated with 2 mM AICAR in the presence of glucose for the indicated times. The levels of proteins were determined by immunoblotting. n = 3 independent biological repeats. (F) MEFs were treated with 50 μM 991 in the presence of glucose for the indicated times. The levels of proteins were determined by immunoblotting. n = 3 independent biological repeats. (G) WT and Ampk DKO MEFs were treated with 2 mM metformin in the presence of glucose for various times. The levels of proteins were determined by immunoblotting. n = 3 independent biological repeats. (H) U2OS were starved of glucose (–Glucose) for 4 hours, and then the culture was switched to glucose-containing (25 mM) medium for indicated times (Re-Glucose), and samples were harvested. n = 3 independent biological repeats. (I) Flag-RIPK1 purified from human embryonic kidney 293T cells expressing Flag-tagged WT or S416A mutant of RIPK1 for 24 hours was combined with recombinant (Recomb.) active AMPK as indicated in an in vitro kinase reaction. The amounts of p-RIPK1 (S416) were determined by immunoblotting. n = 3 independent biological repeats. (J) Western blot analysis of p-RIPK1 (S415) in livers from fed and fasted (16 hours) animals (n = 5). Quantification of p-RIPK1(S415) is shown on the right. Data are presented as mean ± SEM, and each dot represents one mouse. Unpaired two-tailed t test; ***P < 0.001.
Fig. 3.
Fig. 3.. AMPK deficiency promotes RIPK1-driven cell death and inflammation in vitro and in vivo.
(A) WT or Ampk DKO MEFs were cultured in glucose-free medium for the indicated times followed by cell viability analyses using PI uptake assay. Data are mean ± SD of n = 3 biologically independent samples. Two-way ANOVA; ***P < 0.001. (B) WT or Ampk DKO MEFs were cultured in glucose-free medium for 30 hours. The levels of proteins in mild-detergent (NP-40)–soluble fraction and 6 M urea–soluble fraction were determined by immunoblotting. n = 3 independent biological repeats. (C) WT or Ampk DKO MEFs were cultured in glucose-free medium for 24 hours. Afterward, cell lysates were immunoprecipitated with anti-RIPK1 antibody, and the immunocomplexes were analyzed by immunoblotting using anti-RIPK3 antibody. n = 3 independent biological repeats. Quantified values for Western blot images are shown on the right. **P < 0.01. (D) Ampka1/a2f/f;Ubc-CreER mice were treated with or without tamoxifen (4 mg per day, for 5 days) to induce Ampk deletion. Spleens were harvested 8 weeks after tamoxifen treatment, and then immunostaining for p-RIPK1(S166) was performed on spleen sections (n = 5 mice in each group). DAPI for nuclei. Representative images are shown. Data are presented as mean ± SEM, and each dot represents one mouse. Unpaired two-tailed t test; **P < 0.01. Scale bars, 100 μm. (E) MEFs were cultured in glucose-free medium for the indicated times. The levels of proteins were determined by immunoblotting. n = 3 independent biological repeats. Quantified values for Western blot images are shown at the bottom. (F) Ripk1−/− MEFs reconstituted with WT or S415A mutant of RIPK1 were cultured in glucose-free medium for the indicated times followed by cell viability analyses using PI uptake assay. Data are mean ± SD of n = 3 biological independent samples. Two-way ANOVA; ***P < 0.001. The expression of RIPK1 was determined by immunoblotting and is shown at the bottom. (G) Ripk1S415A/S415A and control WT littermate mice were subjected to liver IR injury. Histological analysis on liver sections was performed (n = 4 mice in each group). (H) Ripk1S415A/S415A and control WT littermate mice were subjected to liver IR injury. Immunostaining for p-RIPK1(S166) on liver sections was performed (n = 4 mice in each group). DAPI for nuclei. Representative images are shown. Microscopic quantification of p-RIPK1(S166)–positive cells is shown at the bottom. Data are presented as mean ± SEM, and each dot represents one mouse. One-way ANOVA, post hoc Dunnett’s test; ***P < 0.001. (I) TUNEL assays were performed on liver sections from Ripk1S415A/S415A and control WT littermate mice subjected to liver IR injury (n = 4 mice in each group). DAPI for nuclei. Representative images are shown. Microscopic quantification of TUNEL-positive cells was shown on the right. Data are presented as mean ± SEM, and each dot represents one mouse. One-way ANOVA, post hoc Dunnett’s test; ***P < 0.001. (J) ELISA analyses of the concentrations of indicated cytokines and chemokines in serum from Ripk1S415A/S415A and control WT littermate mice subjected to liver IR injury (n = 4 mice each group). Data are presented as mean ± SEM, and each dot represents one mouse. One-way ANOVA, post hoc Dunnett’s test; **P < 0.01, ***P < 0.001.
Fig. 4.
Fig. 4.. Inhibition of RIPK1 activity protects against liver IR injury in myeloid Ampk KO mice.
(A) Schematic of liver IR injury involving 60 min of global ischemia followed by an 18-hour reperfusion period. (B) Serum ALT and AST levels were measured from control (n = 9), Ampkα1f/f;LysM Cre (n = 9), and Ampkα1f/f;LysMCre;Ripk1D138N/D138N (n = 9) mice subjected to liver IR injury. Data are presented as mean ± SEM, and each dot represents one mouse. One-way ANOVA, post hoc Dunnett’s test; ***P < 0.001. (C) Histological analyses were performed on liver sections of Ampkα1f/f;LysM Cre, Ampkα1f/f;LysM Cre;Rpk1D138N/D138N, and control littermate mice subjected to liver IR injury (n = 4). Representative images are shown. Scale bars, 100 μm. (D) Immunostaining for p-RIPK1(S166) was performed on liver sections of Ampkα1f/f;LysM Cre, Ampkα1f/f;LysM Cre;Ripk1D138N/D138N, and control littermate mice subjected to liver IR injury (n = 4). DAPI for nuclei. Representative images are shown. Scale bars, 100 μm. (E) Quantification of p-RIPK1(S166)–positive cells on liver sections from (D). Data are presented as mean ± SEM, and each dot represents one mouse. One-way ANOVA, post hoc Dunnett’s test; ***P < 0.001. (F) TUNEL assays were performed on liver sections of Ampkα1f/f;LysM Cre, Ampkα1f/f;LysM Cre;Ripk1D138N/D138N, and control littermate mice subjected to liver IR injury (n = 4). DAPI for nuclei. Representative images were shown. Scale bars, 100 μm. (G) Quantification of TUNEL-positive cells on liver sections from (F). Data are presented as mean ± SEM, and each dot represents one mouse. One-way ANOVA, post hoc Dunnett’s test; ***P < 0.001. (H) Quantitative reverse transcription polymerase chain reaction analysis of the mRNA expression of cytokines and chemokines in livers from control (n = 4), Ampkα1f/f;LysM Cre (n = 4), and Ampkα1f/f;LysM Cre;Ripk1D138N/D138N (n = 4) mice subjected to liver IR injury. Data are presented as mean ± SEM, and each dot represents one mouse. One-way ANOVA, post hoc Dunnett’s test; **P < 0.01, ***P < 0.001. (I) A schematic model to illustrate a delicate and temporal cellular response of RIPK1 to metabolic stress: Cells activate AMPK to suppress RIPK1 activation, allowing survival under energy stress in the short term, whereas over longer time periods, as the AMPK phosphorylation of RIPK1 is lost, the inhibition is relieved, promoting a switch to activated RIPK1-mediated cell death and inflammation. Moreover, long-term glucose starvation causes the ATF4/CHOP-dependent up-regulation and activation of TRAIL receptors DR4 and DR5, which promotes RIPK1 activation, cell death, and inflammation.

References

    1. Hardie DG, Nat. Rev. Mol. Cell Biol 8, 774–785 (2007). - PubMed
    1. Hardie DG, Ross FA, Hawley SA, Nat. Rev. Mol. Cell Biol 13, 251–262 (2012). - PMC - PubMed
    1. González A, Hall MN, Lin SC, Hardie DG, Cell Metab. 31, 472–492 (2020). - PubMed
    1. Lin SC, Hardie DG, Cell Metab. 27, 299–313 (2018). - PubMed
    1. Green DR, Galluzzi L, Kroemer G, Science 345, 1250256 (2014). - PMC - PubMed

MeSH terms

Substances

LinkOut - more resources