. 2023 Jun 30;380(6652):eadd3067.
doi: 10.1126/science.add3067. Epub 2023 Jun 30.

Spatially resolved single-cell translatomics at molecular resolution

Affiliations

Spatially resolved single-cell translatomics at molecular resolution

Hu Zeng et al. Science. .

Erratum in

Abstract

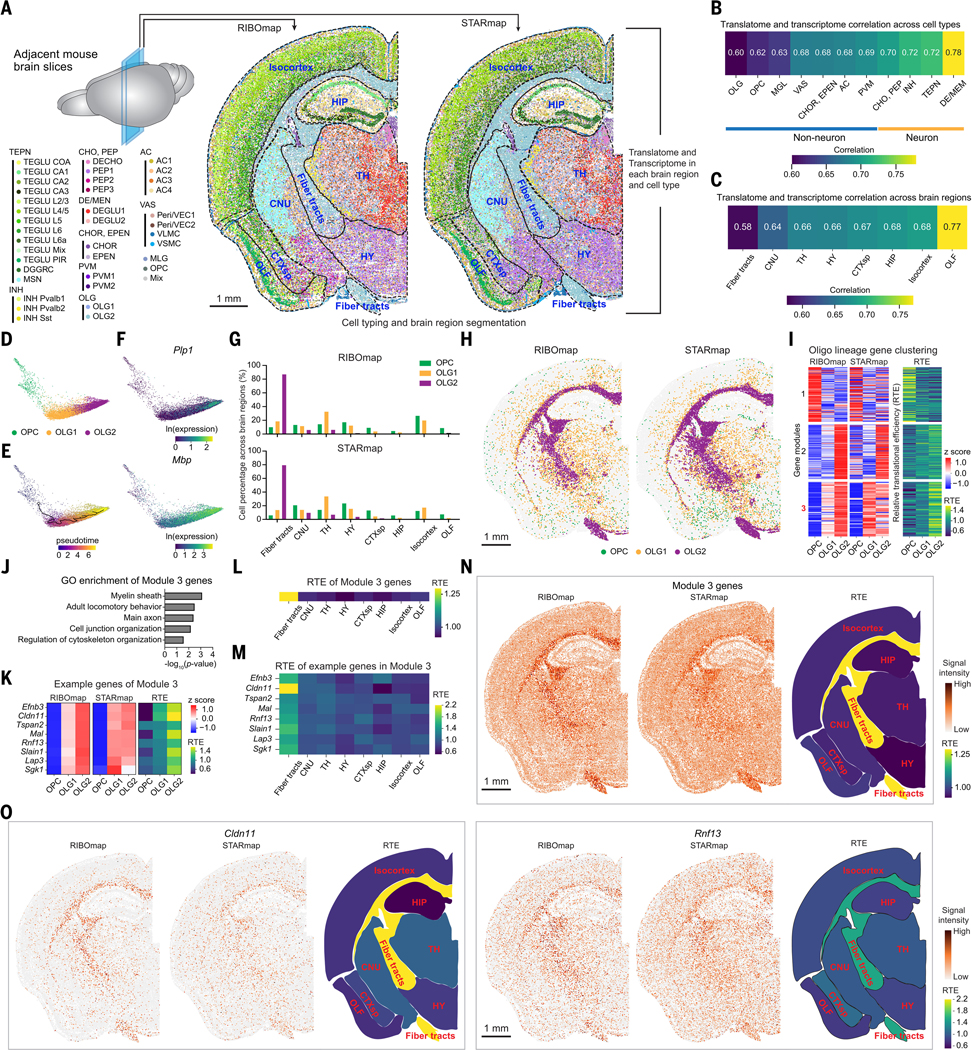
The precise control of messenger RNA (mRNA) translation is a crucial step in posttranscriptional gene regulation of cellular physiology. However, it remains a challenge to systematically study mRNA translation at the transcriptomic scale with spatial and single-cell resolution. Here, we report the development of ribosome-bound mRNA mapping (RIBOmap), a highly multiplexed three-dimensional in situ profiling method to detect cellular translatome. RIBOmap profiling of 981 genes in HeLa cells revealed cell cycle-dependent translational control and colocalized translation of functional gene modules. We mapped 5413 genes in mouse brain tissues, yielding spatially resolved single-cell translatomic profiles for 119,173 cells and revealing cell type-specific and brain region-specific translational regulation, including translation remodeling during oligodendrocyte maturation. Our method detected widespread patterns of localized translation in neuronal and glial cells in intact brain tissue networks.


Conflict of interest statement

Competing interests: X.W., H.Z., and J.R. are inventors on pending patent applications related to RIBOmap. X.W. is a scientific cofounder of Stellaromics. All methods, protocols, and sequences are freely available to nonprofit institutions and investigators.

Figures

Fig. 1.
Fig. 1.. RIBOmap for in situ profiling of mRNA translation at subcellular resolution.
(A) Schematic of RIBOmap. After the sample is prepared, a paired barcoded padlock probe and primer probe are hybridized to a targeted intracellular RNA, and the splint probe is hybridized to 18S rRNA of ribosomes. The splint probe is used as a template for the proximity ligation to circularize the padlock probe. The intact padlock probe can then be amplified to generate amine-modified DNA amplicons in situ. Next, these DNA amplicons are copolymerized into hydrogel through tissue-hydrogel chemistry for in situ sequencing. The gene-unique barcode sequence (red) in the cDNA amplicons can then be read out through cyclic in situ sequencing. (B) Tri-probe strategy. (Left) Fluorescent images of tri-probe condition show the RIBOmap signal of ACTB mRNA in HeLa cells. (Middle) Fluorescent images of negative control samples without the primer or splint probe show minimum DNA amplicon signal. (Right) Fluorescent images of the control sample using a splint probe without the rRNA hybridization sequence show minimal DNA amplicon signal. (C) Quantification of the DNA amplicon signal intensity shown in (B). Error bars, standard deviation. n = 3 images per condition. Student’s t-test, **P < 0.01.
Fig. 2.
Fig. 2.. RIBOmap specificity validation.
(A) Schematic of RIBOmap signal verification by targeting mRNA (ACTB) and noncoding RNA (MALAT 1 and vtRNA1–1). (B) Fluorescent images show RNA detection results by STARmap and translating RNA detection results by RIBOmap. (C) Quantification of the DNA amplicon signal intensity shown in (B). Error bars, standard deviation. n = 5 images per condition. Student’s t-test, ****P < 0.0001. (D) Schematic of translational regulation by Harringtonine. (E) Three pairs of padlock and primer probes targeting different sites of ACTB mRNA. (F) Fluorescent images show the RIBOmap signal of 3 sets of probes targeted to different regions of ACTB mRNA in HeLa cells before and after Harringtonine treatment. (G) Quantification of the RIBOmap signal intensity shown in (F). Error bars, standard deviation. n = 3 images per condition. Student’s t-test, **P < 0.01. (H) Schematic representation of RIBOmap signal verification using transfected IVT mRNAs. (I) Fluorescent images show RNA detection of transfected Firefly mRNA and Renilla mRNA by STARmap. The lipofectamine vesicles are labeled by red arrows. (J) Fluorescent images show RNA detection results of transfected Renilla mRNA by STARmap and translating RNA detection of transfected Firefly mRNA by RIBOmap. The lipofectamine vesicles are labeled as in (I).
Fig. 3.
Fig. 3.. RIBOmap simultaneously measures the subcellular translation of 981 genes in human HeLa cells.
(A) Schematic of RIBOmap detection in HeLa FUCCI cells to measure localized mRNA translation. (B) Representative images showing the sequential mapping of FUCCI fluorescence signal, cDNA amplicons, and organelle staining in the same HeLa cell sample. (Left) the FUCCI cell fluorescence imaging results for RIBOmap (upper) and STARmap (bottom). (Middle) Representative images showing the maximum intensity projections (MAX) of the first sequencing cycle with zoom-in views of a representative cell and single-frame views of the representative cell across six sequencing cycles. (Right) magnified view of organelle staining of a representative cell. (C) Diffusion map embeddings of cell-cycle stage clusters determined using the single-cell expression profile for STARmap (upper left) and RIBOmap (upper right) measurements along with corresponding protein fluorescence profiles of the FUCCI cell-cycle markers (STARmap, bottom left; RIBOmap, bottom right). (D) Single-cell translatome covariation matrix showing the pairwise Pearson’s correlation coefficients of the cell-to-cell variation, shown together with their averaged expression levels. Five strongly correlating blocks of coregulated translation modules (RTMs) are indicated by the gray boxes in the matrix, with RTMs 3 and 5 enlarged on the right. Cell cycle markers are highlighted in the enlarged matrix. (E) Matrix of the pairwise colocalization P-values describing the degree to which the reads of two genes tend to coexist in a sphere of a 3-μm radius in the same cell in RIBOmap results (left) and STARmap results (right), shown together with hierarchical clustering of these genes. The STARmap matrix uses the same order of genes as the RIBOmap matrix. Five strongly correlating blocks of colocalized translation modules (LTMs) are indicated by the gray boxes in the matrix. (F) Bar plots visualizing the most significantly enriched gene ontology (GO) terms (maximum 3) in each of the five LTMs. (G) Enlarged gene matrix of LTMs 3 and 4. (H) A representative cell image showing the spatial distribution of RIBOmap signals of LTMs 3 and 4 genes, overlaid on the ER and cell boundary. (I) Quantification of the ER-localized percentage of genes of LTMs 3 and 4 versus all the detected genes. Wilcoxon signed-rank test, ****P < 0.0001. (J) The overlap percentage of LTM3 genes, LTM4 genes, and all 981 genes with ER-proximal RNAs identified by APEX-RIP.
Fig. 4.
Fig. 4.. Spatially single-cell translatomic profiling of 5413 genes in the mouse brain.
(A) Diagram of the imaged mouse coronal hemibrain region (red box) for RIBOmap. (B) Representative images showing the measurements of localized translation of 5413 genes by RIBOmap in a mouse coronal hemibrain slice. (Left) Maximum intensity (MAX) projection of the first sequencing round, showing all five channels simultaneously. Red square, zoom region. (Middle) Magnified view of three cells showing the MAX projection view of the first sequencing round. (Right) Magnified view of three cells showing the spatial arrangement of amplicons in a single z-frame across nine sequencing rounds. (C) RIBOmap and Allen Brain ISH images (41) showing the expression patterns of the three cell-type marker genes in comparable coronal hemibrain sections. (D and E) Uniform manifold approximation and projection (UMAP) plot visualization of translational profiles of 119,173 cells collected from mouse coronal hemibrains. 11 major cell types (D) and 38 subtypes (E) were identified using Leiden clustering. Cells identified as mixed cells numbered 7559 (see Methods) and were excluded from the downstream analysis. (F) Representative spatial cell type atlas in the imaged coronal hemibrain region using the same color code as in (E). (G) The respective spatial cell maps of six major cell types in the imaged coronal hemibrain region using the same color code as in (E).
Fig. 5.
Fig. 5.. Comparison of spatial translatome and transcriptome in the mouse brain.
(A) Two adjacent mouse brain coronal sections were used for RIBOmap and STARmap, respectively, for generating the spatial cell-type map. (B and C) The correlation of the translatome and transcriptome of the 5413 genes in each cell type (B) and brain region (C). (D) Diffusion map visualization of oligodendrocyte and OPC in RIBOmap samples. (E) Diffusion map with pseudotime trajectory visualization of oligodendrocyte and OPC in RIBOmap sample generated by Monocle 3. (F) Diffusion map showing the normalized expression level of oligodendrocyte lineage marker genes Plp1 and Mbp in oligodendrocytes and OPCs. (G) Cell percentage of oligodendrocyte and OPC population in each brain region of RIBOmap (top) and STARmap (bottom) samples. (H) Cell-resolved spatial map for the oligodendrocyte and OPC population of RIBOmap (left) and STARmap (right) samples. (I) Heatmap showing the gene clustering using RIBOmap and STARmap results in the three oligodendrocyte lineage cell types (left) and the relative translational efficiency (RTE) of these genes in each oligodendrocyte lineage cell type (right). (J) The top 5 significantly enriched GO terms for Module 3 genes. (K) Heatmap showing the RIBOmap results (left), STARmap results (middle), and RTE (right) of example genes in Module 3. (L and M) Heatmap showing the average RTE values of all Module 3 genes (L) and the RTE value of Module 3 example genes (M) in each brain region. (N and O) RIBOmp (left) and STARmap (middle) images show the translation and transcription levels of all Modules 3 genes (N) and two Module 3 example genes (O), respectively. Each dot in the images represents a cell and the dot color represents the expression level. (Right) Spatial map showing the average RTE of all Module 3 genes (N) and the RTE of two Module 3 example genes (O) in each brain region.
Fig. 6.
Fig. 6.. Localized translation in the somata and processes of neuronal and glial cells in the mouse brain.
(A) Magnified sections in the hippocampus and CA1 region showing the different cell types and the interspace. (B) Schematic of a hippocampal slice showing the somata and processes of hippocampal neurons, oligodendrocytes, and astrocytes. (C) Section in the CA1 region showing somata reads (blue) and neuronal and glial processes reads (red). (D) Processes read percentages of individual genes in the 5413-gene RIBOmap measurements, with genes rank-ordered based on their processes reads percentage. Nine example genes were labeled inset. (E) The top 10 significantly enriched GO terms for processes-enriched-translation genes. (F) The top 10 significantly enriched GO terms for somata-enriched translation genes. GO was analyzed by DAVID (see Methods). (G and H) The spatial translation map of representative processes-enriched translation genes (G) and somata-enriched translation genes (H) in the hippocampus, showing somata reads (blue) and processes reads (red). (I and J) The spatial translation map of glial cell marker genes, including examples of processes-enriched translation genes (I) and somata-enriched translation genes (J) in the hippocampus, showing somata reads (blue) and processes reads (red).

References

    1. Alfaro JA et al., The emerging landscape of single-molecule protein sequencing technologies. Nat. Methods 18, 604–617 (2021). doi: 10.1038/s41592-021-01143-1; pmid: 34099939 - DOI - PMC - PubMed
    1. Maier T, Güell M, Serrano L, Correlation of mRNA and protein in complex biological samples. FEBS Lett. 583, 3966–3973 (2009). doi: 10.1016/j.febslet.2009.10.036; pmid: 19850042 - DOI - PubMed
    1. de Sousa Abreu R, Penalva LO, Marcotte EM, Vogel C, Global signatures of protein and mRNA expression levels. Mol. Biosyst. 5, 1512–1526 (2009). doi: 10.1039/b908315d;pmid: 20023718 - DOI - PMC - PubMed
    1. Vogel C, Marcotte EM, Insights into the regulation of protein abundance from proteomic and transcriptomic analyses. Nat. Rev. Genet. 13, 227–232 (2012). doi: 10.1038/nrg3185; pmid: 22411467 - DOI - PMC - PubMed
    1. Schwanhäusser B et al., Global quantification of mammalian gene expression control. Nature 473, 337–342 (2011). doi: 10.1038/nature10098; pmid: 21593866 - DOI - PubMed