. 2023 Jun 29;19(6):e1011015.
doi: 10.1371/journal.ppat.1011015. eCollection 2023 Jun.

An intact S-layer is advantageous to Clostridioides difficile within the host

Affiliations

An intact S-layer is advantageous to Clostridioides difficile within the host

Michael J Ormsby et al. PLoS Pathog. .

Abstract

Clostridioides difficile is responsible for substantial morbidity and mortality in antibiotically-treated, hospitalised, elderly patients, in which toxin production correlates with diarrhoeal disease. While the function of these toxins has been studied in detail, the contribution of other factors, including the paracrystalline surface layer (S-layer), to disease is less well understood. Here, we highlight the essentiality of the S-layer in vivo by reporting the recovery of S-layer variants, following infection with the S-layer-null strain, FM2.5. These variants carry either correction of the original point mutation, or sequence modifications which restored the reading frame, and translation of slpA. Selection of these variant clones was rapid in vivo, and independent of toxin production, with up to 90% of the recovered C. difficile population encoding modified slpA sequence within 24 h post infection. Two variants, subsequently named FM2.5varA and FM2.5varB, were selected for study in greater detail. Structural determination of SlpA from FM2.5varB indicated an alteration in the orientation of protein domains, resulting in a reorganisation of the lattice assembly, and changes in interacting interfaces, which might alter function. Interestingly, variant FM2.5varB displayed an attenuated, FM2.5-like phenotype in vivo compared to FM2.5varA, which caused disease severity more comparable to that of R20291. Comparative RNA sequencing (RNA-Seq) analysis of in vitro grown isolates revealed large changes in gene expression between R20291 and FM2.5. Downregulation of tcdA/tcdB and several genes associated with sporulation and cell wall integrity may account for the reported attenuated phenotype of FM2.5 in vivo. RNA-seq data correlated well with disease severity with the more virulent variant, FM2.5varA, showing s similar profile of gene expression to R20291 in vitro, while the attenuated FM2.5varB showed downregulation of many of the same virulence associated traits as FM2.5. Cumulatively, these data add to a growing body of evidence that the S-layer contributes to C. difficile pathogenesis and disease severity.


Conflict of interest statement

The authors have declared that no competing interests exist.

Figures

Fig 1
Fig 1. SlpA deficient C. difficile FM2.5 causes less severe disease in a murine model of infection.
Female C57/Bl6 mice were challenged with spores of R20291 (green) or FM2.5 (purple), or mock infected with sterile PBS (grey). (a) Weight loss was monitored every 24 h for four consecutive days following infection. Each point is the average of several replicate experiments (n>3), with at least 10 animals per time point. Infection with R20291 strain results in statistically significant weight loss at 24 and 48 hpi, compared to both FM2.5 and PBS, while no significant difference was observed between FM2.5 and PBS at these time points. Mice infected with FM2.5 showed a slightly, but statistically significant, lower weight at 96 hpi, compared to the PBS control group. (b) CFU ml-1 of total (no pattern) and spore recovery (pattern) from faecal material collected at 24 hpi (n = 8, R20291; n = 15, FM2.5) and 72 hpi (n = 7, R20291; n = 14, FM2.5). Variation in sample numbers reflects either difficulties associated with collection from infected mice due to diarrheal symptoms, or loss of individual animals due to disease severity. (c) CFU ml-1 of total (no pattern) and spore recovery (pattern) in caecal contents at 24, 48 and 96 hpi (n = 5 at each time point except R20291 at 24 hpi; n = 4). (d) Toxin activity of caecal content at 24, 48 and 96 hpi; through challenge of Vero cells in vitro (n = 5 at each time point). Results displayed indicate the reciprocal of lowest dilution at which toxin activity could be measured. (e) Histological scoring of sections of the caecum from mice challenged with PBS, R20291 or FM2.5. Results displayed are the mean ± SEM of sections from at four mice per group (indicated by different symbols) with three sections scored from each tissue. (f) Histopathological sections representing caecal (i, ii and iii) sections following challenge with PBS (i); R20291 (ii); or FM2.5 (iii). Scale bars represent 100 μm. Statistical tests were conducted using GraphPad Prism software v.12. Statistical significance is indicated: ns—not significant; *p < 0.05; **p < 0.01; and ***p < 0.001.
Fig 2
Fig 2. Recovery of S-layer variants following in vivo challenge.
Following challenge with spores of R20291 and FM2.5, faecal material was recovered and plated on C. difficile selective chromogenic agar (Biomerieux). (a) Colonies of R20291. A dashed red box indicates the area enlarged to show colony morphology in the panel below. (b) The two colony types of FM2.5. An equivalently sized dashed red boxed area has been enlarged and colonies from each plate are shown below. FM2.5 is indicative of the typical FM2.5-like, smaller colony morphology, while the FM2.5variant is representative of the larger colony type. (c) Sequencing of a region of slpA shows the nucleotide and protein sequence of SlpAR20291 (green); the nucleotide insertion (red) in SlpAFM2.5 (light purple), introducing a stop codon that results in premature translational termination, leading to truncation of the SlpA protein. A single nucleotide deletion (light blue) in the SlpAFM2.5 sequence, results in the modification of 3 amino acids (shown in light blue) in SlpAvarA, (dark blue); a five-nucleotide insertion (light crimson) in SlpAFM2.5 sequence results in modification of 13 amino acids (shown in light crimson) in SlpAvarB (crimson). These modifications in the sequence of SlpAvarA and SlpAvarB, restore the reading frame of slpA, allowing transcription and translation of the entire protein. (d) SDS-PAGE analysis of surface layer proteins extracted by low pH preparation. Lane 1: MW Marker; Lane 2: R20291; Lane 3: FM2.5; Lane 4: FM2.5varA; Lane 5: FM2.5varB. (e) Western immunoblot analysis using an anti-SLPH antibody. (f) Western immunoblot analysis using an anti-SLPL antibody. Bands corresponding to SLPL and SLPH indicated with blue and gold arrowheads, respectively. (g) Relative proportion of SlpAFM2.5 and SlpAvarC sequences in samples analysed in both the spore preparations used for mouse inoculations, and in faecal samples recovered up to 10 days post infection. Raw images are provided in S3 Fig.
Fig 3
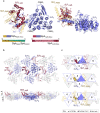
Fig 3. Structure of SlpAvarB shows a different assembly arrangement.
(a) Structural model of SlpAvarB (SLPL—pale red, SLPH—slate blue, PDB ID: 8BBY), superimposed on the R20291-derived SlpARΔD2 model (SLPL—gold, SLPH—slate blue, semi-transparent), with the rotation angle of the D1 and LID/HID domains shown by an arrow. Three distinct structural features are observed: SLPH, LID/HID and D1. Cartoon representation of the SLPH/SLPL (H/L) complex, as seen from the environmental side (left) and side view (right). Sequence of α2L, with paler colours indicating differences, is shown schematically. (b) Cartoon representation of the H/L planar array (PDB ID 8BBY, interacting molecules coloured and viewed as in a). (c) 2D schematic of H/L complex crystal packing in SlpAvarB (top), SlpARΔD2 (centre) and SlpACD630 (bottom), indicating the interaction network linking a single H/L (slate blue/crimson or slate blue/gold) complex with neighbouring molecules in a planar arrangement generated by SLPH tiling. The missing D2 in the SlpAvarB model is represented as dashed lines. Notably, D1-D1 interactions seen in other models are missing in SlpAvarB and the SLPH tiles are shifted, with new HID-CWB23 interactions stabilising the lattice. Array is depicted as seen from the extracellular environment, with symbols representing key interaction types in the crystal lattice, detailed in S2 Table.
Fig 4
Fig 4. In vivo challenge of mice with FM2.5ΔPaLoc.
Female C57/Bl6 mice were challenged with spores of R20291 (green), FM2.5 (purple) and FM2.5ΔPaLoc (blue) or PBS (grey). (a) Weight loss was monitored every 24 h for four consecutive days following infection. Each point is the average change of weight, calculated from a minimum of 5 mice per group. (b) Comparison of the sequences of slpA shows the sequence for R20291 (green) and the reported insertion in FM2.5 (red) responsible for the truncation of the SlpA protein; deletion of four nucleotides (orange) leads to changes in four amino acids (light orange) in the sequence in FM2.5ΔPalocvarD (orange). For comparison, the intact sequence of slpA from R20291 is shown in green. Statistical tests were conducted using GraphPad Prism software v.12. Statistical significance is indicated: ns—not significant; *p < 0.05; **p < 0.01; and ***p < 0.001.
Fig 5
Fig 5. Functional analysis of FM2.5varA and FM2.5varB in vivo and in vitro.
(a) Female C57/Bl6 mice were challenged with spores of R20291, FM2.5, FM2.5varA, FM2.5varB or mock infected with sterile PBS. Weight loss was monitored at the same timepoint each day for four consecutive days following infection. Each point shows the average weight change for a minimum of 5 animals per treatment. (b) In vitro toxin activity as measured through challenge of Vero cells. Samples were prepared by filtering supernatant following growth of C. difficile in vitro for 36 or 72 h; activity was measured by the challenge of Vero cells. Supernatants were harvested at the same phase of growth for each strain. Cells treated with PBS or with purified Toxin B were included as negative and positive controls respectively. OD600 represents the optical density of Giemsa stain incorporated and released from intact Vero cells, hence high OD represents limited toxicity. Results displayed are the mean ± SEM of at least three independent replicates. Statistical tests were conducted using GraphPad Prism software v.12. Statistical significance is indicated: ns—not significant; *p < 0.05; **p < 0.01; and ***p < 0.001.
Fig 6
Fig 6. Global transcriptional differences between isolates of C. difficile following in vitro growth.
Analysis of mRNA recovered from in vitro grown cultures of C. difficile isolates R20291, FM2.5, FM2.5varA and FM2.5varB. (a) Total number of differentially expressed genes (DEGs) between experimental groups are highlighted in turquoise (upregulated) and orange (downregulated). (b) DEGs from experimental comparison of R20291 and FM2.5 were categorised based on function. (c) Transcriptional differences in select genes of FM2.5, FM2.5varA and FM2.5varB relative to R20291. Lists of all identified differentially expressed genes are provided (S1 Spreadsheet).

References

    1. Smits WK, Lyras D, Lacy DB, Wilcox MH, Kuijper EJ. Clostridium difficile infection. Nat Rev Dis Primers. 2016;2: 1–20. doi: 10.1038/NRDP.2016.20 - DOI - PMC - PubMed
    1. Braun V, Hundsberger T, Leukel P, Sauerborn M, von Eichel-Streiber C. Definition of the single integration site of the pathogenicity locus in Clostridium difficile. Gene. 1996;181: 29–38. doi: 10.1016/S0378-1119(96)00398-8 - DOI - PubMed
    1. Chandrasekaran R, Lacy DB. The role of toxins in Clostridium difficile infection. FEMS Microbiology Reviews. Oxford University Press; 2017. pp. 723–750. doi: 10.1093/femsre/fux048 - DOI - PMC - PubMed
    1. Cartman ST, Kelly ML, Heeg D, Heap JT, Minton NP. Precise manipulation of the Clostridium difficile chromosome reveals a lack of association between the tcdC genotype and toxin production. Appl Environ Microbiol. 2012;78: 4683–4690. doi: 10.1128/AEM.00249-12 - DOI - PMC - PubMed
    1. Theriot CM, Koumpouras CC, Carlson PE, Bergin II, Aronoff DM, Young VB. Cefoperazone-treated mice as an experimental platform to assess differential virulence of Clostridium difficile strains. Gut Microbes. 2011;2: 326–334. doi: 10.4161/GMIC.19142 - DOI - PMC - PubMed

Substances