. 2023 Jul 20;186(15):3307-3324.e30.
doi: 10.1016/j.cell.2023.05.044. Epub 2023 Jun 28.

Dynamic mapping of proteome trafficking within and between living cells by TransitID

Affiliations

Dynamic mapping of proteome trafficking within and between living cells by TransitID

Wei Qin et al. Cell. .

Abstract

The ability to map trafficking for thousands of endogenous proteins at once in living cells would reveal biology currently invisible to both microscopy and mass spectrometry. Here, we report TransitID, a method for unbiased mapping of endogenous proteome trafficking with nanometer spatial resolution in living cells. Two proximity labeling (PL) enzymes, TurboID and APEX, are targeted to source and destination compartments, and PL with each enzyme is performed in tandem via sequential addition of their small-molecule substrates. Mass spectrometry identifies the proteins tagged by both enzymes. Using TransitID, we mapped proteome trafficking between cytosol and mitochondria, cytosol and nucleus, and nucleolus and stress granules (SGs), uncovering a role for SGs in protecting the transcription factor JUN from oxidative stress. TransitID also identifies proteins that signal intercellularly between macrophages and cancer cells. TransitID offers a powerful approach for distinguishing protein populations based on compartment or cell type of origin.

Keywords: JUN; intercellular signaling; membraneless organelles; protein trafficking; proximity labeling; spatial proteomics; stress granules; tumor-associated macrophages.


Conflict of interest statement

Declaration of interests A.Y.T. is a scientific advisor to Third Rock Ventures and Nereid Therapeutics.

Figures
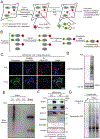
Figure 1.
Figure 1.. Development of TransitID and characterization of APEX-catalyzed alkyne-phenol labeling. See also Figure S1.
A. Scheme showing TransitID in cells with TurboID-catalyzed biotinylation in the “source” location, followed by APEX-catalyzed alkyne tagging in the “destination” location. B. Dual enrichment to capture proteins tagged by both TurboID and APEX2. Red B, biotin. Green F, fluorescein. CuAAC, copper-catalyzed azide-alkyne cycloaddition. C. Confocal fluorescence imaging of mitochondrial proteins labeled by APEX2 and alkyne-phenol, click with azide-fluorescein after cell fixation to visualize alkyne-tagged proteins. TOMM20 represents mitochondria. V5 is fused to APEX2. Scale bar, 10 μm. D. Anti-fluorescein blotting of mitochondrial proteins labeled by APEX2 and alkyne-phenol, click with azide-fluorescein on cell lysate. E. Anti-fluorescein IP of APEX-labeled proteins. All proteins were captured in the first elution from beads. F. Blotting for protein markers in APEX-labeled, anti-fluorescein antibody-enriched material. GRSF1, SDHA and MT-CO1 are mitochondrial matrix proteins. Negative controls are TOMM20 and SYNJ2BP (OMM) and GAPDH (cytosol). Traditional mito-APEX2 + biotin-phenol labeling and streptavidin enrichment was performed for comparison. G. Biotin washout stops TurboID labeling. HEK293T cells expressing TurboID-NES were labeled with biotin for 10 minutes, then washed for 0, 1, or 2 hours before cell lysis and streptavidin blot analysis. No increase in proteome biotinylation was observed under the 1- or 2-hour wash conditions.
Figure 2:
Figure 2:. Validation of TransitID for cytosol to mitochondrial matrix proteome trafficking.
A. Labeling protocol used. NES, nuclear export signal. B. Streptavidin and anti-fluorescein blotting of whole cell lysates from (A) with negative controls omitting biotin or H2O2. C. Silver staining of enriched proteins after first anti-fluorescein IP (left) and second streptavidin bead enrichment (right). D. Blotting for specific protein markers in samples from (A) after cell lysis (left), anti-fluorescein IP (middle), and second streptavidin enrichment (right). GRSF1 and SDHA are true-positive nuclear-encoded mitochondrial proteins that are translated in the cytosol. mtDNA-encoded proteins are translated in the mitochondria. TOMM20 and SYNJ2BP (OMM) and GAPDH (cytosolic) are true negatives.
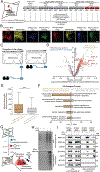
Figure 3.
Figure 3.. TransitID distinguishes mitochondrial matrix proteins by compartment of origin. See also Figure S2 and Table S1.
A. 15-plex TMT proteomic experiment design. B. Confocal imaging of TurboID- and APEX2-dual labeled samples. Neutravidin detects biotinylated proteins. Scale bar, 10 μm. C. Schematic comparing local (at OMM) versus distal (in cytosol) translation of mitochondrial proteins. D. Volcano plot showing relative enrichment of proteins in OMM-to-mito samples versus cytosol-to-mito samples. E. Comparison of mitochondrial protein uptake rates according to the mePRODmt dataset. F. GO biological process analysis of OMM-enriched translocated proteins and cytosol-enriched translocated proteins. G. Assay to detect newly synthesized proteins proximal to the OMM, via puromycin (OPP) tagging of new polypeptides followed by APEX2-OMM-catalyzed biotinylation. Puromycin-tagged proteins are enriched by Click chemistry and anti-fluorescein IP. H. Silver staining of samples from G, after anti-fluorescein IP (top) and after second streptavidin bead enrichment step (bottom). I. Blotting of known protein markers in enriched samples. MRPL30, MRPL48 and HSP60 are enriched in our OMM-to-mito dataset; EIF2AK2 and SIRT5 are enriched in our cytosol-to-mito dataset. MTCO2 (mtDNA-encoded protein) and nucleolin (nucleocytoplasmic) are negative controls.
Figure 4.
Figure 4.. TransitID identifies proteins that traffick from cytosol to nucleus under stress. See also Figure S3 and Table S2.
A. 15-plex TMT proteomic experiment design. B. Confocal imaging of dual-labeled samples under basal and arsenite-induced stress conditions. Neutravidin detects biotinylated proteins. Scale bar, 10 μm. C. Differential enrichment of cytosol-to-nucleus translocated proteins under basal (x-axis) versus arsenite-treated stress conditions (y-axis). Red-highlighted proteins are stress-sensitive proteins; blue-highlighted proteins are stress-insensitive proteins. D. Validation of stress-sensitive and stress-insensitive proteins using TurboID labeling followed by nuclear fractionation. E. GO biological process analysis of stress-sensitive and stress-insensitive cytosol-to-nucleus translocated proteins. F. Confocal imaging of three stress-sensitive cytosol-to-nucleus translocated proteins under arsenite, with respect to endogenous G3BP1, an SG marker. White lines indicate where line plots were generated. Average intensity of translocated proteins in stress granules over the cytosol was quantified. Scale bars, 10 μm. ACTB is a non-SG marker. ***, p < 0.001. Data represented as mean ± SEM. G. Knockdown of stress-insensitive translocated proteins (MBD1 or TOPBP1), but not stress-sensitive proteins (ERC1, POLR2D or ST13), impairs cell viability under arsenite stress. Data represented as mean ± SEM.
Figure 5.
Figure 5.. Proteome trafficking between nucleolus and stress granules mapped with TransitID. See also Figure S4-5 and Table S3-4.
A. TransitID labeling of nucleus/nucleolus-to-SG translocating proteins upon arsenite-induced oxidative stress. B. TransitID labeling of SG-to-nucleus/nucleolus translocating proteins during stress recovery. C-D. Confocal imaging of dual-labeled samples corresponding to experiments in (A) and (B), respectively. Neutravidin detects biotinylated proteins. Scale bars, 10 μm. E-F Design of proteomic samples corresponding to experiments in (A) and (B), respectively. G. Proteins enriched in the 4 indicated datasets. H. Phase separation propensity (PScore) of proteins enriched in each dataset in (G). I. Percent intrinsic disordered regions (%IDR) for proteins in each dataset in (G). J. Heatmap showing proteins enriched in the faster (15-min) versus slower (1-hour) pulse-chase experiment. Red indicates faster-translocating proteins; blue indicates slower-translocating proteins. K. Same analysis as in (J), for the SG-to-nucleus/nucleolus dataset, comparing enrichment in the 1-hour versus 3-hour pulse-chase experiment.
Figure 6.
Figure 6.. Stress granules protect JUN from degradation and enable rapid recovery from stress. See also Figure S6.
A. Confocal imaging of endogenous JUN under basal, stress and recovery conditions. Arrows point to JUN at SGs. Scale bar, 10 μm. B. Imaging of HeLa cells expressing photoactivatable JUN (paGFP-JUN) and SG marker (mCherry-PABP) during stress recovery. Immediately after arsenite washout, the indicated region (white arrow) was activated by 405-nm laser and GFP was imaged. Scale bar, 10 μm. C. Analysis of JUN aggregation. Total JUN and several other proteins were quantified in soluble versus SDS-resistant insoluble fractions from lysates of wild-type HEK293T cells and G3BP1&2 double knockout (DKO) cells. D. Pulse-chase labeling to examine degradation of SG- versus nuclear-localized JUN during stress recovery. HEK293T cells expressing LOV-Turbo1-G3BP1 or LOV-Turbo-NLS were labeled with biotin and blue light for 30 minutes concurrent with arsenite treatment. Cells were then lysed at 0-, 1-, 2-, or 3-hour timepoints after arsenite washout, and streptavidin-enriched materials were blotted with anti-JUN antibody. Quantification from three biological replicates shown below. ***, p < 0.001. Data represented as mean ± SEM. E. Detection of JUN complexation with FOS in wild-type HEK293T versus in DKO cells. F. Measurement of JUN activity via ELISA DNA-binding assay. **, p< 0.01. G. Western blot detection of total JUN protein in wild-type HEK293T cells and in G3BP1&2 DKO cells incapable of forming stress granules. Tubulin is a loading control. H. Measurement of JUN DNA binding activity by ELISA, with and without inhibition of JNK. I. Model for how SGs protect JUN during cellular stress.
Figure 7.
Figure 7.. Detection of intercellular protein communication between cancer cells and macrophages by TransitID. See also Figure S7 and Table S5.
A. TransitID labeling of proteins that originate from cancer cell cytosol and traffick to macrophage cytosol. NES, nuclear export sequence. AP, alkyne-phenol. B. Confocal imaging of co-cultured MC38 cancer cells (expressing TurboID-NES) and Raw264.7 macrophages (expressing APEX2-NES). Cells were treated as in (A), then fixed and stained with neutravidin to detect biotinylated proteins. Scale bar, 10 μm. C. Design of proteomic samples for experiment in (A). GW4869 and L778123 are inhibitors of exosome and nanotube-based transport, respectively. D. Cancer cell-to-macrophage translocated proteins identified by TransitID proteomics. Mitochondrial annotation from MitoCarta3. Secretory annotation from previous secretomics study. E. TransitID labeling of proteins secreted from macrophages that traffick to the surface of cancer cells following cytokine stimulation. The medium from Raw264.7 cells was collected and added to MC38 cells expressing extracellular membrane-targeted horseradish peroxidase (HRP-TM). F. Blotting of specific protein markers in samples from (E) after tandem enrichment. IL-1β and TNF-α are cytokines known to be released by M1-type macrophages stimulated by IFN-γ. TGF-β and IL-10 are cytokines known to be released by M2-type macrophages stimulated by IL-4.

Update of

Similar articles

Cited by

References

    1. Cook KC, and Cristea IM (2019). Location is everything: protein translocations as a viral infection strategy. Curr Opin Chem Biol 48, 34. 10.1016/J.CBPA.2018.09.021. - DOI - PMC - PubMed
    1. Jones S, and Rappoport JZ (2014). Interdependent epidermal growth factor receptor signalling and trafficking. Int J Biochem Cell Biol 51, 23–28. 10.1016/J.BIOCEL.2014.03.014. - DOI - PubMed
    1. Qin W, Cho KF, Cavanagh PE, and Ting AY (2021). Deciphering molecular interactions by proximity labeling. Nat Methods 18, 133–143. 10.1038/S41592-02001010-5. - DOI - PMC - PubMed
    1. Lam SS, Martell JD, Kamer KJ, Deerinck TJ, Ellisman MH, Mootha VK, and Ting AY (2015). Directed evolution of APEX2 for electron microscopy and proximity labeling. Nat Methods 12, 51–54. 10.1038/NMETH.3179. - DOI - PMC - PubMed
    1. Roux KJ, Kim DI, Raida M, and Burke B. (2012). A promiscuous biotin ligase fusion protein identifies proximal and interacting proteins in mammalian cells. J Cell Biol 196, 801–810. 10.1083/JCB.201112098. - DOI - PMC - PubMed

Publication types

MeSH terms

LinkOut - more resources