. 2023 Sep:146:155644.
doi: 10.1016/j.metabol.2023.155644. Epub 2023 Jun 28.

The N-degron pathway mediates lipophagy: The chemical modulation of lipophagy in obesity and NAFLD

Affiliations

The N-degron pathway mediates lipophagy: The chemical modulation of lipophagy in obesity and NAFLD

Eui Jung Jung et al. Metabolism. 2023 Sep.

Abstract

Background and aims: Central to the pathogenesis of nonalcoholic fatty liver disease (NAFLD) is the accumulation of lipids in the liver and various fat tissues. We aimed to elucidate the mechanisms by which lipid droplets (LDs) in the liver and adipocytes are degraded by the autophagy-lysosome system and develop therapeutic means to modulate lipophagy, i.e., autophagic degradation of LDs.

Methods: We monitored the process in which LDs are pinched off by autophagic membranes and degraded by lysosomal hydrolases in cultured cells and mice. The autophagic receptor p62/SQSTM-1/Sequestosome-1 was identified as a key regulator and used as a target to develop drugs to induce lipophagy. The efficacy of p62 agonists was validated in mice to treat hepatosteatosis and obesity.

Results: We found that the N-degron pathway modulates lipophagy. This autophagic degradation initiates when the molecular chaperones including BiP/GRP78, retro-translocated from the endoplasmic reticulum, is N-terminally (Nt-) arginylated by ATE1 R-transferase. The resulting Nt-arginine (Nt-Arg) binds the ZZ domain of p62 associated with LDs. Upon binding to Nt-Arg, p62 undergoes self-polymerization and recruits LC3+ phagophores to the site of lipophagy, leading to lysosomal degradation. Liver-specific Ate1 conditional knockout mice under high fat diet developed severe NAFLD. The Nt-Arg was modified into small molecule agonists to p62 that facilitate lipophagy in mice and exerted therapeutic efficacy in obesity and hepatosteatosis of wild-type but not p62 knockout mice.

Conclusions: Our results show that the N-degron pathway modulates lipophagy and provide p62 as a drug target to treat NAFLD and other diseases related with metabolic syndrome.

Keywords: Hepatosteatosis; Lipid droplet; N-terminal arginylation; Obesity; The autophagy-lysosome system; p62/SQSTM1/Sequestosome-1.


Conflict of interest statement

Declaration of competing interest Seoul National University and AUTOTAC Bio, Inc. have filed patent applications based on this study.

Figures
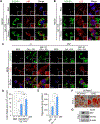
Fig. 1.
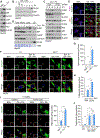
Fig. 1.. p62 is required for autophagic degradation of lipid droplets.
(A) Immunocytochemistry (ICC) of p62 and BODIPY staining of lipid droplets (LDs) in HepG2 cells exposed to oleic acid (OA) (1 mM, 24 h) and palmitic acid (PA) (500 μM, 24 h) with or without sequential serum starvation (24 h). Scale bar, 10 μm. (B) ICC of LC3 and BODIPY signals in HepG2 cells exposed to OA/PA (1 mM/500 μM, 24 h) with or without sequential serum starvation. Scale bar, 10 μm. (C) ICC of LC3 and BODIPY signals in WT and p62−/− MEFs exposed to OA/PA (1 mM/500 μM, 24 h), with or without sequential treatment of bafilomycin A1 (Baf. A1) (200 nM, 4 h). Scale bar, 10 μm. (D) Quantification of LD area by ImageJ (n = 50 cells). (E) Enzyme-linked immunosorbent assay (ELISA) for triglyceride (TG) quantification (n = 4). (F) Oil Red O staining of 3T3L1 cells under siRNA-mediated knockdown of p62 (80 nM, 48 h). Scale bar, 50 μm. (G) Western blotting (WB) of 3T3L1 cells following RNA interference of p62 (80 nM, 48 h). *P < 0.05, **P < 0.01, ***P < 0.001, n.s., not significant.
Fig. 2.
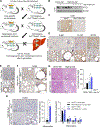
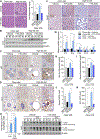
Fig. 2.. Nt-Arg of proteins generated by ATE1 propagates lipophagy.
(A) WB of HepG2 cells following treatment of OA/PA (1 mM/500 μM, 9 h). (B) WB of HepG2 cells following treatment of OA/PA (1 mM/500 μM) for indicated time. (C) WB of HepG2 cells under siRNA-mediated knockdown of ATE1 (80 nM, 48 h) with sequential treatment of OA (1 mM) and PA (500 μM) for indicated time. (D) HepG2 cells treated with OA/PA (1 mM/500 μM) for 9 h were fractionated. Whole cell lysates (Total) in comparison with microsome (Micro.), cytosol (Cyto.) and LD fractions were analyzed by WB. Coomassie brilliant blue (CBB) staining of the gel was used to confirm the protein loading. (E) ICC of p62, N-terminal arginylated BiP (R-BiP) and BODIPY signals in Hep3B cells exposed to OA/PA (1 mM/500 μM, 24 h). Scale bar, 10 μm. (F) ICC of p62 and BODIPY signals and (G) quantification of LD area (n = 50 cells) in WT and Ate1−/− MEFs exposed to OA (2 mM, 24 h) and PA (1 mM, 24 h), with or without sequential treatment of Baf. A1 (200 nM, 4 h). Scale bar, 10 μm. (H) TG quantification of WT and Ate1−/− MEFs exposed to conjugating vehicle, bovine serum albumin (BSA), alone or OA/PA (2 mM/1 mM) for 24 h (n = 4). (I) ICC of p62 and BODIPY signals (left panel) and TG quantification (right panel, n = 4) in MEFs treated with tannic acid (TA, 10 μM, 24 h), OA/PA (1 mM/500 μM), or both. Scale bar, 10 μm. (J) TG quantification of WT and Ate1−/− MEFs exposed to OA (2mM, 24 h) and PA (1 mM, 24 h), with or without sequential treatment of Lalistat-1 (30 μM, 24 h). *P < 0.05, **P < 0.01, ***P < 0.001, n.s., not significant.
Fig. 3.
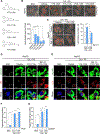
Fig. 3.. The N-terminal arginylated BiP triggers lipophagy via binding to p62-ZZ domain
(A) Fluorescence of R-BiP-RFP, E-BiP-RFP, V-BIP-RFP, p62 and BODIPY in HepG2 cells upon OA/PA (1 mM/500 μM) loading for 24 h. (B) Schematic of recombinant p62 constructs used. (C) ICC of p62 and BODIPY signals in Hep3B cells expressing p62-full length (p62FL, left panel) or p62-ZZ mutants (p62ΔZZ, right panel), with sequential treatment of OA/PA (1 mM/500 μM, 24 h) and serum starvation (24 h). Scale bar, 10 μm. (D) Scheme of the formation of Nt-arginylated proteins during lipotoxic stress.
Fig. 4.
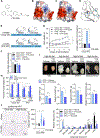
Fig. 4.. Liver-specific Ate1 ablation aggravates non-alcoholic hepatosteatosis and its progression to steatohepatitis.
(A) Scheme of generating liver-specific Ate1 knockout mouse. Liver-specific Ate1 knockout mice and their littermate controls were fed with HFD (45% kcal fat) for 16 weeks. (B) WB and (C) IHC staining of hepatic ATE1 in liver-specific Ate1 knockout mice. Scale bars, 100 μm. IHC staining of hepatic (D) R-BiP, R-CRT, R-PDI, and (E) p62 upon HFD feeding. Scale bars, 20 μm or 10 μm (right column or inside box). (F) IHC staining of hepatic R-BiP in liver-specific Ate1 knockout mice. Scale bars, 20 μm (left column), 10 μm (right column). (G) Hematoxylin & eosin (H & E) staining (left panel) and TG quantification (right panel, n = 5) of liver-specific Ate1 knockout liver and their littermate control liver. Scale bars, 100 μm. (H) IHC staining of F4/80 (left panel) and mRNA levels of Tnfa (middle panel), Il6, Il1b, Ccr2, and Ccl2 (right panel) in liver-specific Ate1 knockout mice and their littermate controls. Scale bars, 200 μm (left column), 25 μm (right column). *P < 0.05, **P < 0.01, ***P < 0.001.
Fig. 5.
Fig. 5.. Chemical mimicry of the N-degron Arg modulates lipophagy.
(A) Chemical structures of p62-ZZ ligands. (B) Oil Red O staining of fatty acid-loaded HepG2 cells treated with p62-ZZ ligands (5 μM, 24 h, upper panel) and quantification of LD area by ImageJ (n = 50 cells, lower panel). Scale bar, 50 μm. (C) Oil Red O staining of HepG2 cells treated with YTK-1105 (5 μM, 24 h), Baf. A1 (200 nM, 4 h), or both (left panel), and quantification of LD area (right panel, n = 50 cells). Scale bar, 50 μm. (D) ICC of p62 and BODIPY signals in HepG2 cells treated with YTK-1105 (5 μM, 24 h), Baf. A1 (200 nM, 4 h), or both. Scale bar, 10 μm. (E) ICC of LC3 and BODIPY signals in HepG2 cells treated with YTK-1105 (5 μM, 24 h), Baf. A1 (200 nM, 4 h), or both. Scale bar, 10 μm. TG quantification of HepG2 cells exposed to OA (600 μM, 24 h) and PA (300 μM, 24 h), with or without treatment of (F) hydroxychloroquine (HCQ, 25 μM, 18 h) or (G) Lalistat-1 (80 μM, 24 h). *P < 0.05, **P < 0.01, ***P < 0.001.
Fig. 6.
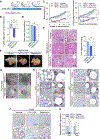
Fig. 6.. A novel p62-ZZ ligand, YTK-2205 administration reduces fat pad size without loss of muscle.
(A) Chemical structure of YTK-2205. (B and C) Docking analysis of YTK-2205 with p62. (D) 3D binding modes and interaction of YTK-2205 with p62. (E) Scheme of YTK-2205 injection in high fat diet (HFD)-induced overweight murine model. (F) Food intake during compound administration (n = 8). (G) Body weight changes during compound administration (left panel, n = 8). Percent body weight changes compared with baseline at the time of sacrifice (right panel, n = 8). (H) Body composition measured by TD-NMR after 11 weeks of compound administration (n = 8). (I) Gross morphology (upper panel) and organ weights (lower panel) of fat pads and gastrocnemius muscle after 11 weeks of compound administration (n = 8). BAT, brown adipose tissue; eWAT, epididymal white adipose tissue; rpWAT, retroperitoneal white adipose tissue. (J) H & E stained eWAT (left panel) and quantification of adipocyte size (middle and right panels, n = 50) treated with YTK-2205 or vehicle. Scale bar, 100 μm. *P < 0.05, **P < 0.01, ***P < 0.001, n.s., not significant.
Fig. 7.
Fig. 7.. Intraperitoneal injection of YTK-2205 mitigates NAFLD in high fat diet fed mice.
(A) H & E staining (left panel) and TG levels (right panel, n = 8) of liver treated with YTK-2205 or vehicle. Scale bars, 50 μm. (B) WB of liver samples treated with YTK-2205 or vehicle. IHC staining of (C) p62 and (D) LC3 in liver treated with YTK-2205 or vehicle. Scale bars, 40 μm (upper row), 5 μm (lower row). (E) WB of liver samples treated with YTK-2205 (20 mg/kg) or vehicle, with or without chloroquine (100 mg/kg, 5 h). (F) IHC staining of F4/80 in liver treated with YTK-2205 or vehicle. Scale bars, 200 μm (upper row), 25 μm (lower row). (G) Relative mRNA levels of inflammatory cytokines in liver treated with YTK-2205 or vehicle (n = 8). Serum levels of (H) triglyceride, (I) total cholesterol, (J) non-esterified fatty acids (NEFA), and (K) alanine aminotransferase in mice treated with YTK-2205 or vehicle (n = 8). *P < 0.05, **P < 0.01, ***P < 0.001, n.s., not significant.
Fig. 8.
Fig. 8.. YTK-2205 exerts therapeutic efficacy in obesity and hepatosteatosis via p62.
(A) Injection timeline and details of YTK-1105 in HFD-induced obese murine model of p62−/− and +/+ mice. (B) Body weight changes during compound administration in p62−/− and +/+ mice. (left panel, n = 5). Percent body weight changes compared with baseline at the time of sacrifice (right panel, n = 5). (C) Weight of compound treated livers in p62−/− and +/+ mice (n = 5). (D) H & E staining (left panel) and TG levels (right panel, n = 5) of p62−/− and +/+ liver treated with YTK-2205 or vehicle. Scale bars, 50 μm. (E) WB of p62−/− and +/+ liver samples treated with YTK-2205 or vehicle. (F) IHC staining of LC3 in p62−/− and +/+ liver treated with YTK-2205 or vehicle. Scale bars, 50 μm (left column), 5 μm (right column).
Fig. 9.
Fig. 9.. YTK-1105, a p62-ZZ ligand, displays a stronger therapeutic efficacy in NAFLD and obesity compared with rapamycin, a bulk autophagy inducer, in diet-induced obese mice.
(A) Injection timeline and details of YTK-1105 and rapamycin in HFD-induced obese murine model. (B) Weight gain after 1 week of compound injection (n = 5). (C) Body weight changes during compound administration (left panel, n = 5). Percent body weight changes compared with baseline at the time of sacrifice (right panel, n = 5). (D) Food intake during compound administration (n = 5). (E) Gross morphology of compound treated livers. (F) H & E staining (left panel) and TG levels (right panel, n = 5) in liver treated with YTK-1105, rapamycin, or vehicle. Scale bars, 200 μm (left column), 100 μm (right column). (G) Transmission electron microscopy of liver treated YTK-1105 or vehicle. The autophagosome fused with a LD is indicated by a yellow arrow. Scale bar, 5 μm. IHC staining of (H) LC3 and (I) p62 in liver treated with YTK-1105, rapamycin, or vehicle. Scale bars, 20 μm (left column), 5 μm (right column). (J) IHC staining of F4/80 and (K) mRNA levels of Ccr2 and Tnfa (right panel, n = 5) in liver treated with YTK-1105, rapamycin, or vehicle. Scale bars, 200 μm (upper row), 25 μm (lower row). *P < 0.05, **P < 0.01, ***P < 0.001, n.s., not significant.

Similar articles

Cited by

References

    1. Byrne CD and Targher G, NAFLD: a multisystem disease. J Hepatol, 2015. 62(1 Suppl): p. S47–64. - PubMed
    1. Onal G, et al., Lipid Droplets in Health and Disease. Lipids Health Dis, 2017. 16(1): p. 128. - PMC - PubMed
    1. Ahmadian M, et al., Triacylglycerol metabolism in adipose tissue. Future Lipidol, 2007. 2(2): p. 229–237. - PMC - PubMed
    1. Singh R, et al., Autophagy regulates lipid metabolism. Nature, 2009. 458(7242): p. 1131–5. - PMC - PubMed
    1. Tasaki T, et al., The N-end rule pathway. Annu Rev Biochem, 2012. 81: p. 261–89. - PMC - PubMed

Publication types

Substances