. 2023 Aug 15;435(16):168190.
doi: 10.1016/j.jmb.2023.168190. Epub 2023 Jun 27.

Influence of HIV-1 Genomic RNA on the Formation of Gag Biomolecular Condensates

Affiliations

Influence of HIV-1 Genomic RNA on the Formation of Gag Biomolecular Condensates

Anne Monette et al. J Mol Biol. .

Abstract

Biomolecular condensates (BMCs) play an important role in the replication of a growing number of viruses, but many important mechanistic details remain to be elucidated. Previously, we demonstrated that the pan-retroviral nucleocapsid (NC) and HIV-1 pr55Gag (Gag) proteins phase separate into condensates, and that HIV-1 protease (PR)-mediated maturation of Gag and Gag-Pol precursor proteins yields self-assembling BMCs that have HIV-1 core architecture. Using biochemical and imaging techniques, we aimed to further characterize the phase separation of HIV-1 Gag by determining which of its intrinsically disordered regions (IDRs) influence the formation of BMCs, and how the HIV-1 viral genomic RNA (gRNA) could influence BMC abundance and size. We found that mutations in the Gag matrix (MA) domain or the NC zinc finger motifs altered condensate number and size in a salt-dependent manner. Gag BMCs were also bimodally influenced by the gRNA, with a condensate-promoting regime at lower protein concentrations and a gel dissolution at higher protein concentrations. Interestingly, incubation of Gag with CD4+ T cell nuclear lysates led to the formation of larger BMCs compared to much smaller ones observed in the presence of cytoplasmic lysates. These findings suggest that the composition and properties of Gag-containing BMCs may be altered by differential association of host factors in nuclear and cytosolic compartments during virus assembly. This study significantly advances our understanding of HIV-1 Gag BMC formation and provides a foundation for future therapeutic targeting of virion assembly.

Keywords: biomolecular condensates; gag polyprotein; human immunodeficiency virus-type 1; phase diagrams; viral genomic RNA.


Conflict of interest statement

Declaration of Competing Interest The authors declare that they have no known competing financial interests or personal relationships that could have appeared to influence the work reported in this paper.

Figures
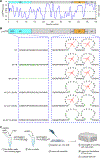
Figure 1.
Figure 1.. Investigations into disorder of the matrix and nucleocapsid viral RNA-binding motifs of HIV-1 Gag.
(A) DisEMBL algorithm-generated depiction of disorder across HIV-1 Gag polyprotein (GenBank: AAC82593.1), demonstrating that the matrix (MA) RNA-binding region (MA-RBD) and nucleocapsid (NC) domains are inherently disordered. (B) Depiction of WT Gag, MA, and NC mutants used in this study. Mutations and/or deletions made to Gag are shown in green, and zinc coordination is shown in red. (C) Depiction of in vitro experimental method used in this study. WT, wild type; NC, nucleocapsid; ZnF, zinc finger; SSHS serine-serine-histidine-serine mutations; 7N, 7 positive to basic residue MA mutations; HBR, highly basic region; D, delta; %, percent; DIC, differential interference contrast.
Figure 2.
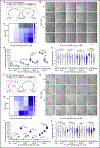
Figure 2.. Effects of HIV-1 Gag double NC zinc finger (ZnF) mutations on phase diagrams and condensate sizes.
Increasing concentrations of (A-E) full-length recombinant WT HIV-1 NL4–3 pr55 Gag or (F-J) the double Gag NC ZnF1 and ZnF2 mutant proteins (i.e., 0–40 μM) were mixed with crowding buffers composed of 20 mM HEPES, 150 mg/ml Ficoll-400, and increasing salt (NaCl, pH 7.4) concentrations (i.e., 0–300 mM). (B and G) Images of phase separated condensates were captured using confocal microscopy and differential interference contrast (DIC), and statistical analyses were performed to create comparative phase diagrams in the form of heat maps (C and I), relative differences in condensate numbers (D and I) and condensate areas (E and J). Heat maps represent the average number (#) of condensates counted per 63 X magnification frame. Grid patterns were then overlaid onto heat map squares to show experimental conditions in which proteins were observed to form gels. NaCl carry-over from stabilizing protein buffer modify the listed salt concentrations from 0, 150, 200, and 300 mM to 30, 180, 260, and 340 mM. Box and whisker and violin plots were pseudocoloured according to heat maps. Statistics represent *, p < 0.05; **, p < 0.01; ***, p < 0.001; ****, p < 0.0001, as derived from one-way ANOVA (with Tukey’s multiple-comparisons test) and 95% CI for multiple comparisons. mM, millimolar; μM, micromolar; μm, micron.
Figure 3.
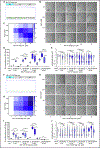
Figure 3.. Effects of HIV-1 Gag single NC zinc finger mutations on phase diagrams and condensate sizes.
Increasing concentrations of (A-E) full-length recombinant Gag NC ZnF1 mutant or (F-J) Gag NC ZnF2 mutant proteins (i.e., 0–40 μM) were mixed with crowding buffers composed of 20 mM HEPES, 150 mg/ml Ficoll-400, and increasing salt (NaCl, pH 7.4) concentrations (i.e., 0–300 mM). (B and G) Images of phase separated condensates were captured using confocal microscopy and differential interference contrast (DIC), and statistical analyses were performed to create comparative phase diagrams in the form of heat maps (C and I), relative differences in condensate numbers (D and I) and condensate areas (E and J). Heat maps represent average number (#) of condensates per 63 X magnification frame. Grid patterns were then overlaid onto heat map squares to show experimental conditions in which proteins were observed to form gels. NaCl carry-over from stabilizing protein buffer modify the listed salt concentrations from 0, 150, 200, and 300 mM to 30, 180, 260, and 340 mM and 40, 200, 290 and 380 mM for the NC ZnF1 and 2 mutants, respectively. Box and whisker and violin plots were pseudocoloured according to heat maps. Statistics represent *, p < 0.05; **, p < 0.01; ***, p < 0.001; ****, p < 0.0001, as derived from one-way ANOVA (with Tukey’s multiple-comparisons test) and 95% CI for multiple comparisons. mM, millimolar; μM, micromolar; μm, micron.
Figure 4.
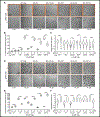
Figure 4.. Effects of HIV-1 Gag MA substitution mutations or RBD deletion on phase diagrams and condensate sizes.
Increasing concentrations of (A-E) full-length recombinant MA 7 N Gag mutant or (F-J) MA Δ15–39 Gag mutant proteins (i.e., 0–40 μM) were mixed with crowding buffers composed of 20 mM HEPES, 150 mg/ml Ficoll-400, and increasing salt (NaCl, pH 7.4) concentrations (i.e., 0–300 mM). (B and G) Images of phase separated condensates were captured using confocal microscopy and differential interference contrast (DIC), and statistical analyses were performed to create comparative phase diagrams in the form of heat maps (C and I), relative differences in condensate numbers (D and I) and condensate areas (E and J). Heat maps represent average number (#) of condensates per 63 X magnification frame. Grid patterns were then overlaid onto heat map squares to show experimental conditions in which proteins were observed to form gels. NaCl carry-over from stabilizing protein buffer modify the listed salt concentrations from 0, 150, 200, and 300 mM to 30, 180, 260, and 340 mM. Box and whisker and violin plots were pseudocoloured according to heat maps. Statistics represent *, p < 0.05; **, p < 0.01; ***, p < 0.001; ****, p < 0.0001, as derived from one-way ANOVA (with Tukey’s multiple-comparisons test) and 95% CI for multiple comparisons. mM, millimolar; μM, micromolar; μm, micron.
Figure 5.
Figure 5.. WT NL4–3 HIV-1 gRNA influences phase separation of HIV-1 pr55 Gag protein.
(A) HIV-1 gRNA to 2400 Gag ratios tested, where 1 reflects one gRNA copy per virus. (B) Increasing concentrations of full-length recombinant HIV-1 NL4–3 pr55 Gag protein (i.e., 0–40 μM) were mixed with crowding buffers composed of 20 mM HEPES, 150 mg/ml Ficoll-400, and 150 mM NaCl, pH 7.4, and in increasing concentrations of HIV-1 NL4–3 gRNA purified from viruses isolated from supernatants of HEK 293 T cells transfected with pNL4–3. Coloured frames surrounding DIC images correspond to conditions in (A). (C) Heat map corresponding to phase diagram from panel (B), as calculated from average number (#) of condensates per 63 X magnification frame, and demonstrating that HIV-1 gRNA induces a biphasic distribution of Gag condensates, where it induces Gag condensates at low protein concentration and dissipates Gag condensates at high protein concentration. Grid patterns placed over squares of heat map demarcate observed gelification of protein. (D) Box and whisker plot corresponding to data from (B) and pseudocoloured according to (C). (E) Violin plots corresponding to areas of condensates calculated from data presented in (B), and pseudocoloured according to (C). Statistics represent ****, p < 0.0001, as derived from one-way ANOVA (with Tukey’s multiple-comparisons test) and 95% CI for multiple comparisons. nM, nanomolar; μM, micromolar; μm, micron.
Figure 6.
Figure 6.. WT NL4–3 HIV-1 gRNA differentially influences phase separation of Gag MA and NC mutant proteins.
(A) 2.5 μM of WT or mutant Gag proteins were mixed with crowding buffers composed of 20 mM HEPES, 150 mg/ml Ficoll-400, and 150 mM NaCl, pH 7.4, and either none or 8 nM of purified NL4–3 gRNA, for imaging using confocal imaging and DIC. Resulting images were analyzed for condensate numbers, as represented by a corresponding box and whisker plot (B), and for areas, as represented by a corresponding violin plot (C). (D) 40 μM of WT or mutant Gag proteins were mixed with crowding buffers composed of 20 mM HEPES, 150 mg/ml Ficoll-400, and 150 mM NaCl, pH 7.4, and either none or 8 nM of purified NL4–3 gRNA, for imaging using confocal imaging and DIC. Resulting images were analyzed for condensate numbers, as represented by a corresponding box and whisker plot (E), and for areas, as represented by a corresponding violin plot (F). Colored DIC image outlines in panels (A) and (D) are representative of the gRNA to Gag ratios presented in Figure 5. Statistics represent **, p < 0.01; ****, p < 0.0001, as derived from one-way ANOVA (with Tukey’s multiple-comparisons test) and 95% CI for multiple comparisons. mM, millimolar; μM, micromolar; μm, micron.
Figure 7.
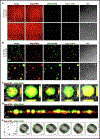
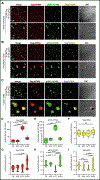
Figure 7.. HIV-1 gRNA dissolves Gag gels into phase separated condensates.
(A) Gag-AF5494 was mixed at 30 μM with crowding buffers composed of 20 mM HEPES, 150 mg/ml Ficoll-400, and 150 mM NaCl, pH 7.4, and was imaged using confocal microscopy and differential interference contrast. (B) Same as in (A), but with the addition of 16 nM of gRNA purified from isolated WT NL4–3 virus that was green-labeled using fluorescence in situ hybridization, demonstrating that the gRNA dissolves red Gag gels into condensates and that these colocalize. (C) Single particle analyses provide evidence that the gRNA can be found both within and outside of Gag condensates, as is also shown using Z-series slice analyses (D), providing evidence of interruption of formation of Gag gels by surface gRNA association with Gag condensates. (E) Three-dimensional surfaces applied to single particle analyses also provide evidence that the gRNA can be found both within and outside of Gag condensates. ∩, colocalization (intersection); μm, micron.
Figure 8.
Figure 8.. Nuclear and cytoplasmic lysates differentially influence Gag condensates.
(A) Gag-AF594 and gRNA-AF488 phase separate into condensates when the crowding buffer is replaced with whole cell lysate from CD4+ T cells, as processed using NP-40 lysis buffer (150 mM NaCl, 10 mM Tris, 0.5% NP-40). (B) Same as in (A), but where the crowding buffer is replaced with cytoplasmic lysate from nuclear-cytoplasmic fractionation. (C) Same as in (A), but where the crowding buffer is replaced nuclear lysate from nuclear-cytoplasmic fractionation. (D-F) Box and whisker plot corresponding to data from (A-C) and Figure 6. (G-I) Violin plots corresponding to areas of condensates calculated from (A-C) and Figure 6. ****, p < 0.0001. CB, crowding buffer; WCL, whole cell extract; CYTL, cytoplasmic cell extract; NUCL, nuclear cell extract. ∩, colocalization (intersection); μm, micron.
Figure 9.
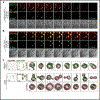
Figure 9.. Nuclear lysates distort the morphology of Gag condensates.
(A) Analyses of Z-series imaging of Gag-AF594 and gRNA-AF488 positive condensates when the crowding buffer is replaced with Jurkat T cell cytoplasmic lysates from nuclear-cytoplasmic fractionation, as processed using NP-40 lysis buffer (150 mM NaCl, 10 mM Tris, 0.5% NP-40). Gag and gRNA co-condensates are visible and colocalization is mostly central to Gag condensates. (B) Same as in (A), but where the crowding buffer is replaced with Jurkat T cell nuclear lysates from nuclear-cytoplasmic fractionation. (C-D) Three-dimensional surfaces applied to single particle analyses show that the gRNA can be found both within and outside of Gag biomolecular condensates (BMC) when cytoplasmic lysates are applied (C), and is (D) mostly found inside of both smaller and larger condensates produced by nuclear lysate generated BMCs. ∩, colocalization (intersection); μm, micron.

Update of

References

    1. Alberti S, Hyman AA, (2021). Biomolecular condensates at the nexus of cellular stress, protein aggregation disease and ageing. Nat. Rev. Mol. Cell Biol. 22, 196–213. - PubMed
    1. Li P, Banjade S, Cheng HC, Kim S, Chen B, Guo L, et al., (2012). Phase transitions in the assembly of multivalent signalling proteins. Nature 483, 336–340. - PMC - PubMed
    1. Espinosa JR, Joseph JA, Sanchez-Burgos I, Garaizar A, Frenkel D, Collepardo-Guevara R, (2020). Liquid network connectivity regulates the stability and composition of biomolecular condensates with many components. PNAS 117, 13238–13247. - PMC - PubMed
    1. Lyon AS, Peeples WB, Rosen MK, (2021). A framework for understanding the functions of biomolecular condensates across scales. Nat. Rev. Mol. Cell Biol. 22, 215–235. - PMC - PubMed
    1. Pessina F, Gioia U, Brandi O, Farina S, Ceccon M, Francia S, et al., (2021). DNA Damage Triggers a New Phase in Neurodegeneration Trends in Genetics. Apr 37 (4), 337–354. - PubMed

Publication types

Substances

LinkOut - more resources