. 2023 Jun 29;14(1):3834.
doi: 10.1038/s41467-023-39486-2.

The proteomic landscape of soft tissue sarcomas

Affiliations

The proteomic landscape of soft tissue sarcomas

Jessica Burns et al. Nat Commun. .

Abstract

Soft tissue sarcomas (STS) are rare and diverse mesenchymal cancers with limited treatment options. Here we undertake comprehensive proteomic profiling of tumour specimens from 321 STS patients representing 11 histological subtypes. Within leiomyosarcomas, we identify three proteomic subtypes with distinct myogenesis and immune features, anatomical site distribution and survival outcomes. Characterisation of undifferentiated pleomorphic sarcomas and dedifferentiated liposarcomas with low infiltrating CD3 + T-lymphocyte levels nominates the complement cascade as a candidate immunotherapeutic target. Comparative analysis of proteomic and transcriptomic profiles highlights the proteomic-specific features for optimal risk stratification in angiosarcomas. Finally, we define functional signatures termed Sarcoma Proteomic Modules which transcend histological subtype classification and show that a vesicle transport protein signature is an independent prognostic factor for distant metastasis. Our study highlights the utility of proteomics for identifying molecular subgroups with implications for risk stratification and therapy selection and provides a rich resource for future sarcoma research.


Conflict of interest statement

The authors declare no competing interests.

Figures

Fig. 1
Fig. 1. Schematic overview of the study.
a, b Pie charts showing the count and percentage breakdown of histological subtypes (a) and anatomical sites (b) within the study cohort. c Overview of the proteomic analysis workflow. AS angiosarcoma, ASPS alveolar soft part sarcoma, CCS clear cell sarcoma, DDLPS dedifferentiated liposarcoma, DES desmoid tumour, DSRCT desmoplastic small round cell tumour, EPS epithelioid sarcoma, LMS leiomyosarcoma, RT rhabdoid tumour, SS synovial sarcoma, UPS undifferentiated pleomorphic sarcoma, FFPE formalin-fixed paraffin-embedded, LC liquid chromatography, MS mass spectrometry.
Fig. 2
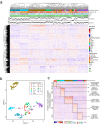
Fig. 2. The proteomic landscape of soft tissue sarcoma.
a Annotated heatmap showing the unsupervised clustering (Pearson’s distance) of 3290 proteins across the study cohort. From top to bottom, panels indicate histological subtype, anatomical site, tumour grade, patient sex, patient age, and tumour size. b Uniform manifold approximation and projection (UMAP) of the proteomic data with individual cases coloured by histological subtype. c Heatmap showing the proteins (n = 1362) uniquely upregulated in histological subtypes with greater than 20 cases in the cohort (FDR < 1%, fold change ≥1.5), sorted by histology. Annotations indicate key proteins (DDLPS & SS) identified by significant analysis of microarray (SAM) and gene sets (AS, DES, LMS, UPS) identified by overrepresentation analysis in each histological subtype (Supplementary Data 4). AS angiosarcoma, ASPS alveolar soft part sarcoma, CCS clear cell sarcoma, DDLPS dedifferentiated liposarcoma, DES desmoid tumour, DSRCT desmoplastic small round cell tumour, EPS epithelioid sarcoma, LMS leiomyosarcoma, RT rhabdoid tumour, SS synovial sarcoma, UPS undifferentiated pleomorphic sarcoma.
Fig. 3
Fig. 3. Leiomyosarcoma (LMS) is comprised of three proteomic subtypes.
a Annotated heatmap showing the unsupervised clustering (Spearman distance) of 3262 proteins across LMS cases (n = 80), arranged by proteomic subtype (top annotation). Bottom annotations indicate key tumour and patient characteristics, and significant (one-way ANOVA; FDR < 0.001) biological features obtained from single sample Gene Set Enrichment Analysis (ssGSEA) of the MSigDB Hallmark gene sets (Supplemental Data 6A, B). b Pie charts depicting the breakdown of LMS proteomic subtypes at different anatomical sites. c Kaplan–Meier plot of local recurrence-free survival (LRFS) across the LMS proteomic subtypes stratified by P3 and P1/P2 combined. Hazard ratio (HR), 95% confidence intervals (CI) and p-value determined by univariable Cox regression. d Multivariable Cox regression assessing local recurrence-free survival (LRFS) in patients categorised by leiomyosarcoma (LMS) proteomic subtype. I-A intra-abdominal, RP retroperitoneal.
Fig. 4
Fig. 4. Characterisation of the immune profiles of dedifferentiated liposarcoma (DDLPS) and undifferentiated pleomorphic sarcoma (UPS).
a Representative images of high and low CD3+ tumour infiltrating lymphocyte (TIL) staining from an exemplar in DDLPS (green) and UPS (purple) cases in the cohort. Samples were stratified as high and low based on median TIL counts (107 cells/mm2). b Kaplan–Meier plot of overall survival (OS) in CD3+ TIL-high and -low patients (n = 82). Hazard ratio (HR), 95% confidence intervals (CI) and p-value determined by univariable Cox regression. c Boxplots comparing expression of 21 immune-related genes in CD3+ TIL-high and -low cases. Boxplots indicate 25th, 50th, and 75th percentile, with whiskers extending from 25th percentile−(1.5*IQR) to 75th percentile+(1.5*IQR), and outliers plotted as points. p values determined by Kruskal–Wallis tests and adjusted to false discovery rate (FDR). d Gene set enrichment analysis (GSEA) results showing the top 15 gene sets enriched in CD3+ TIL-high and and-low cases based on normalised enrichment score (NES) with gene sets related to complement activity (blue) and coagulation processes (orange) highlighted. e To inspect the proteins contributing to the enrichment of complement and coagulation cascades in these tumours, protein-protein interaction (PPI) networks were constructed based on the Kyoto Encyclopaedia of Genes and Genomics (KEGG) and WikiPathways databases. Node colour indicates Log2(Fold Change CD3+ TIL low: CD3+ TIL high) protein expression. Grey indicates nodes that are not in the proteomic data. This analysis highlighted the serpin family of serine proteases to be strongly upregulated in low CD3+ TIL patients (SERPINA1/A5/C1/D1/F2/G1). Several complement proteins were also upregulated in low CD3+ TIL patients, including those of the membrane attack complex (MAC).
Fig. 5
Fig. 5. Comparative analysis of transcriptomic and proteomic profiles of angiosarcomas (AS).
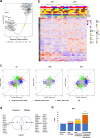
a Volcano plot showing Spearman’s correlation and -log10 transformed p-values for the 3383 genes/proteins. Negatively correlated genes/proteins with p-value < 0.005 and positively correlated genes/proteins with FDR < 0.001 are annotated on the plot. b Annotated heatmap of proteomic data (3383 proteins) for 25 AS cases. The samples were clustered using M3C method with K-means. From top to bottom, panels indicate age, sex, size, performance status, tumour grade, depth, margin, size and aetiology/subtype. The corresponding RNA-seq clusters (Fig. S7A) are shown. c Scatter plots of log2-transformed hazard ratios from univariate Cox regression models fitted using OS (left panel), LRFS (middle panel) and MFS (right panel) using gene/protein expression. Blue dots are proteins with a p-value < 0.05, green dots are genes with a p-value < 0.05 and red dots are the gene/proteins where both datasets returned a p-value < 0.05. d Venn diagram showing the overlap of the genes and proteins that are significantly associated with all the survival endpoint measures (OS, LRFS, and MFS). e Likelihood ratios (Chi-square) of the different Cox regression models and the relative improvement of prognostic information with the addition of different variables (aetiology, proteomics clustership or aetiology*proteomics clustership interaction) to models comprising only baseline clinicopathological variables alone. *p < 0.05. LAAS lymphedema-associated angiosarcoma, PAS primary angiosarcoma, RAAS radiation-associated angiosarcoma, PS performance status, Rx margin unknown.
Fig. 6
Fig. 6. Sarcoma proteomic modules (SPM) are associated with patient survival outcomes.
a Co-expression heatmap showing the correlation of protein expression based on topological overlap matrix (TOM) dissimilarity (1−TOM)7. Cluster dendrogram height indicates 1−Pearson’s correlation. b Protein co-expression network comprising 3290 nodes and 168,574 edges. Nodes indicate proteins and are coloured based on SPM membership. Edges show a correlation between protein expression, where a thicker line indicates a stronger correlation. Representative biological features are annotated for each module. c Overview of univariable Cox regression results for each SPM and local recurrence-free survival (LRFS), metastasis-free survival (MFS), and overall survival (OS). d Protein–protein interaction (PPI) network of SPM 10 comprising 94 nodes and 233 edges. Nodes are proteins and edges represent the StringDB database score between proteins, where a thicker line indicates a higher score (range = 0.401– 0.999). e Sankey diagram illustrating the distribution of histological subtype (excluding DES and RT) across three SPM10 subgroups. Subgroups identified by tertile stratification based on median SPM 10 expression across the full cohort. f Kaplan–Meier plot of MFS across the three SPM 10 subgroups. Hazard ratio (HR), 95% confidence intervals (CI) and p-value determined by univariable Cox regression.

References

    1. WHO Classification of Tumours Editorial Board. Soft Tissue and Bone Tumours (International Agency for Research on Cancer, 2020).
    1. Bovee JV, Hogendoorn PC. Molecular pathology of sarcomas: concepts and clinical implications. Virchows Arch. 2010;456:193–199. doi: 10.1007/s00428-009-0828-5. - DOI - PMC - PubMed
    1. Blay JY, et al. SELNET clinical practice guidelines for soft tissue sarcoma and GIST. Cancer Treat. Rev. 2022;102:102312. doi: 10.1016/j.ctrv.2021.102312. - DOI - PubMed
    1. Gronchi A, et al. Soft tissue and visceral sarcomas: ESMO-EURACAN-GENTURIS Clinical Practice Guidelines for diagnosis, treatment and follow-up() Ann. Oncol. 2021;32:1348–1365. doi: 10.1016/j.annonc.2021.07.006. - DOI - PubMed
    1. Acem I, et al. The role of perioperative chemotherapy in primary high-grade extremity soft tissue sarcoma: a risk-stratified analysis using PERSARC. Eur. J. Cancer. 2022;165:71–80. doi: 10.1016/j.ejca.2022.01.013. - DOI - PubMed

Publication types