. 2023 Jun 29;14(1):3750.
doi: 10.1038/s41467-023-39113-0.

Single-cell transcriptomics uncovers EGFR signaling-mediated gastric progenitor cell differentiation in stomach homeostasis

Affiliations

Single-cell transcriptomics uncovers EGFR signaling-mediated gastric progenitor cell differentiation in stomach homeostasis

Hitomi Takada et al. Nat Commun. .

Erratum in

Abstract

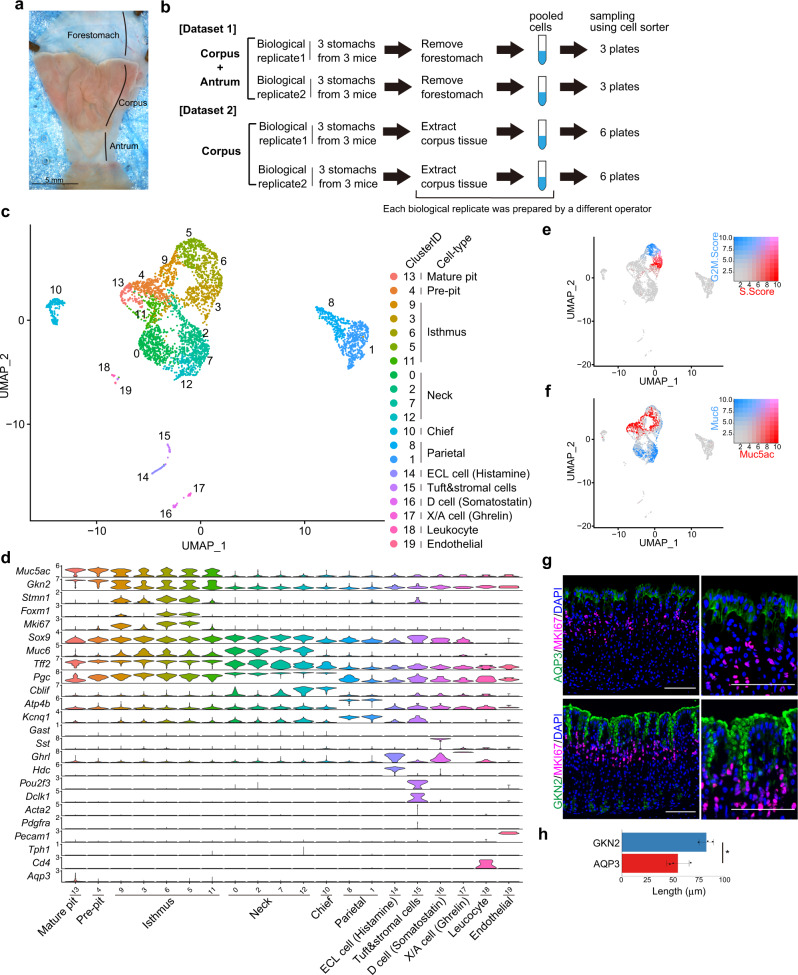
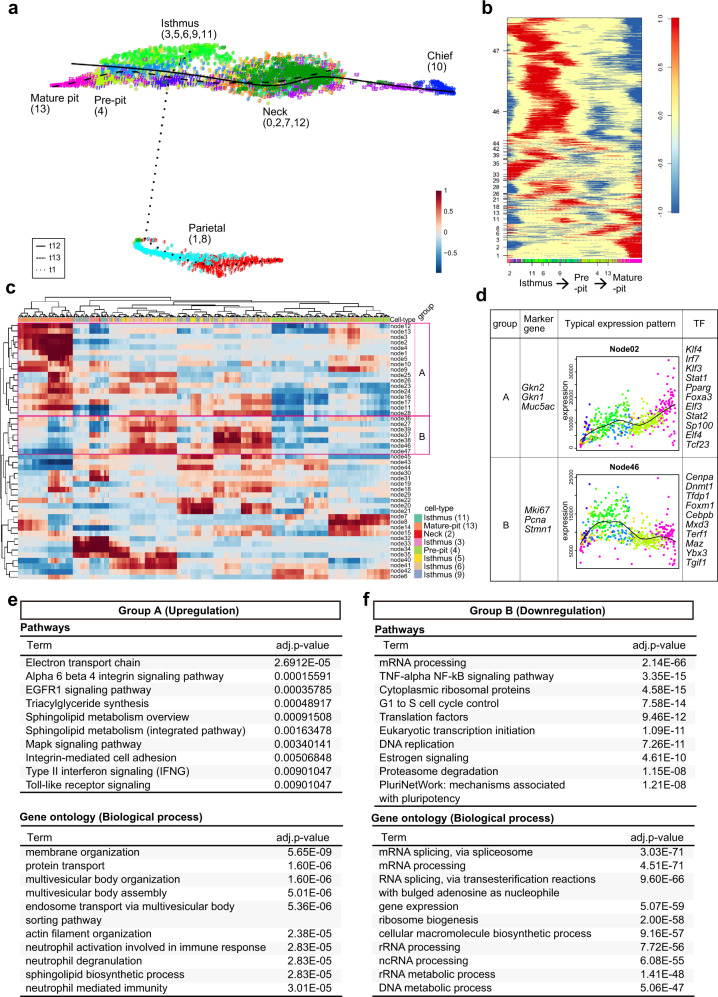
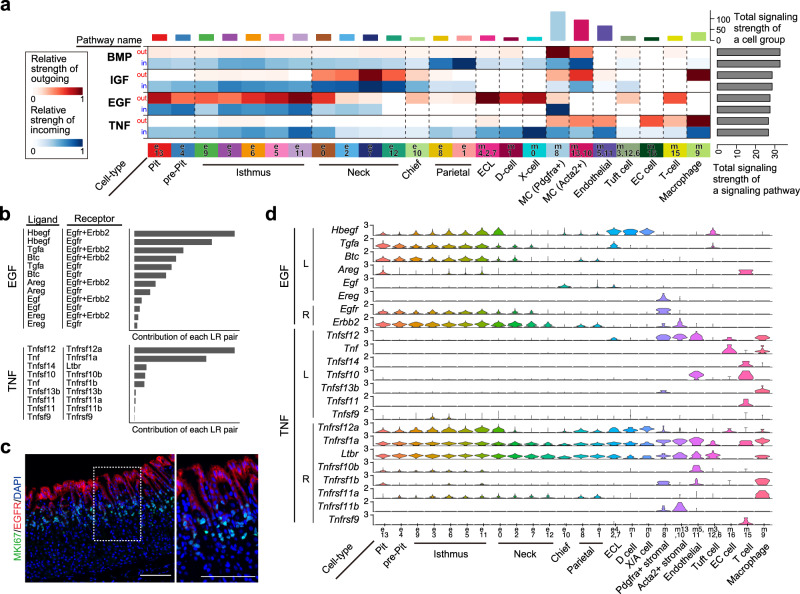
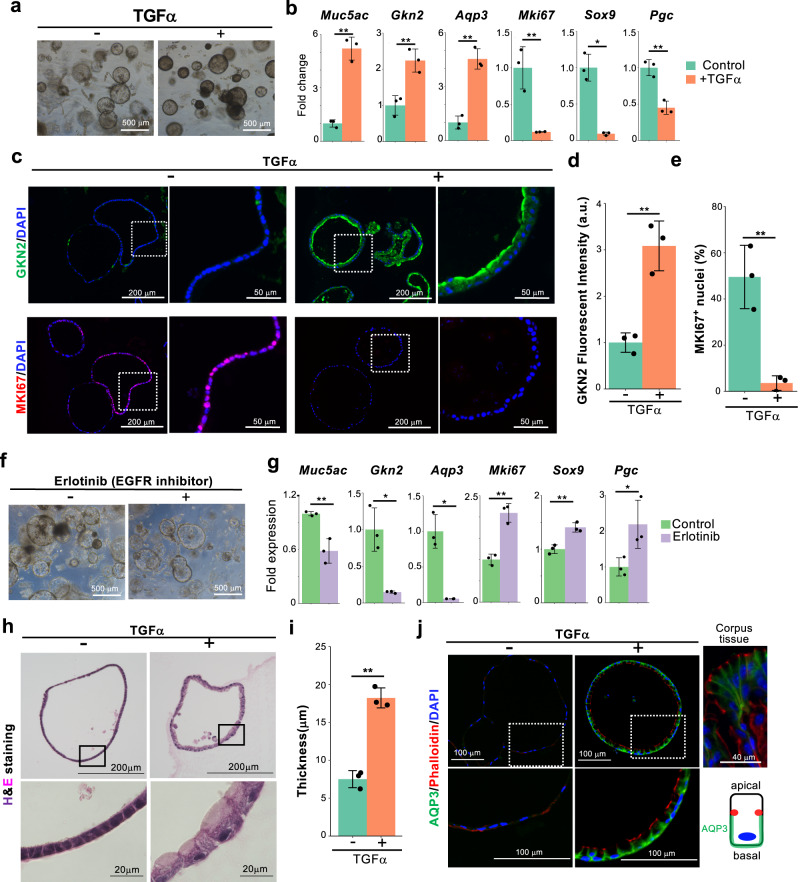
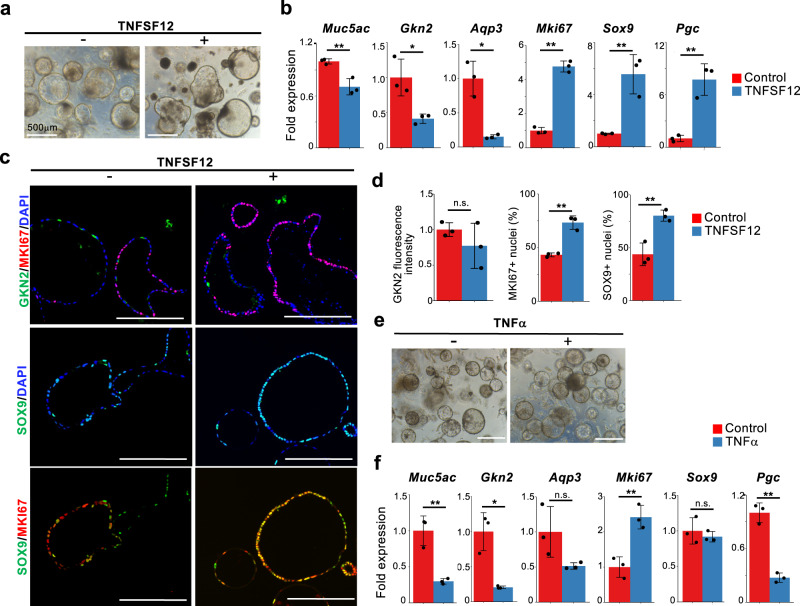
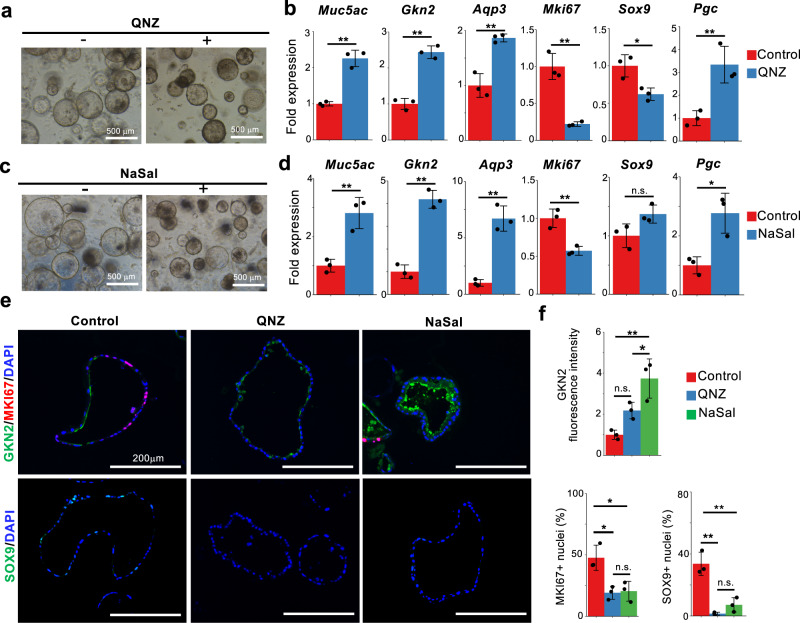
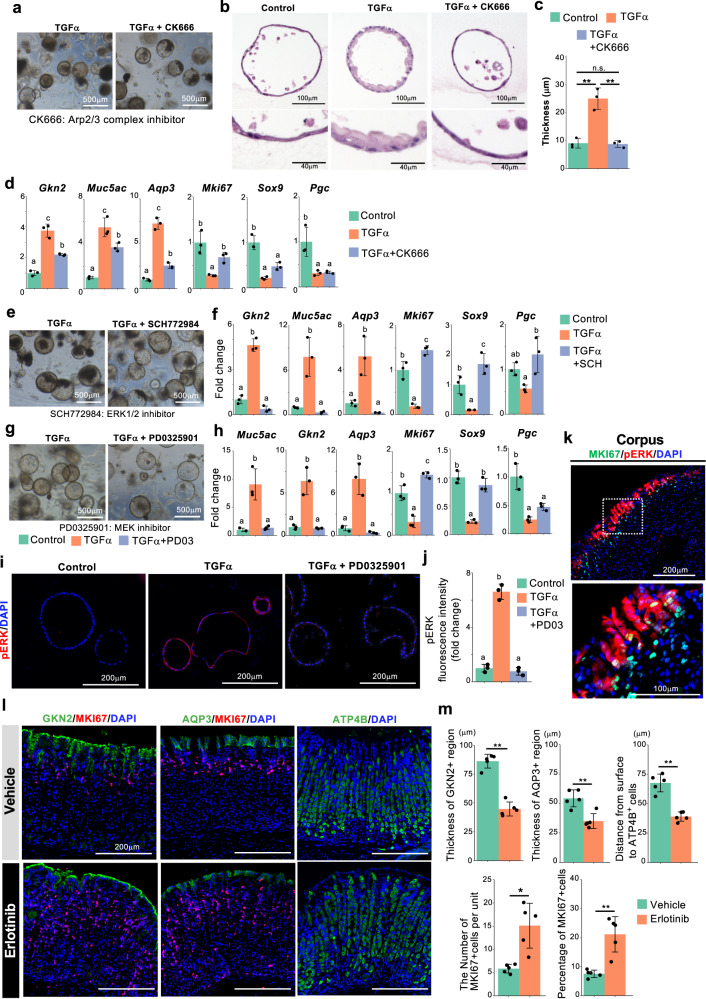
Defects in gastric progenitor cell differentiation are associated with various gastric disorders, including atrophic gastritis, intestinal metaplasia, and gastric cancer. However, the mechanisms underlying the multilineage differentiation of gastric progenitor cells during healthy homeostasis remain poorly understood. Here, using a single-cell RNA sequencing method, Quartz-Seq2, we analyzed the gene expression dynamics of progenitor cell differentiation toward pit cell, neck cell, and parietal cell lineages in healthy adult mouse corpus tissues. Enrichment analysis of pseudotime-dependent genes and a gastric organoid assay revealed that EGFR-ERK signaling promotes pit cell differentiation, whereas NF-κB signaling maintains gastric progenitor cells in an undifferentiated state. In addition, pharmacological inhibition of EGFR in vivo resulted in a decreased number of pit cells. Although activation of EGFR signaling in gastric progenitor cells has been suggested as one of the major inducers of gastric cancers, our findings unexpectedly identified that EGFR signaling exerts a differentiation-promoting function, not a mitogenic function, in normal gastric homeostasis.


Conflict of interest statement

Y.S. and I.N. consult for Knowledge Palette, Inc. and are on their Scientific Advisory Board. The other authors declare no competing interests.

Figures

Fig. 1
Fig. 1. Single-cell analysis of adult mouse corpus gastric units.
a Luminal surface of adult mouse stomach tissue. Scale bar, 5 mm. b Schematic of the experimental design. Cells prepared from the corpus and antrum were analyzed in dataset 1, and cells prepared from the corpus were analyzed in dataset 2. In each dataset, two biological replicates from three mice were prepared by two different operators. Each biological replicate was sorted into three or six plates in datasets 1 and 2, respectively. c UMAP visualization of the cells isolated from adult mouse corpus gastric units (dataset 2). Cells are colored according to the clustering results. d Violin plots showing the expression of known marker genes in each cluster. e, f UMAP of gastric cells colored by the score of cell cycle-state (S-phase and G2/M-phase) (e) and the expression levels for Muc5ac and Muc6 (f). g Immunofluorescence staining of adult mouse corpus gastric units with a mature pit cell marker AQP3 (green), a pan pit cell marker GKN2 (green), an isthmus progenitor cell marker MKI67 (red), and DAPI (blue). Scale bar, 100 µm. h Bar graph showing the lengths of GKN2+ and AQP3+ regions along each gastric unit in (g). Each data point represents the mean value of at least 10 gastric units. Data are presented as mean values ± standard deviation (SD; n = 3 mice). Statistical information: significance was calculated by two-tailed Student’s t-tests. *p = 0.0230. Source data are provided as a Source Data file.
Fig. 2
Fig. 2. Characterization of the pit cell differentiation process.
a Pseudotemporal ordering of pit cells, isthmus progenitor cells, neck cells, and parietal cells identified in dataset 2. Principal curves are shown for mature pit cells (t13, heavy dotted line), neck cells (t12, solid line), and parietal cells (t1, fine dotted line). b Self-organizing map of binarized pseudotemporal expression profiles along the pit cell differentiation trajectory. The x-axis indicates the cells involved in the pit cell lineage that are colored according to cell types, and the y-axis indicates the nodes. c Hierarchical clustering of co-expression nodes in (b). The nodes in groups A and B show upregulation and downregulation patterns of the genes in the pit cell differentiation trajectory, respectively. The x-axis indicates the cells involved in the pit cell lineage that are colored according to cell types, and the y-axis indicates the nodes. The x-axis in (c) is not the same as that of (b) due to the hierarchical clustering of the cells. The colors for each cell type are shown in the bottom right corner. d Characteristics of groups A and B identified in (c). Marker genes in each group were shown. Average pseudotemporal expression profile of the representative node is indicated by a black line. The x-axis indicates pseudotime from isthmus progenitor cells to pit cells, and the y-axis indicates expression level. Colors in each dot represent cell types, which correspond to colors used in (a). Among the TFs involved in groups A and B, the top 10 TFs specifically expressed in pit cells and isthmus progenitor cells (LogFC > 0.25) are shown here, respectively. e, f Characterization of the pseudotime-dependent genes included in group A (e) and group B (f). Upper panel, pathway enrichment analysis of the pseudotime-dependent genes. The top ten pathways with significant enrichment (adjusted p-value < 0.05) are listed. Lower panel, GO analysis of the pseudotime-dependent genes. The top ten terms with significant enrichment (adjusted p-value < 0.05) are listed. Adjusted p-value was determined using one-tailed Fisher’s exact test with g:SCS method in g:Profiler (pathways) and Fisher’s exact test with Benjamini–Hochberg adjustment in Enrichr (GO).
Fig. 3
Fig. 3. Analysis of signaling pathways and ligand-receptor interactions across gastric cell types.
a CellChat-based analysis of outgoing and incoming signaling in each cell type. The x-axis indicates cell types, and the y-axis indicates signaling pathways. For each signaling, the outgoing signal intensity is shown in red (upper row), and the incoming signal intensity is shown in blue (lower row). b Relative contribution of EGF and TNF ligand-receptor pairs calculated by CellChat. c Immunofluorescence staining of adult mouse corpus tissues with EGFR (red), MKI67 (green), and DAPI (blue). Scale bar, 100 μm. Inset shows high-magnification image of boxed area. The image is representative of three independent experiments. d Expression of EGF and TNF ligands and receptors across gastric cell types.
Fig. 4
Fig. 4. TGFα promotes pit cell differentiation.
a Corpus organoids cultured with or without TGFα for 6 days. The images are representative of three biologically independent samples. b qPCR analysis of gastric epithelial cell marker expression in the corpus organoids in (a). Data are presented as mean ± SD (n = 3 biologically independent samples). c Immunofluorescence staining of corpus organoids in (a) with GKN2 (green), MKI67 (red), and DAPI (blue). High-magnification images of the dotted squares are shown on the right side. d Quantification of GKN2 fluorescence intensity in (c). Each data point represents a mean value of six pictures from three biologically independent samples. Data are presented as mean ± SD. **p = 0.0033. e Quantification of the percentage of MKI67+ cells in all DAPI+ cells in (c). Each data point represents the mean value of three pictures from three biologically independent samples. Data are presented as mean values ± SD. **p = 0.0048. f Corpus organoids treated with or without an EGFR inhibitor, erlotinib (0.5 µM). g qPCR analysis of gastric epithelial cell marker expression in the organoids in (f). Data are presented as mean ± SD (n = 3 biologically independent samples). h H&E staining of the organoids cultured with or without TGFα. High-magnification images of the squares are shown in the lower panels. i Quantification of the thickness of epithelial cells in the organoids in (h). Each data point represents the mean value of three pictures from three biologically independent samples. Data are presented as mean ± SD. **p = 0.0004. j Immunofluorescence staining of AQP3, phalloidin, and DAPI in corpus organoids cultured with or without TGFα. High-magnification images of the dotted squares are shown in the lower panels. Right upper panel, immunostaining of adult mouse corpus tissue. The lower right cartoon illustrates the location of AQP3 and phalloidin in the pit cell. The images are representative of three independent experiments. Source data are provided as a Source Data file. Significance was calculated by two-tailed Student’s t-tests for samples with equal variances or two-sided Welch’s t-tests for samples with unequal variances. *p < 0.05; **p < 0.01.
Fig. 5
Fig. 5. TNFSF12 and TNF maintain isthmus progenitor cells in the undifferentiated state.
a Corpus organoids cultured in the presence or absence of 100 ng/mL TNFSF12 for 6 days. b qPCR analysis of gastric epithelial cell marker expression in gastric organoids in (a). Data are presented as mean fold changes ± SD (n = 3 biologically independent samples). **p = 0.0068 for Muc5ac; *p = 0.0197 for Gkn2; *p = 0.0271 for Aqp3; **p < 0.0001 for Mki67; **p = 0.00463 for Sox9; **p = 0.0032 for Pgc. c Immunofluorescence staining of corpus organoids in (a) with GKN2 (green), SOX9 (green), MKI67 (red), and DAPI (blue). Scale bar, 200 µm. d Quantification of GKN2 fluorescence intensity and percentage of nuclear MKI67+ and SOX9+ in all DAPI+ cells of the gastric organoids in (c). Each data point represents the mean value of ten organoids. Data are presented as mean fold changes ± SD (n = 3 biologically independent samples). **p = 0.0013 for MKI67+ nuclei; **p = 0.0060 for SOX9+ nuclei. e Corpus organoids cultured in the presence or absence of 100 ng/mL TNFα. Scale bar, 500 µm. f qPCR analysis of gastric epithelial cell marker expression in the gastric organoids in (e). Data are presented as mean fold changes ± SD (n = 3 biologically independent samples). **p = 0.0042 for Muc5ac; *p = 0.0369 for Gkn2; **p = 0.0058 for Mki67; **p = 0.0005 for Pgc. Source data are provided as a Source Data file. Significance was calculated by two-tailed Student’s t-tests for samples with equal variances or two-sided Welch’s t-tests for samples with unequal variances. *p < 0.05; **p < 0.01; n.s. (not significant). Data of the control samples are also presented in Fig. 4b.
Fig. 6
Fig. 6. NF-κB inhibition induces pit cell differentiation.
a Corpus organoids cultured in the presence or absence of a NF-κB inhibitor, QNZ (16 nM). b qPCR analysis of gastric epithelial cell marker expression in gastric organoids in (a). Data are presented as mean fold changes ± SD (n = 3 biologically independent samples). **p = 0.0007 for Muc5ac; **p = 0.0004 for Gkn2; **p = 0.0027 for Aqp3; **p = 0.0016 for Mki67; *p = 0.0182 for Sox9; **p = 0.0094 for Pgc. c Corpus organoids cultured in the presence or absence of an NF-κB inhibitor, NaSal (1.25 mM). d qPCR analysis of gastric epithelial cell marker expression in gastric organoids in (c). Data are presented as mean fold changes ± SD (n = 3 biologically independent samples). **p = 0.0056 for Muc5ac; **p = 0.0003 for Gkn2; **p = 0.0010 for Aqp3; **p = 0.0054 for Mki67; *p = 0.0141 for Pgc. e Immunofluorescence staining of corpus organoids with GKN2 (green), MKI67 (red), SOX9 (green), and DAPI (blue). The corpus organoids were cultured with or without QNZ or NaSal. Scale bar, 200 µm. f Quantification of GKN2 fluorescence intensity and the percentage of MKI67+ and SOX9+ cells in the gastric organoids in (e). Each data point represents the mean value of at least ten organoids from three biologically independent samples. Data are presented as mean fold changes ± SD. NaSal vs Control **p = 0.0037, QNZ vs Control n.s., QNZ vs NaSal *p = 0.0473 for GKN2 fluorescence intensity; *p = 0.0150, *p = 0.0121, n.s. for MKI67+ nuclei; **p = 0.0017, **p = 0.0006, n.s. for SOX9+ nuclei. Source data are provided as a Source Data file. Significance was calculated by two-tailed Student’s t-tests for samples with equal variances or two-sided Welch’s t-tests for samples with unequal variances in (b) and (d); significance was determined by one-way ANOVA followed by Tukey’s test in (f). *p < 0.05; **p < 0.01; n.s. not significant.
Fig. 7
Fig. 7. ERK is a downstream effector of TGFα-mediated pit cell differentiation.
a Corpus organoids cultured in the presence of TGFα with or without CK666. The images are representative of three biologically independent samples. b H&E staining of the organoids in (a). Insets show high-magnification images of boxed areas. c Quantification of the thickness of the cells in the organoids in (b). Data are presented as mean ± SD (each data point represents the mean value of six pictures from n = 3 biologically independent samples). d qPCR analysis of gastric epithelial cell marker expression in the organoids in (a). Data are presented as mean ± SD (n = 3 biologically independent samples). e Corpus organoids cultured in the presence of TGFα with or without SCH772984. f qPCR analysis of gastric epithelial cell marker expression in gastric organoids in (e). Data are presented as mean ± SD (n = 3 biologically independent samples). g Corpus organoids cultured in the presence of TGFα with or without PD0325901. h qPCR analysis of gastric epithelial cell marker expression in gastric organoids in (g). Data are presented as mean ± SD (n = 3 biologically independent samples). i Immunofluorescence staining of corpus organoids with pERK and DAPI. Corpus organoids were treated with or without TGFα and PD0325901. j Quantification of of pERK fluorescence intensity in (i). Data are presented as mean ± SD (n = 3 biologically independent samples). Each data point represents the mean value of at least ten organoids. k Immunofluorescence staining of adult mouse corpus tissues with MKI67 (green), pERK (red), and DAPI (blue). A high-magnification image of the dotted square is shown in the lower panel. Images are representative of four independent experiments. l Immunofluorescence images of GKN2 (green), ATP4B (green), and MKI67 (red) in the corpus tissues of the mice treated with erlotinib or vehicle. m Quantification of the corpus tissues in (l). The lengths of GKN2+ and AQP3+ regions in each gastric unit, the distance from the luminal surface to the upper end of ATP4B+ parietal cells, and the number and percentage of MKI67+ cells were measured. Each data point represents the mean value of at least 40 gastric units. Data are presented as mean ± SD (n = 5 mice). Source data are provided as a Source Data file. Significance was calculated by two-tailed Student’s t-tests for samples with equal variances or two-sided Welch’s t-tests for samples with unequal variances in (m); significance was calculated by one-way ANOVA followed by Tukey’s post hoc test at the 0.05 significance level in (c), (d), (f), (h), and (j). *p < 0.05; **p < 0.01.

References

    1. Mills JC, Shivdasani RA. Gastric epithelial stem cells. Gastroenterology. 2011;140:412–424. - PMC - PubMed
    1. Goldenring JR. Pyloric metaplasia, pseudopyloric metaplasia, ulcer‐associated cell lineage and spasmolytic polypeptide‐expressing metaplasia: reparative lineages in the gastrointestinal mucosa. J. Pathol. 2018;245:132–137. - PMC - PubMed
    1. Rich A, et al. Distinguishing Ménétrier’s disease from its mimics. Gut. 2010;59:1617. - PMC - PubMed
    1. Coffey RJ, Tanksley J. Pierre Ménétrier and his disease. Trans. Am. Clin. Climatol. Assoc. 2012;123:126–133. - PMC - PubMed
    1. Neuburger P, Lewin M, de Recherche C, Bonfils S. Parietal and chief cell populations in four cases of the Zollinger-Ellison syndrome. Gastroenterology. 1972;63:937–942. - PubMed

Publication types