. 2023 Jun 29;14(1):3844.
doi: 10.1038/s41467-023-39549-4.

Single cell Hi-C identifies plastic chromosome conformations underlying the gastrulation enhancer landscape

Affiliations

Single cell Hi-C identifies plastic chromosome conformations underlying the gastrulation enhancer landscape

Nimrod Rappoport et al. Nat Commun. .

Abstract

Embryonic development involves massive proliferation and differentiation of cell lineages. This must be supported by chromosome replication and epigenetic reprogramming, but how proliferation and cell fate acquisition are balanced in this process is not well understood. Here we use single cell Hi-C to map chromosomal conformations in post-gastrulation mouse embryo cells and study their distributions and correlations with matching embryonic transcriptional atlases. We find that embryonic chromosomes show a remarkably strong cell cycle signature. Despite that, replication timing, chromosome compartment structure, topological associated domains (TADs) and promoter-enhancer contacts are shown to be variable between distinct epigenetic states. About 10% of the nuclei are identified as primitive erythrocytes, showing exceptionally compact and organized compartment structure. The remaining cells are broadly associated with ectoderm and mesoderm identities, showing only mild differentiation of TADs and compartment structures, but more specific localized contacts in hundreds of ectoderm and mesoderm promoter-enhancer pairs. The data suggest that while fully committed embryonic lineages can rapidly acquire specific chromosomal conformations, most embryonic cells are showing plastic signatures driven by complex and intermixed enhancer landscapes.


Conflict of interest statement

The authors declare no competing interests.

Figures
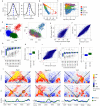
Fig. 1
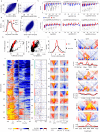
Fig. 1. Single cell Hi-C in mouse embryo cells.
A Distribution of the number of unique contacts per cell (left) and fraction of trans-chromosomal contacts per cell (right) in the Embryo scHi-C dataset. B For each single cell shown are the fraction of contacts in the 2Mb-12Mb (“mitotic”) distance band vs. the fraction of contacts between elements less than 2 Mb apart (“short-range”). Color coding is based on classification into cell cycle phases as in Nagano et al. 2017. C Comparing normalized ratio of scHi-C coverage on early and late replicating loci (X axis) to fraction of short-range contacts. D Visualizing clusters of single ES and embryo cells using PCA projection of A-scores from 11 genomic clusters. Cells are color coded according to cluster (left) or the initial annotation of cell cycle phase (right). E Plotting gene expression of 40 kb bins in ESCs compared to embryo cells (mean across E9 metacells, excluding pEry). Upper and lower dashed lines indicate the threshold for defining transcriptional changes between embryo and ESC. F Comparison of A-scores for 40 kb genomic bins. G 40 kb genomic bins were stratified according to embryonic expression level (units are log2 of the expression frequency). The distributions of A-scores in embryos (blue) and ESCs (green) are depicted using boxplots. The (−19, −18] box contains at least n = 48 K genomic bins, (−11, −10] and (−10, −9] at least n = 20, and the rest at least n = 200. Box limits are the first and third quartile, center line is the median, whiskers are 1.5 times the interquartile range, and points are outliers. H Distributions of differential A-score (ESC minus Embryo) in genomic bins with TSSs showing differential gene expression in embryos compared to ESCs (n = 1289 ESC induced bins: green, n = 806 Embryo induced bins: blue). Box limits are as in (G). IK Similar to (FH) but showing data on the early-scores of genomic bins instead of A-scores. L Examples of conformation reprogramming at pluripotency loci. For each locus we show Shaman enrichment plots in Embryos (top) and ESC (middle), and the respective A-score trends (bottom; blue – embryo, green – ESCs). Dashed circles represent focal points for differential conformation.
Fig. 2
Fig. 2. Distinct, compact conformation for primitive erythrocytes.
A Comparison of 40 kb bins A-score in pEry cells vs. non-pEry embryo cells. Upper and lower dashed lines show differences of at least 0.3 in A-score. B Comparison of log2 mean expression (fraction of molecules per gene) for 40 kb genomic bins. C Distribution of genomic bins’ A-score as a function of expression levels. A-score and transcription were calculated for 40 kb genomic bins. Plots show A-scores stratified by expression, for loci classified with conserved expression (left), Ery induced expression (middle) and Ery-repressed expression (right). In the left panel, the (−19, −18] box contains at least n = 48 K genomic bins, (−11, −10] and (−10, −9] at least n = 20, and the rest at least n = 200. In the middle panel, all boxes contain at least n = 15 genomic bins, except for the (−11, −10] and (−10, −9] which contain at least n = 5. In the right panel, all boxes contain at least n = 90 genomic bins, except for (−12, −11], (−11, 10] and (−10, −9] which contain at least n = 35, 10, and 2 respectively. Box limits are the first and third quartile, center line is the median, whiskers are 1.5 times the interquartile range, and points are outliers. D Distribution of single cell early/late coverage ratio for pEry (red) and non-pEry (black) cells. E Comparing early-scores for 40 kb genomic bins in pEry and non-pEry embryo cells. F Similar to (C), but showing distributions of 40 kb genomic bins early-score instead of A-score. G Showing the distribution of contacts with distance >2 Mb vs mitotic contacts (2–12 Mb) in pEry (red) and non-pEry cells (black). Note the general high degree of long range contacts in p-Erys. H Showing the fraction of contacts in the most frequent distance bin (defined as “Far tightness” in Nagano et al 2017) compared to the rate of long-range contacts. I Distributions of inter-chromosomal contact rates for pEry and non-pEry cell. J Shown are color coded A-scores computed for the pEry (left) and non-pEry (right) clusters around loci with pEry specific high A-score (400 kb upstream and downstream). Loci are grouped into 8 clusters using K-means clustering. K For each of the loci clustered in J we color coded bins with any level of transcription according to the relative expression in pEry and non-pEry cells (blue – higher in non-pEry, red - higher in pEry). L Loci within each cluster in J were pooled, and their average Shaman score is color coded for pEry and non-pEry cells. The pooled A-score profile is shown at the bottom for every loci cluster in pEry and non-pEry. M Examples of loci showing distinct pEry conformation. For every locus, depicted are contact enrichment in non-pEry cells (top), pEry cells (middle) and profile of A-score in the two clusters (bottom). For Cpox and Hbb we mark contacts with the TSS locus by black diagonal lines.
Fig. 3
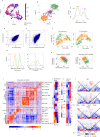
Fig. 3. Ectoderm and mesoderm/endoderm scHi-C clusters in the embryo.
A S-phase cells from the non-pEry cluster were identified and projected on 2D using UMAP analysis of their coverage in 1103 loci. Cells are color-coded by their s-score as inferred by our probabilistic model. B UMAP projection of the same cells as in (A), using features normalized given inferred s-score for each cell. C Distribution of inferred s-scores for the three non-pEry embryo clusters. D Average normalized coverage (early-score) for genomic bins in clusters C2.1 and C2.3. E Similar to (D), but comparing average C2.1 and C2.3 behavior to C2.2 behavior. F Genomic bins that were inferred to be early replicating (Methods) in C2.1 (left) or C2.3 (right) were pooled, and for each cell we plotted total coverage as a function of the inferred s-score. Cells are colored by their cluster (C2.1 – green, C2.3 – orange). G Distribution of the difference between C2.1 cells and C2.3 cells in early-score (left) and A-score (right) for genomic bins classified as specific to C2.1 (green) or C2.3 (orange). Grey – all bins. H Average normalized A-score for the group of genomic bins specific to C2.1 (X) and C2.3 (Y) are depicted for color-coded cells in the three clusters C2.1- 3 (left). A Similar plot is shown for 898 cells that were not included in the set of 699 mid S-phase cells used for clustering (right). Gray lines mark the thresholds used for classification of the expanded C2.1 and C2.3 clusters. I Correlation heatmaps for 2353 gene expression profiles over the E9.0 metacell model. Gene module numbers and representative genes are shown on the right. S. ecto Surface ectoderm, CM cardiomyocyte, Endot Endothelium, E Meso extraembryonic mesoderm. J The color-coded matrix represents the difference in average early-score per single cell cluster (columns) for the TSS loci in each gene module from I (rows). K Similar to (J), but showing difference in average A-score in each cluster. L Depicting the contact structure (color-coded Shaman map) in C2.1 (top) and C2.3 (bottom) cells around the Crabp2 and Igf2 TSSs.
Fig. 4
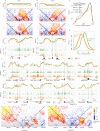
Fig. 4. Three-way support for specific regulatory contacts.
A, B Comparing A-score (top), contact maps, virtual-4C using Shaman scores, and H3K4me1 ChIP-seq (bottom) around the Sox2 and Twist1 loci. The genes, and for Twist1 also a nearby enhancer, are marked by vertical grey lines. C Shown are distributions of genomic distances between a TSS and the nearest putative enhancer classified according to the ectoderm/mesoderm lineage specificity of the two loci as determined by gene expression (for the promoter) and ENCODE ChIP-seq (for the putative enhancer). D The distribution of differential C2.1 and C2.3 Shaman score (X axis) on TSS-enhancers pairs with coordinated mesoderm or ectoderm specific activity. Shaman differences is computed only for contacts with positive scores in both C2.1 and C2.3. E Examples of virtual 4 C plots (top) and H3K4me1 ChIP-seq (bottom, C2.1 followed by C2.3) around 4 ectoderm and 4 mesoderm genes. Gray vertical lines mark the TSS and putative enhancer. Gene-free regions around regulated genes are highlighted by horizontal gray bars. F Contact structure around the Tbx3-Tbx5 locus in the C2.1 and C2.3 clusters. Contacts discussed in the text are marked by dashed circles.
Fig. 5
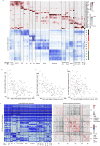
Fig. 5. Gastrulation accessibility hotspots are chromosomally intertwined.
A Bottom panel shows the accessibility of peaks (rows) over metacells (columns) (log2 the number of normalized ATAC-seq reads). Shown are loci from select clusters highlighted in the text. Top panel depicts gene expression of correlated TFs over the same metacells, provided in order to link accessibility clusters with specific cell types. B For each cluster of ATAC peaks we computed the fraction of loci with A-compartment score difference larger than 0.1 when comparing ESC and Embryo pooled Hi-C. Clusters with over 0.08 of the loci showing A-score enrichment in ESCs are colored black. C Similar to (B), but comparing embryo and pEry pooled Hi-C maps. D Similar to (B), but comparing the embryonic clusters C2.1 (ectoderm) and C2.3 (mesoderm). E Left panel is showing mean normalized accessibility for ATAC peak clusters (row) and metacells (column). Right panel is showing for each pair of peak clusters the enrichment of intra-TAD proximity (number of pairs of peaks in the same TAD and within 200 kb of each other).

References

    1. Bonev B, Cavalli G. Organization and function of the 3D genome. Nat. Rev. Genet. 2016;17:661–678. doi: 10.1038/nrg.2016.112. - DOI - PubMed
    1. Kim S, Shendure J. Mechanisms of interplay between transcription factors and the 3D genome. Mol. Cell. 2019;76:306–319. doi: 10.1016/j.molcel.2019.08.010. - DOI - PubMed
    1. Marchal C, Sima J, Gilbert DM. Control of DNA replication timing in the 3D genome. Nat. Rev. Mol. Cell Biol. 2019;20:721–737. doi: 10.1038/s41580-019-0162-y. - DOI - PMC - PubMed
    1. Despang A, et al. Functional dissection of the Sox9-Kcnj2 locus identifies nonessential and instructive roles of TAD architecture. Nat. Genet. 2019;51:1263–1271. doi: 10.1038/s41588-019-0466-z. - DOI - PubMed
    1. Symmons O, et al. The shh topological domain facilitates the action of remote enhancers by reducing the effects of genomic distances. Dev. Cell. 2016;39:529–543. doi: 10.1016/j.devcel.2016.10.015. - DOI - PMC - PubMed

Publication types