. 2023 Jun 29;14(1):3862.
doi: 10.1038/s41467-023-39614-y.

The mRNA methyltransferase Mettl3 modulates cytokine mRNA stability and limits functional responses in mast cells

Affiliations

The mRNA methyltransferase Mettl3 modulates cytokine mRNA stability and limits functional responses in mast cells

Cristina Leoni et al. Nat Commun. .

Abstract

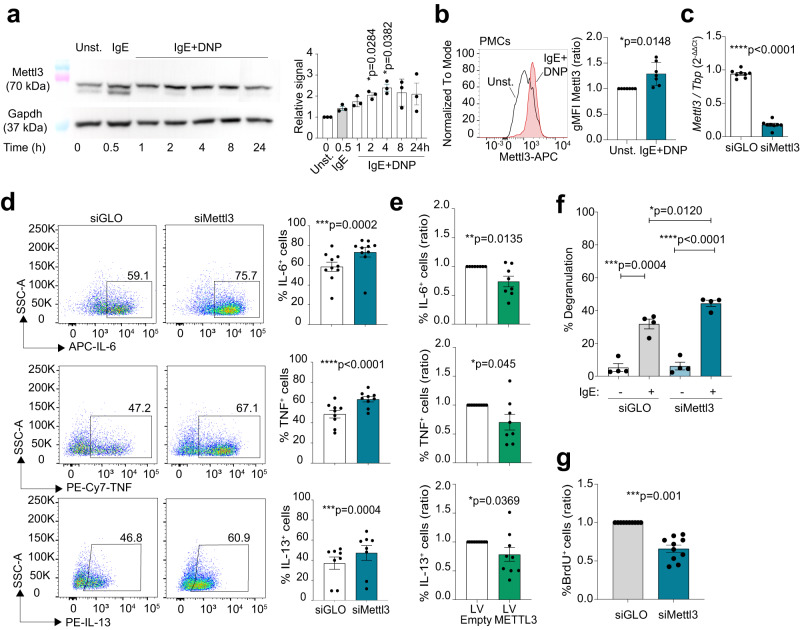
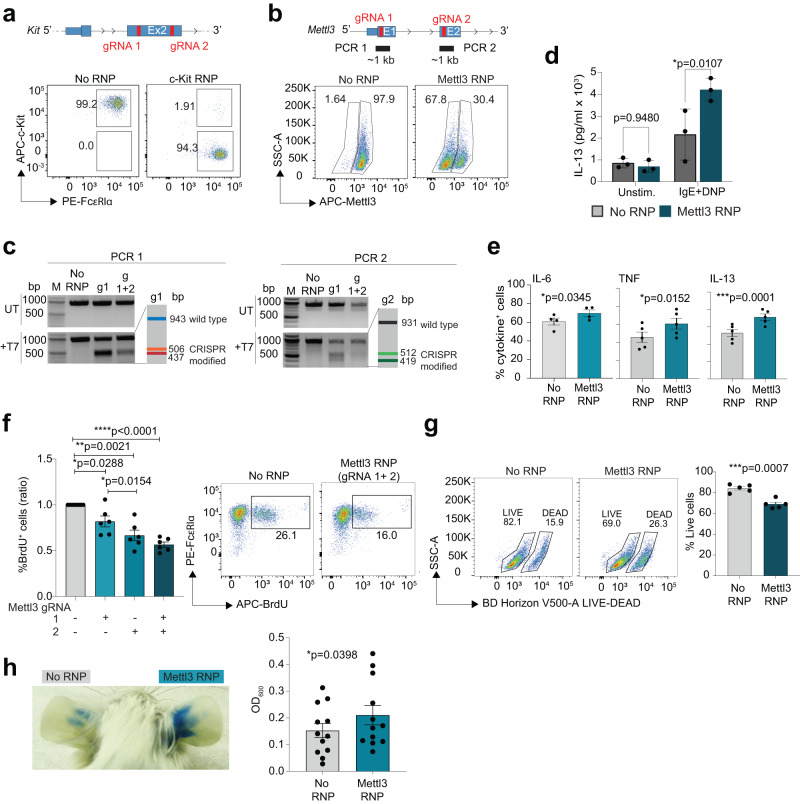
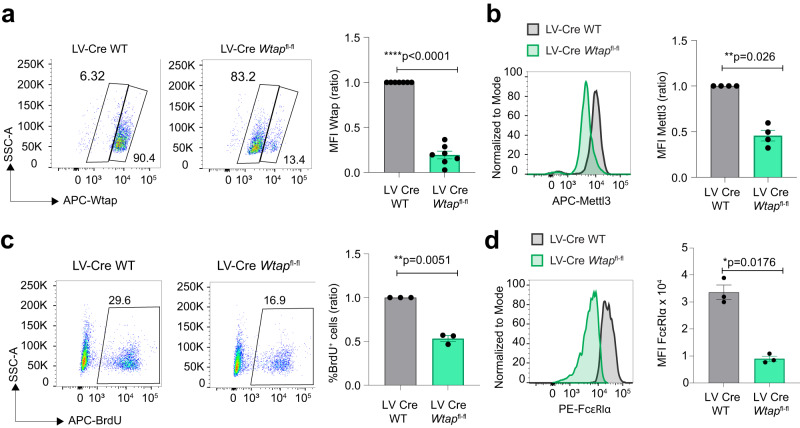
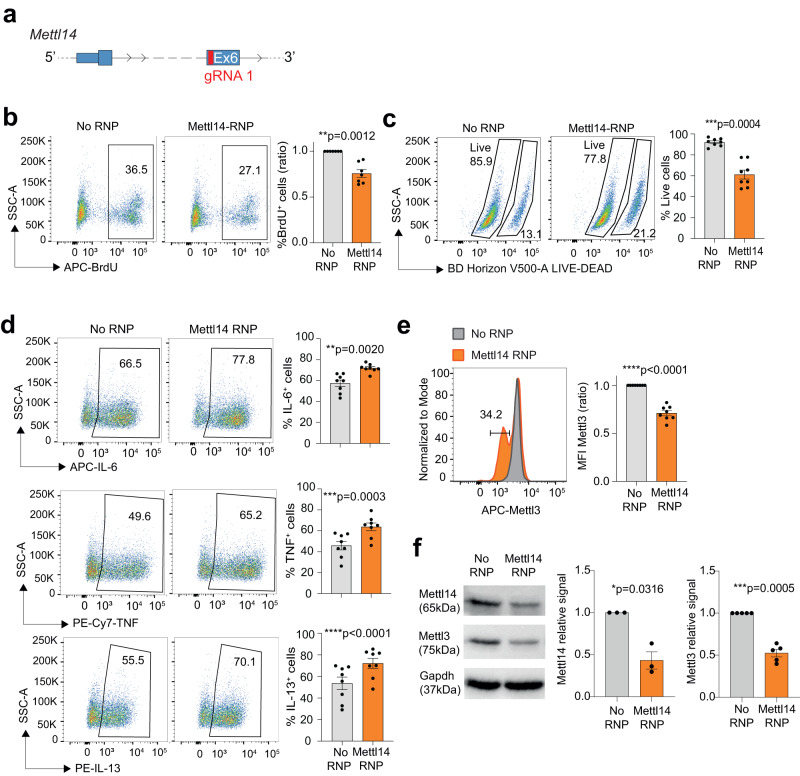
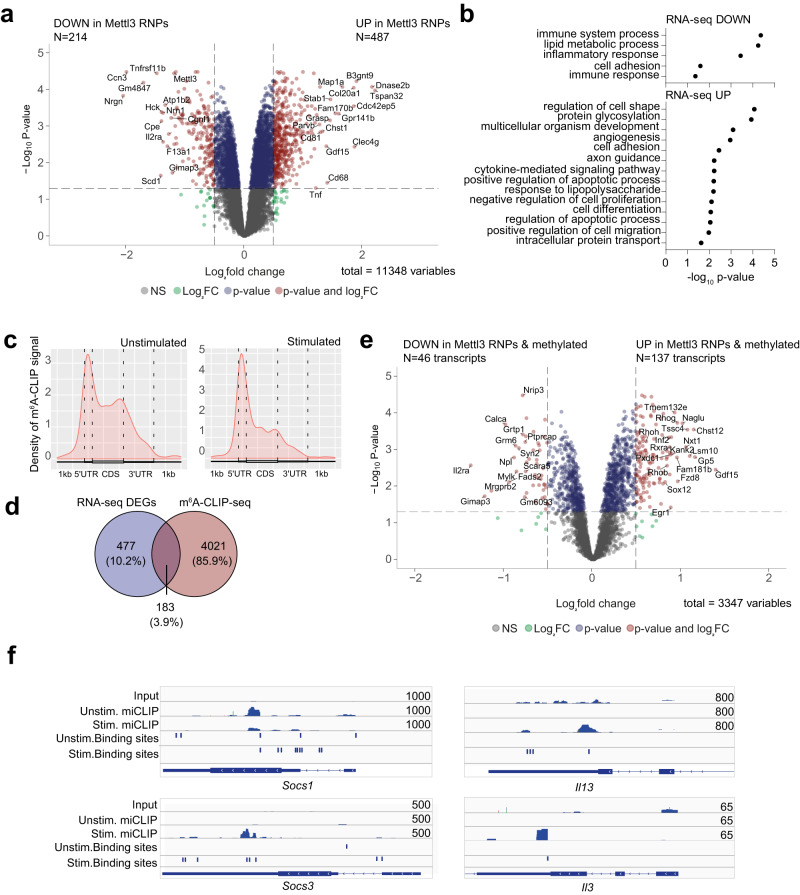
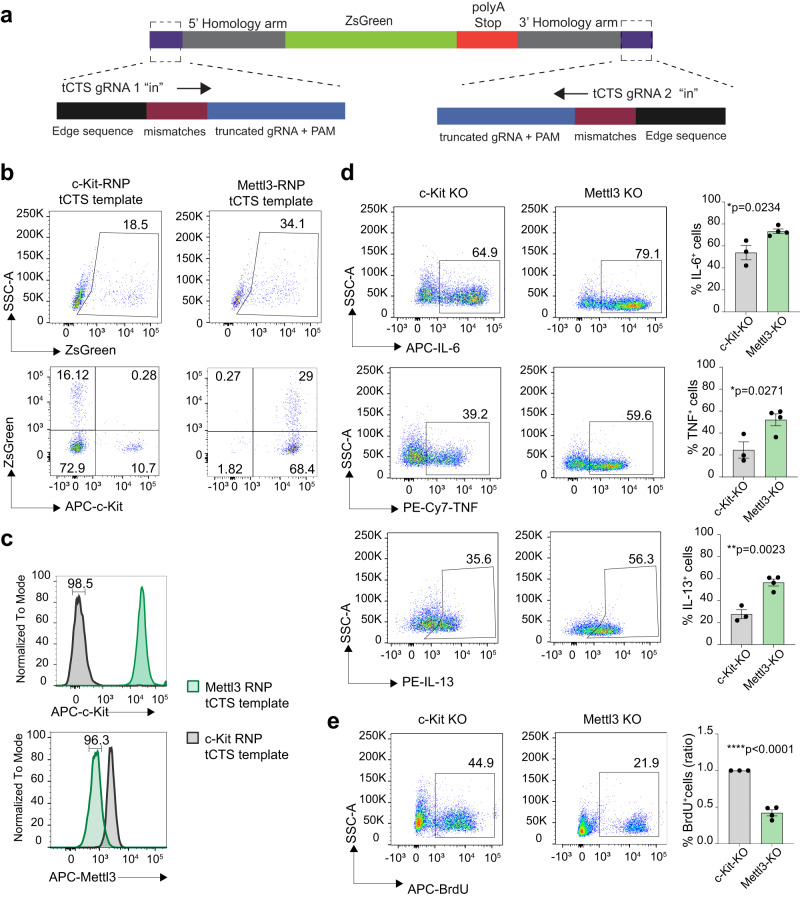
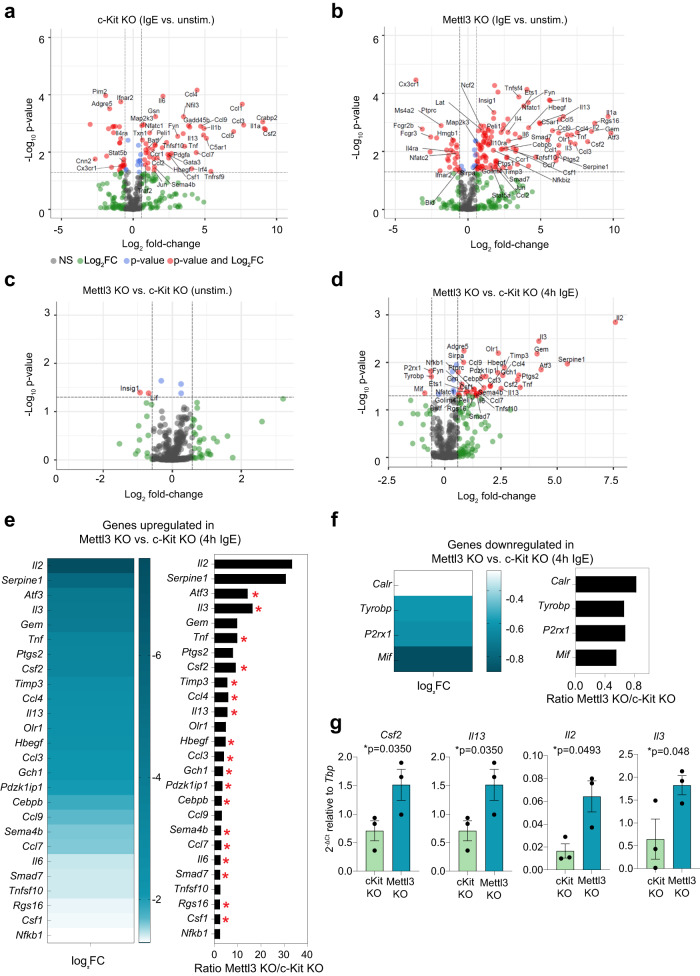
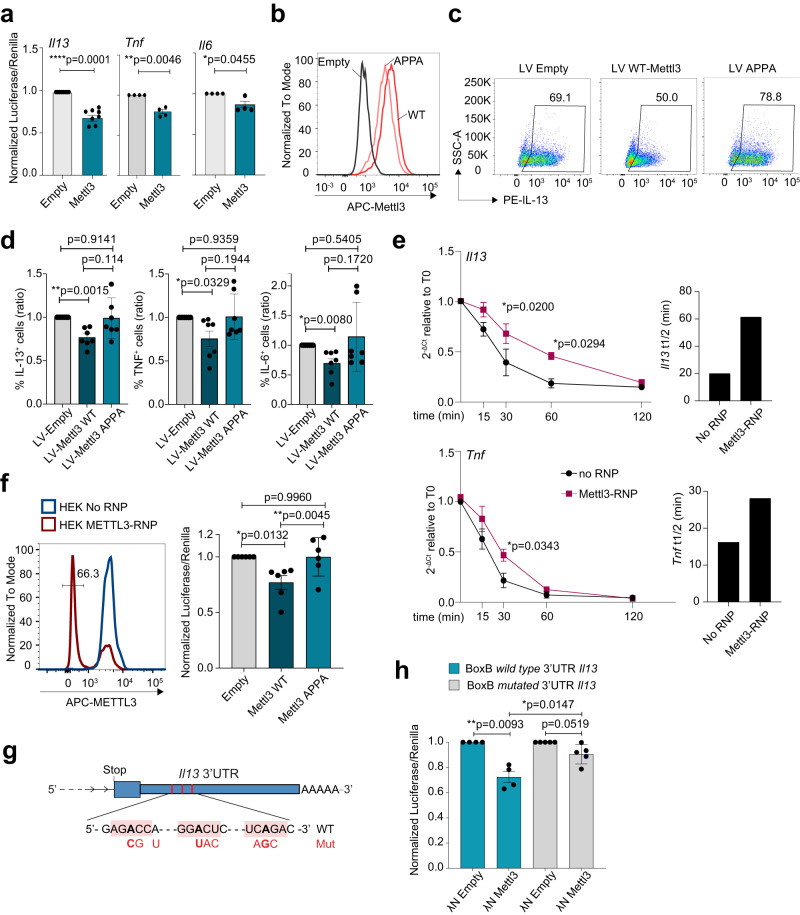
Mast cells are central players in allergy and asthma, and their dysregulated responses lead to reduced quality of life and life-threatening conditions such as anaphylaxis. The RNA modification N6-methyladenosine (m6A) has a prominent impact on immune cell functions, but its role in mast cells remains unexplored. Here, by optimizing tools to genetically manipulate primary mast cells, we reveal that the m6A mRNA methyltransferase complex modulates mast cell proliferation and survival. Depletion of the catalytic component Mettl3 exacerbates effector functions in response to IgE and antigen complexes, both in vitro and in vivo. Mechanistically, deletion of Mettl3 or Mettl14, another component of the methyltransferase complex, lead to the enhanced expression of inflammatory cytokines. By focusing on one of the most affected mRNAs, namely the one encoding the cytokine IL-13, we find that it is methylated in activated mast cells, and that Mettl3 affects its transcript stability in an enzymatic activity-dependent manner, requiring consensus m6A sites in the Il13 3'-untranslated region. Overall, we reveal that the m6A machinery is essential in mast cells to sustain growth and to restrain inflammatory responses.


Conflict of interest statement

The authors declare no competing interests.

Figures

Fig. 1
Fig. 1. Mettl3 modulates mast cell proliferation and effector functions.
a Mast cells were stimulated with IgE with or without HSA-DNP for the indicated times and expression of Mettl3 was analyzed by western blot. Left, one representative blot. Right, quantification of N = 3 independent experiments. Mean ± SEM. One-way ANOVA. b After ex-vivo expansion, PMCs were stimulated with IgE and antigen complexes and Mettl3 expression was measured by intracellular staining. N = 7 independent experiments. Mean ± SD. Paired t test, two-tailed. c Expression of Mettl3, measured by RT-qPCR, in mast cells transfected with siRNAs against Mettl3 or a non-targeting control. N = 8 independent experiments. Mean ± SEM. Paired t test, two-tailed. d Expression of inflammatory cytokines measured by intracellular cytokine staining in mast cells transfected with siRNAs against Mettl3 or a non-targeting control. Cells were stimulated with IgE and antigen complexes for 4 h. Left, representative FACS plots. Right, quantification of N = 8-10 independent experiments. Mean ± SEM. Paired t test, two-tailed. e Mast cells were transduced with lentiviral vectors to overexpress Mettl3. After selection of the transduced cells and stimulation with IgE and antigen complexes for 4 h, intracellular cytokine staining was performed to measure the expression of inflammatory cytokines. N = 8 independent experiments (ratio compared to controls). Mean ± SEM. Unpaired t test, two-tailed. f Mast cells were transfected with siRNAs against Mettl3 or a non-targeting control. 48 h after transfection, cells were stimulated with IgE and antigen complexes for 4 h, followed by β-hexosaminidase assay to measure the extent of degranulation. N = 4 independent experiments. Mean ± SEM. Unpaired t test, two-tailed. g Mast cells were transfected with siRNAs against Mettl3 or a non-targeting control, followed by BrdU incorporation to measure cell proliferation. N = 10 independent experiments. Mean ± SEM. Paired t test, two-tailed. Source data are provided as a Source data File.
Fig. 2
Fig. 2. Deletion of Mettl3 by CRISPR-Cas9 alters mast cell responses.
a Optimization of gene editing in primary mast cells. Cells were transfected with Cas9 RNPs containing gRNAs against the Kit gene (schematic representation on top). One representative FACS plot showing the efficiency of deletion of the surface receptor c-Kit. Representative of at least N = 8 experiments. b Top, schematic representation of the Mettl3 locus, with indicated the location of the gRNAs and the PCRs used in T7 endonuclease I assays. Bottom: one representative FACS plot showing the deletion of the Mettl3 protein, by intracellular staining. Representative of at least N = 11 experiments. c T7 endonuclease I assay performed on genomic DNA from cells as in (b). The expected patterns of digestion, based on the locations of the sgRNAs and the PCR primers, are shown schematically on a side (see Supplementary Fig. 3b for further details). The effect of one gRNA or two gRNAs is shown. UT: untreated (no T7 enzyme). Representative of N = 4 experiments; M=marker. d Mast cells were transfected as in (c), followed by stimulation with IgE and antigen complexes for 6 h. Release of IL-13 in the culture supernatants was measured by ELISA. N = 3 independent experiments. Mean ± SD. Two-ways ANOVA. e Intracellular cytokine staining was performed on cells as in (c). N = 4-5 independent experiments. Mean ± SEM. Paired t test, two-tailed. f BrdU incorporation assay to measure proliferation 4-6 days post-transfection. N = 6 independent experiments (ratio compared to control samples). Mean ± SEM. Paired t test, two-tailed. One representative FACS plot is shown on the right. g Viability of mast cells transfected with Mettl3 RNPs or controls was measured by LIVE/DEAD staining. N = 5 independent experiments. Mean ± SEM. Paired t test, two-tailed. h Mast cells were injected into the ear pinna of KitW-sh/W-sh mice. Two weeks after, anti-DNP IgE antibodies were injected intradermally followed, 24 h later, by intravenous injection of HSA-DNP antigen together with Evan’s blue dye. The dye was then extracted and measured spectrophotometrically. Each dot represents one mouse (N = 12), N = 2 independent experiments. One representative experiment is shown on the left. Mean ± SD. Paired t test, two-tailed. Source data are provided as a Source data File.
Fig. 3
Fig. 3. Wtap deficiency impairs mast cell proliferation and FcεRI expression.
a Wtapfl/fl bone marrow cells were transduced with a lentiviral vector expressing a GFP-Cre fusion protein, following by sorting of the GFP+ cells and intracellular staining to verify Wtap protein depletion. Left, one representative staining for Wtap expression. Right, Wtap mean fluorescence intensity (MFI) in N = 7 independent experiments (ratio compared to control samples). Mean ± SD. Paired t test, two-tailed. b Expression of Mettl3 measured by intracellular staining in cells as in (a). N = 4 independent experiments. Mean ± SD. Paired t test, two-tailed. c Proliferation (measured by BrdU incorporation) of cells as in (a). Left, one representative experiment. Right, results of N = 3 independent experiments (ratio compared to control samples). Mean ± SEM. Paired t test, two-tailed. d Expression of surface FcεRI in cells lacking Wtap. Left, one representative experiment. Right, results of N = 3 independent experiments. Mean ± SEM. Paired t test, two-tailed. Source data are provided as a Source data File.
Fig. 4
Fig. 4. Deletion of Mettl14 phenocopies Mettl3 deficiency.
a Schematic representation of the Mettl14 locus with location of the gRNA. b Cell proliferation (measured by BrdU incorporation) in mast cells transfected with Mettl14 RNPs. N = 7 independent experiments. Mean ± SEM. Paired t test, two-tailed. c Cell viability in mast cells transfected with Mettl14 RNPs. Each dot represents one experiment. N = 8 independent experiments. Mean ± SEM. Paired t test, two-tailed. d Mast cells transfected with Mettl14 RNPs were stimulated with IgE and antigen complexes and cytokine expression was measured by intracellular staining. N = 8 independent experiments. Mean ± SEM. Paired t test, two-tailed. e Mettl14 depletion induces the loss of Mettl3 expression. Intracellular staining for Mettl3 was performed on mast cells transfected with Mettl14 RNPs. N = 8 independent experiments. Mean ± SEM. Paired t test, two-tailed. f Western blot for Mettl14, Mettl3 and Gapdh as control was performed on mast cells transfected with Mettl14 RNPs. N = 3-5 independent experiments. Mean ± SEM. Paired t test, two-tailed. Source data are provided as a Source data File.
Fig. 5
Fig. 5. Analysis of transcript methylation and abundance in mast cells.
a RNA-seq of wild-type and Mettl3-KO BMMCs. N = 4 independent biological replicates. RNAseq data were analyzed with DESeq2 R package. Wald test P values were then adjusted for multiple testing using Benjamini and Hochberg correction. b GO terms associated to down- and up-regulated genes that were differentially expressed. Only categories containing at least 10 genes are shown. c miCLIP-seq of mast cells resting or stimulated with PMA and ionomycin. N = 3 independent biological replicates. The density of miCLIP signal is shown. d Venn diagram showing the overlap between differentially expressed genes (DEGs) identified by RNA-seq in (a) and methylated transcripts. e Volcano plot of DEGs identified in (a) that are also methylated. f Integrative Genomics Viewer tracks displaying miCLIP read distribution on representative transcripts. The read coverage is shown for merged biological replicates. The binding sites are identified by PureCLIP analysis incorporated with size-matched input control. Data were prepared from three biological replicates. Source data are provided as a Source data File.
Fig. 6
Fig. 6. Efficient gene replacement with truncated Cas9 target sequences templates in mast cells.
a Schematic representation of the tCTS HDR template used for gene replacement. b Mast cells were transfected with Kit- or Mettl3-targeting RNPs together with the tCTS template as in a). Expression of c-Kit and ZsGreen was measured 72 h after transfection. Representative of N = 6 experiments. c Cells transfected as in b) were sorted for ZsGreen and the expression of Mettl3 protein measured by intracellular staining. Representative of N = 3 experiments. d Cells as in (c) were stimulated with IgE-antigen complexes and cytokine expression was measured by intracellular staining. Left, one representative experiment. Right, N = 3-4 independent experiments. Mean ± SEM. Unpaired t test, two-tailed. e BrdU incorporation in cells as in (c). Left, one representative experiment. Right, N = 3-4 independent experiments. Mean ± SEM. Unpaired t test, two-tailed. Source data are provided as a Source data File.
Fig. 7
Fig. 7. Mettl3 modulates the expression of inflammatory transcripts in mast cells.
ad Cells lacking either c-Kit or Mettl3 expression were stimulated with IgE+antigen complexes and the expression of inflammatory transcripts was measured using the Nanostring Myeloid Innate Immunity Panel. Shown are individual scatter plots comparing unstimulated and stimulated c-Kit KO and Mettl3 KO cells. N = 3 independent biological replicates. Two-tailed t test, without further p value adjustment. e Genes that are most differentially expressed (upregulated in absence of Mettl3) between stimulated c-Kit KO and Mettl3 KO cells. Both the log2 fold-change (FC) and the ratio are shown. The red asterisks indicate transcripts that were found to be methylated by miCLIP-seq in stimulated mast cells. f Genes that are most differentially expressed (downregulated in absence of Mettl3) between stimulated c-Kit-deleted and Mettl3-deleted cells. Both the log2FC and the ratio are shown. g Validation of gene expression results using an independent set of experiments. N = 3, each dot represents one experiment. Mean ± SEM. Paired t test, two-tailed. Source data are provided as a Source data File.
Fig. 8
Fig. 8. Mettl3 deletion stabilizes inflammatory transcripts in mast cells.
a HEK293T cells were transfected with luciferase reporter plasmids containing the indicated 3’UTRs, with or without Mettl3. N = 4-8, each dot represents one experiment. Mean ± SD. Paired t test, two-tailed. b Mast cells were transduced with lentiviruses to overexpress either wild-type (WT) or APPA Mettl3. After selection and expansion, protein overexpression was detected by intracellular staining for Mettl3. One representative experiment of N = 4. c, d Cells expressing either wild-type or APPA Mettl3 were stimulated with IgE and antigen complexes and cytokine expression was measured by intracellular staining. N = 7 independent experiments. Mean ± SD. Paired t test, two-tailed. e Mast cells were transfected with Cas9 RNPs to delete Mettl3, after which they were stimulated with IgE and antigen complexes and treated with actinomycin D for the indicated times. Expression of Il13 and Tnf was measured by RT-qPCR and the half-life of the transcripts (t1/2) was calculated. Mean ± SEM. Two-way ANOVA. f METTL3-KO HEK293T cells (intracellular staining to show METTL3 deletion in these cells is shown on the left) were transfected with a luciferase reporter plasmid containing the Il13 3’UTR, with or without wild-type or APPA Mettl3. N = 6, each dot represents one experiment. Mean ± SD. Paired t test, two-tailed. g Schematic representation of the 3’UTR of the Il13 mRNA with indicated the three putative DRACH sites that were mutated as shown in red. The “A” nucleotides in bold correspond to the putative methylation site within the DRACH consensus (shaded). Stop: stop codon. h METTL3-KO HEK293T cells were transfected with a luciferase reporter plasmid containing the Il13 3’UTR with BoxB sites, wild-type or mutated in the DRACH sites, together with λN Mettl3. N = 4-5, each dot represents one experiment. Mean ± SD. Paired or unpaired t test, two-tailed. Source data are provided as a Source data File.

References

    1. Cildir G, Pant H, Lopez AF, Tergaonkar V. The transcriptional program, functional heterogeneity, and clinical targeting of mast cells. J. Exp. Med. 2017;214:2491–2506. doi: 10.1084/jem.20170910. - DOI - PMC - PubMed
    1. Dudeck J, et al. Directional mast cell degranulation of tumor necrosis factor into blood vessels primes neutrophil extravasation. Immunity. 2021;54:468–483.e465. doi: 10.1016/j.immuni.2020.12.017. - DOI - PubMed
    1. Leoni C, et al. Dnmt3a restrains mast cell inflammatory responses. Proc. Natl. Acad. Sci. USA. 2017;114:E1490–E1499. doi: 10.1073/pnas.1616420114. - DOI - PMC - PubMed
    1. Montagner S, et al. TET2 regulates mast cell differentiation and proliferation through catalytic and non-catalytic activities. Cell Rep. 2016;15:1566–1579. doi: 10.1016/j.celrep.2016.04.044. - DOI - PMC - PubMed
    1. Monticelli S, Leoni C. Epigenetic and transcriptional control of mast cell responses. F1000Res. 2017;6:2064. doi: 10.12688/f1000research.12384.1. - DOI - PMC - PubMed

Publication types