. 2023 Jul;22(7):913-924.
doi: 10.1038/s41563-023-01578-1. Epub 2023 Jun 29.

Compressive forces stabilize microtubules in living cells

Affiliations

Compressive forces stabilize microtubules in living cells

Yuhui Li et al. Nat Mater. 2023 Jul.

Abstract

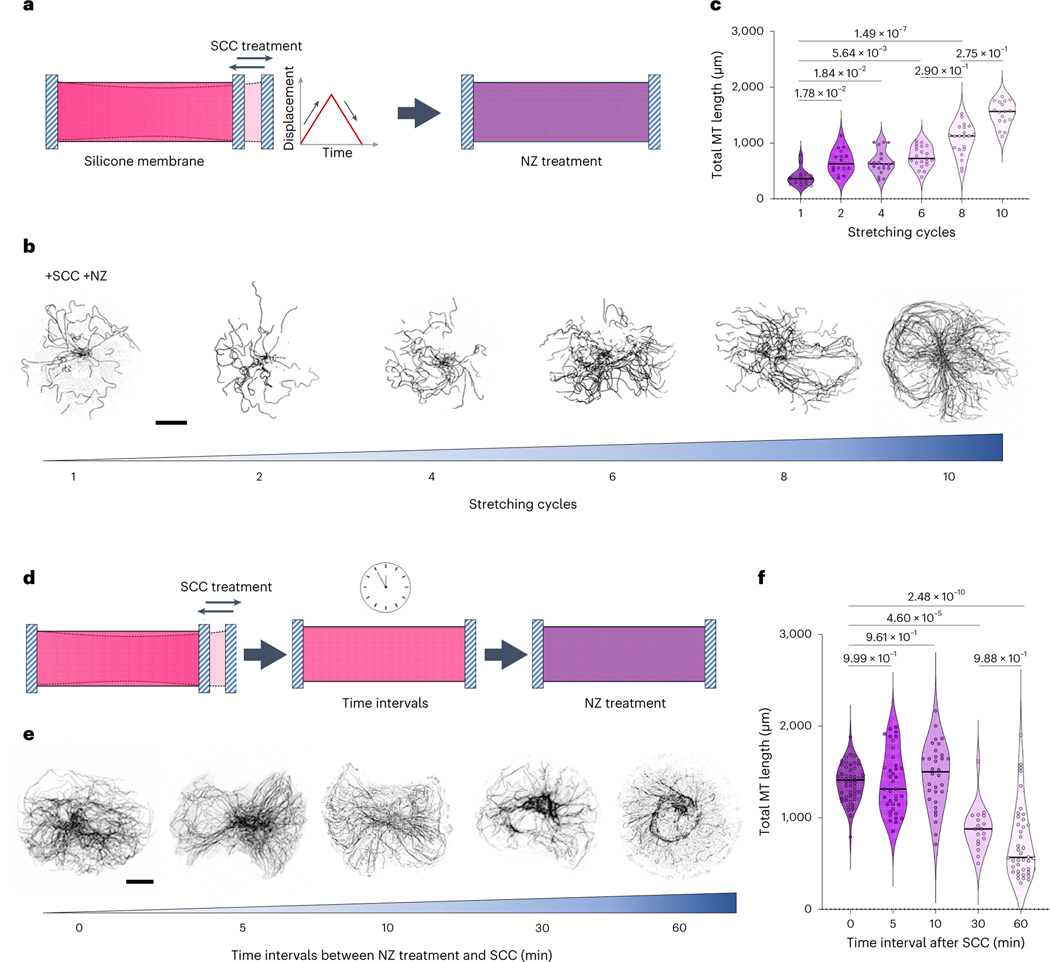
Microtubules are cytoskeleton components with unique mechanical and dynamic properties. They are rigid polymers that alternate phases of growth and shrinkage. Nonetheless, the cells can display a subset of stable microtubules, but it is unclear whether microtubule dynamics and mechanical properties are related. Recent in vitro studies suggest that microtubules have mechano-responsive properties, being able to stabilize their lattice by self-repair on physical damage. Here we study how microtubules respond to cycles of compressive forces in living cells and find that microtubules become distorted, less dynamic and more stable. This mechano-stabilization depends on CLASP2, which relocates from the end to the deformed shaft of microtubules. This process seems to be instrumental for cell migration in confined spaces. Overall, these results demonstrate that microtubules in living cells have mechano-responsive properties that allow them to resist and even counteract the forces to which they are subjected, being a central mediator of cellular mechano-responses.


Figures

Fig. 1 |
Fig. 1 |. MTs are deformed and stabilized in response to SCC in RPE1 cells.
a, Illustration of the SCC assay. b, Inverted IF images of micropatterned RPE1 cells with/without 10 cycles of SCC at 10% strain, stained for α-tubulin (grey) and DNA (magenta). Scale bar, 10 μm. c, Zoomed-in images of the MTs in peripheral regions of the representative cells in b. Scale bar, 5 μm. d, Schematic illustrating the characteristic wavelength quantification of deformed MTs. e, Azimuth orientation graph of MTs representing the MT waviness in cortical regions of 20 cells with/without SCC (three independent experiments). f, Violin plots of MT characteristic wavelength in −SCC/+SCC conditions (n = 20 cells, three independent experiments). g, Inverted IF images of RPE1 cells, stained for α-tubulin in varying conditions. The stretching axis is parallel to 0°. Scale bar, 10 μm. h, Violin plots of the total MT length of micropatterned RPE1 cells in varying conditions (−SCC/−NZ, 72 cells; +SCC/−NZ, 54 cells; −SCC/+NZ, 42 cells; +SCC/+NZ, 49 cells; three independent experiments). i, EB1 relocalization along MT shafts in RPE1 cells in response to SCC, stained for α-tubulin (grey) and EB1 (cyan). Scale bars, 10 μm (merged) and 2 μm (zoomed in). j, Inverted IF images of EB1 (top) and violin graph of the length (n = 150 comets, three independent experiments) and total number (n = 7 cells, three independent experiments) of EB1 comets (bottom). Scale bar, 2 μm. k, IF images of individual MTs and EB1 comets in cytoplasts with/without SCC (top) and the corresponding linescan profiles of normalized fluorescence intensity (bottom) (n = 20 MTs from 10 cells, three independent experiments). Data are shown as mean ± s.d. Scale bar, 1 μm. l, Kymographs (left) and growth rate quantification of GFP-EB1 in cells with/without SCC (right) (n = 994 comets, two independent experiments). Scale bar, 2 μm. m, Histogram of EB1 lifetime distribution with Gaussian fit functions with/without SCC (n = 150 comets, three independent experiments). The panels in i and k are the representative examples of at least three independent experiments. P < 0.05 indicates a statistically significant difference by a two-tailed, Mann–Whitney non-parametric test. The medians are represented in the violin plots (solid line).
Fig. 2 |
Fig. 2 |. MTs are stabilized in response to SCC in enucleated RPE1 cells (cytoplasts).
a, Illustration of geometrical transformation from a disc to a rectangular shape. The dashed box indicates the transformed region for analysis. b, Inverted IF images of RPE1 cytoplasts with/without SCC, stained for α-tubulin (left) and the corresponding transformed images (right). The colour-coded images indicate the local MT orientation. The arrows in IF and colour-coded images indicate the corresponding SCC axis in both raw and transformed images. Scale bar, 10 μm. c, Orientation polar graph of the MTs in cytoplasts in transformed images with/without SCC (n = 31 cytoplasts, four independent experiments). Here R and C represent the radial and circumferential orientation, respectively. The means are represented by the solid lines. d, Inverted IF images of cortical regions (azimuth angle is from 0° to 90°) of RPE1 cytoplasts with/without SCC, stained for α-tubulin (top) and the corresponding azimuth orientation analysis of MTs (bottom) that indicate the local MT waviness (n = 11 cytoplasts, four independent experiments). Scale bar, 5 μm. e, Violin plots of MT characteristic wavelength in two conditions (n = 20 cytoplasts, four independent experiments). f, Inverted IF images of RPE1 cytoplasts stained for α-tubulin (left) and the corresponding colour-coded orientation images in −SCC/+NZ and +SCC/+NZ conditions. Scale bar, 10 μm. g, Violin plots of the total MT length of micropatterned RPE1 cytoplasts in varying conditions (−SCC/−NZ, 49 cytoplasts; +SCC/−NZ, 39 cytoplasts; −SCC/+NZ, 41 cytoplasts; +SCC/+NZ, 68 cytoplasts; three independent experiments). h, Orientation polar graph of MTs in RPE1 cytoplasts in −SCC/+NZ and +SCC/+NZ conditions (n = 20 cytoplasts, three independent experiments). The means are depicted. P < 0.05 indicates a statistically significant difference by a two-tailed, Mann–Whitney non-parametric test. The medians were depicted in the violin plots (solid line).
Fig. 3 |
Fig. 3 |. Characteristic timescales of MT mechano-stabilization.
a, Illustration of the experimental procedure to test the effect of stretching cycles on the amount of NZ-resistant MTs in micropatterned RPE1 cytoplasts. b, Inverted IF images of NZ-resistant MTs in individual micropatterned RPE1 cytoplasts after different stretching cycles. Scale bar, 10 μm. c, Violin plots of total NZ-resistant MT length of micropatterned RPE1 cytoplasts after different stretching cycles (1 cycle, 16 cytoplasts, 2 cycles, 16 cytoplasts; 4 cycles, 20 cytoplasts; 6 cycles, 21 cytoplasts; 8 cycles, 21 cytoplasts; 10 cycles, 17 cytoplasts; three independent experiments). d, Illustration of the experimental procedure to test the survival time threshold of NZ-resistant MTs in micropatterned RPE1 cytoplasm after SCC treatment. e, Inverted IF images of NZ-resistant MTs in individual micropatterned RPE1 cytoplasts at different time intervals. Scale bar, 10 μm. f, Violin plots of total NZ-resistant MT length of micropatterned RPE1 cytoplasts at different time intervals (0 min, 49 cytoplasts; 5 min, 38 cytoplasts; 10 min, 32 cytoplasts; 30 min, 18 cytoplasts; 60 min, 40 cytoplasts; three independent experiments). The panels in b and e are the representative examples of at least three independent experiments. P < 0.05 indicates a statistically significant difference by a Kruskal–Wallis non-parametric test with Dunn’s multiple comparisons. The medians were represented in the violin plots (solid line).
Fig. 4 |
Fig. 4 |. CLASP2 is enriched along the MT shaft in response to SCC.
a, Representative IF images of RPE1 cytoplasts with/without SCC, stained for α-tubulin (grey) and EB1 (cyan). The dashed rectangle separately represents the region shown with α-tubulin or EB1 staining. Scale bars, 10 μm (merged) and 2 μm (zoomed in). b, Representative IF images of individual MTs and EB1 comets in cytoplasts with/without SCC (top) and the corresponding linescan profiles of normalized fluorescence intensity (bottom) (n = 20 MTs from 10 cytoplasts, three independent experiments). Data are shown as mean ± s.d. Scale bar, 2 μm. c, IF images of RPE1 cytoplasts with/without SCC, stained for α-tubulin (grey) and CLASP2 (magenta). The dashed rectangle designates a region shown with α-tubulin or CLASP2 channel isolated. Scale bars, 10 μm (merged) and 2 μm (zoomed in). d, IF images of individual MTs and CLASP2 comets in cytoplasts with/without SCC. e, Scatter plot of binding fraction and the number of CLASP2 along the length of MTs in four conditions (n = 20 cytoplasts, three independent experiments). Data are shown as mean ± s.d. P < 0.05 indicates a statistically significant difference by a two-tailed, Mann–Whitney non-parametric test. e, Histogram of the fraction of CLASP2 binding on specific regions including growing ends, curvature peak and crossing sites of MTs (schematic illustrating the specific binding regions) (n = 40 regions of interest of 10 cytoplasts, three independent experiments). Data are shown as mean ± s.d. P < 0.05 indicates a statistically significant difference by a Kruskal–Wallis non-parametric test with Dunn’s multiple comparisons. f, Illustration of the relocalization of tip proteins along MT shafts in response to SCC. The panels in a are the representative examples of at least three independent experiments.
Fig. 5 |
Fig. 5 |. CLASP2 supports MT mechano-stabilization.
a, CLASP2 levels of WT and KO RPE1 cells (two alleles of CLASP2 were removed using CRISPR–Cas9 (KO#22 and KO#19) and WT as control) measured by immunoblotting. b, IF images of WT REP1 and CLASP2 KO (CLASP2−/−) cells stained for α-tubulin and CLASP2. The solid rectangle represents a region shown with α-tubulin or CLASP2 channel isolated. Scale bars, 10 μm (merged) and 5 μm (zoomed in). c, Inverted IF images of WT RPE1 and CLASP2−/− cytoplasts in −SCC/−NZ and −SCC/+NZ conditions. The right panel indicates the scatter plot of the total MT length in different conditions (n = 20 cytoplasts, three independent experiments). Scale bar, 10 μm. d, Inverted IF images of WT RPE1 and CLASP2−/− cytoplasts in +SCC/– NZ and +SCC/+NZ conditions. The right panel indicates the scatter plot of the total MT length in different conditions (n = 20 cytoplasts, three independent experiments). Scale bar, 10 μm. e, Inverted IF images of RPE1 cytoplasts expressed by GFP-CLASP2 stained for α-tubulin and the right panel indicates the scatter plot of the total MT length in cytoplasts. (−SCC/−NZ and +SCC/−NZ conditions, 30 cytoplasts; −SCC/+NZ and +SCC/+NZ conditions, 32 cytoplasts; three independent experiments). Scale bar, 10 μm. The panels in a and b are the representative examples of at least three independent experiments. P < 0.05 indicates a statistically significant difference by a two-tailed, Mann–Whitney non-parametric test. Data are shown as mean ± s.d.
Fig. 6 |
Fig. 6 |. Cell migration through constrictions depends on the mechano-stabilization of MTs.
a, Illustration of cell migration through a constriction (4 μm; left) and related IF image (right) stained for SiR-tubulin (cyan) and Hoechst (magenta) labelling. b, Inverted IF images of MTs after NZ treatment for WT RPE1 cells migrating through a straight channel (top) and constriction (bottom) (nine-cell projection). c, Violin plots of total NZ-resistant MT length for WT and CLASP2–/– RPE1 cells during migration (n = 20 cells). d, Violin plots of total NZ-resistant MT length of CLASP2−/− RPE1 migrating cells before and after passing through the constriction (n = 22 cells). e, Projected images of EB3–GFP RPE1 cells passing through a straight channel and constriction (period, 4 min; time interval, 1 s). f, Violin plots of the mean velocity of EB3 comets (826 comets for straight and 1,106 comets for constriction, tracked from 9 cells). g, IF images of WT RPE1 cells passing through different channels, stained for α-tubulin (grey) and EB1 (cyan). The histogram of the number of EB1 comets along the length of MTs (n = 11 cells) is shown. Data are shown as mean ± s.d. h, IF images of WT RPE1 cell passing through a constriction, stained for α-tubulin (grey), CLASP2 (magenta) and nucleus (cyan). i, Corresponding linescan profiles of normalized fluorescence intensity of CLASP2 (n = 11 cells). j, Inverted IF images of MTs after NZ treatment for CLASP2−/− REP1 cells migrating through a straight channel (top) and constriction (bottom) (nine-cell projection). k, Violin plots of total NZ-resistant MT length of CLASP2−/− RPE1 cells during migration (n = 15 cells). l,m, Color-coded projection of SiR-tubulin-labelled WT and CLASP2−/− RPE1 cells migrating through the straight channel (l) and constriction (m) (left; period, 9 h; time interval, 10 min), and trajectories of the cell leading edge (right). Time 0 is when the cells are entering the straight channel or a constriction (WT, 21 cells; CLASP2−/−, 22 cells). The samples in all the panels are examined over at least three independent experiments. Scale bars, 10 μm (a, b, e, g, h and j) and 50 μm (l and m). P < 0.05 indicates a statistically significant difference by a two-tailed, Mann–Whitney non-parametric test.

References

    1. Heisenberg C-PP & Bellaïche Y. Forces in tissue morphogenesis and patterning. Cell 153, 948–962 (2013). - PubMed
    1. Akhmanova A. & Kapitein LC Mechanisms of microtubule organization in differentiated animal cells. Nat. Rev. Mol. Cell Biol 23, 541–558 (2022). - PubMed
    1. Hamant O, Inoue D, Bouchez D, Dumais J. & Mjolsness E. Are microtubules tension sensors? Nat. Commun. 10, 2360 (2019). - PMC - PubMed
    1. Gittes F, Mickey B, Nettleton J. & Howard J. Flexural rigidity of microtubules and actin filaments measured from thermal fluctuations in shape. J. Cell Biol. 120, 923–934 (1993). - PMC - PubMed
    1. Garzon-Coral C, Fantana HA & Howard J. A force-generating machinery maintains the spindle at the cell center during mitosis. Science 352, 1124–1127 (2016). - PMC - PubMed