. 2023 Aug;8(8):1534-1548.
doi: 10.1038/s41564-023-01418-7. Epub 2023 Jun 29.

Parabacteroides distasonis uses dietary inulin to suppress NASH via its metabolite pentadecanoic acid

Affiliations

Parabacteroides distasonis uses dietary inulin to suppress NASH via its metabolite pentadecanoic acid

Wenchao Wei et al. Nat Microbiol. 2023 Aug.

Abstract

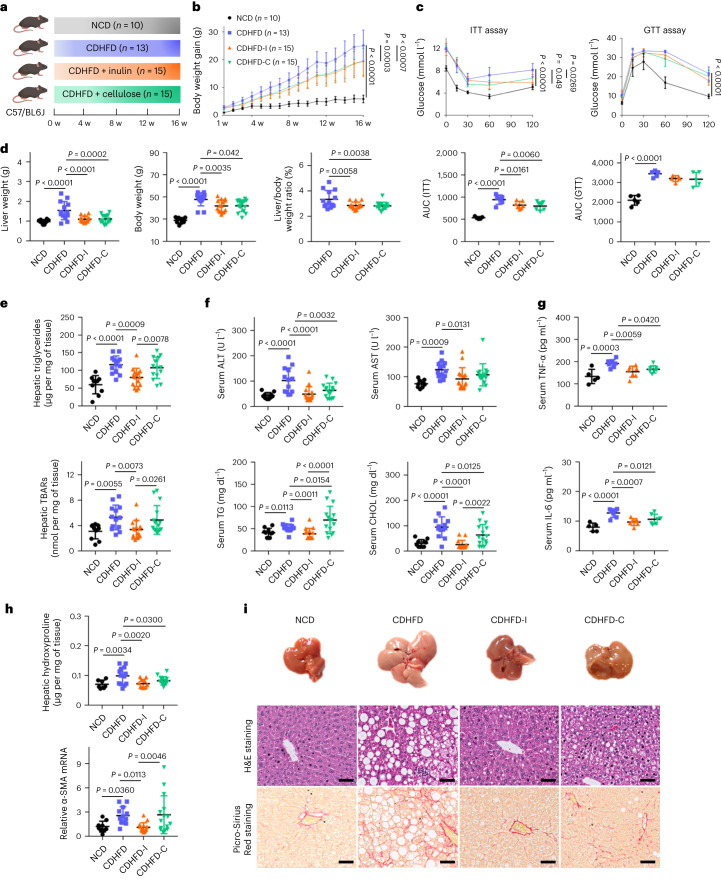
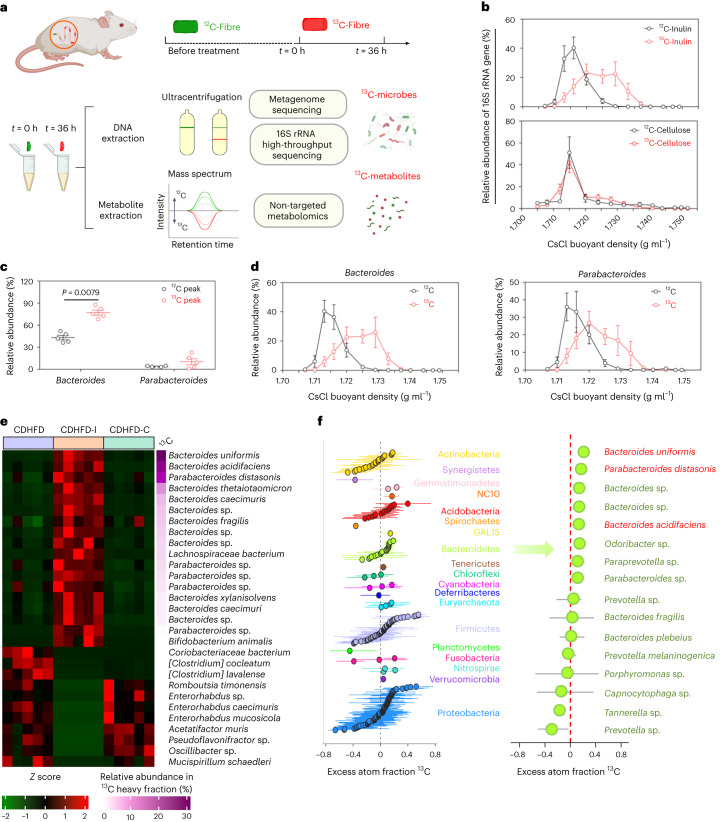
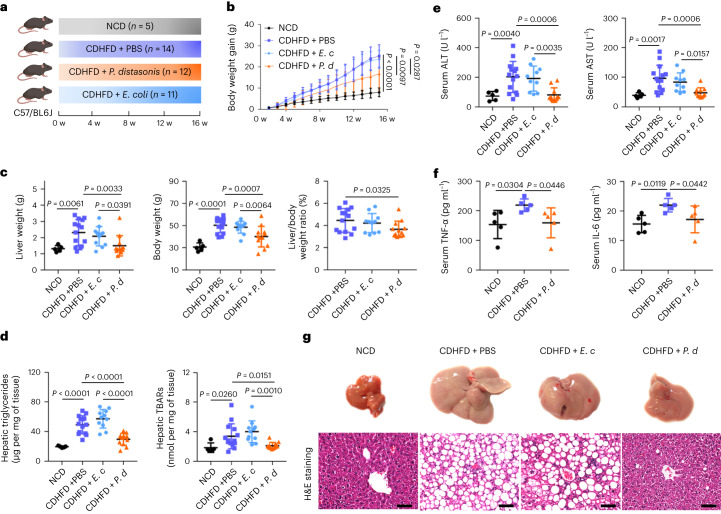
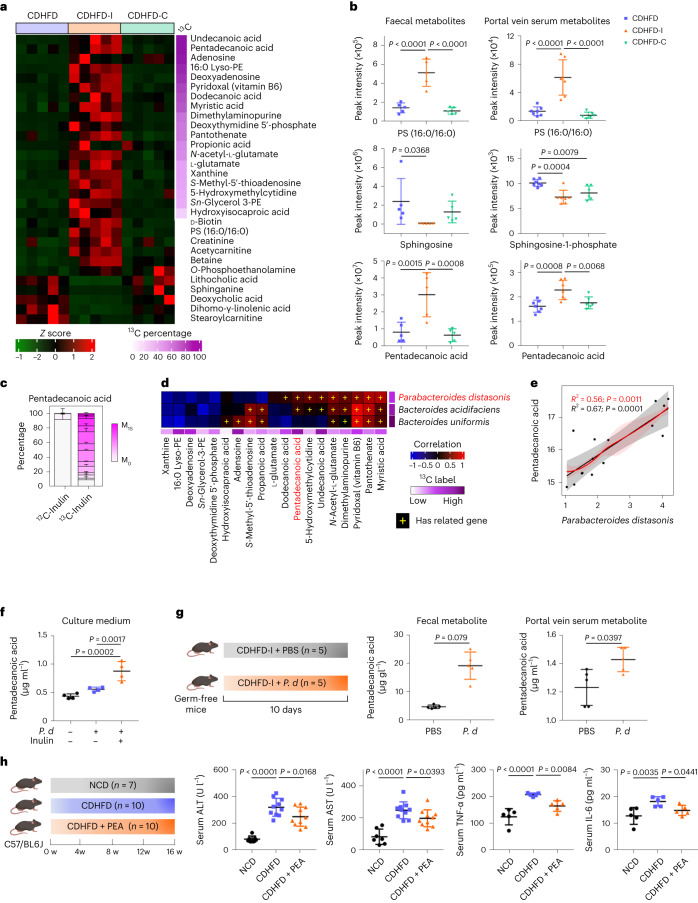
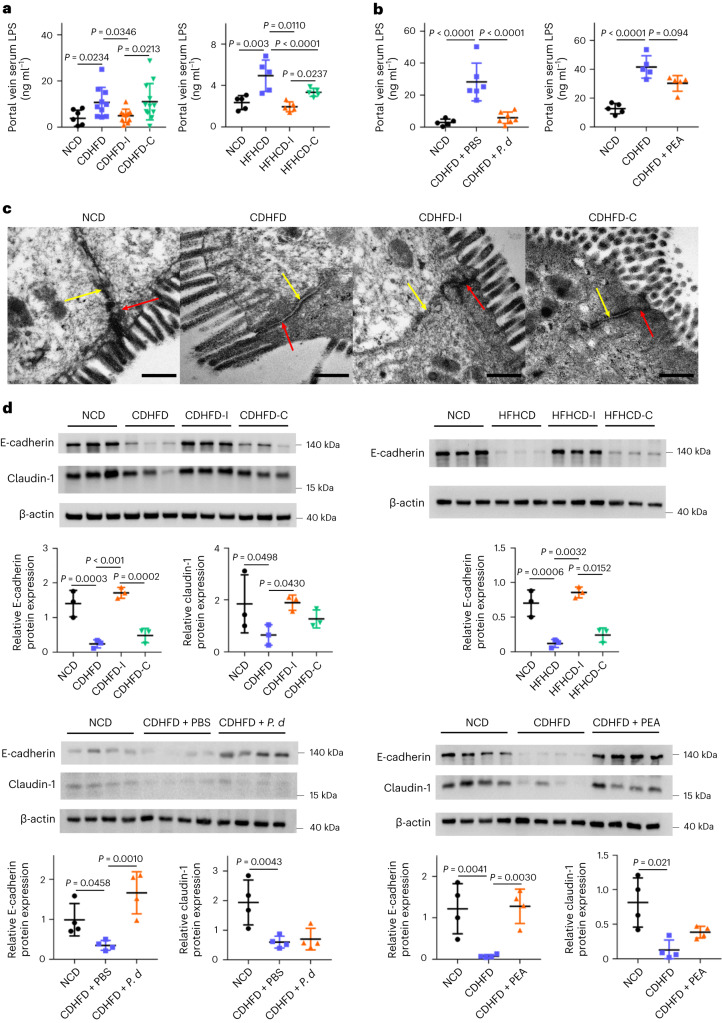
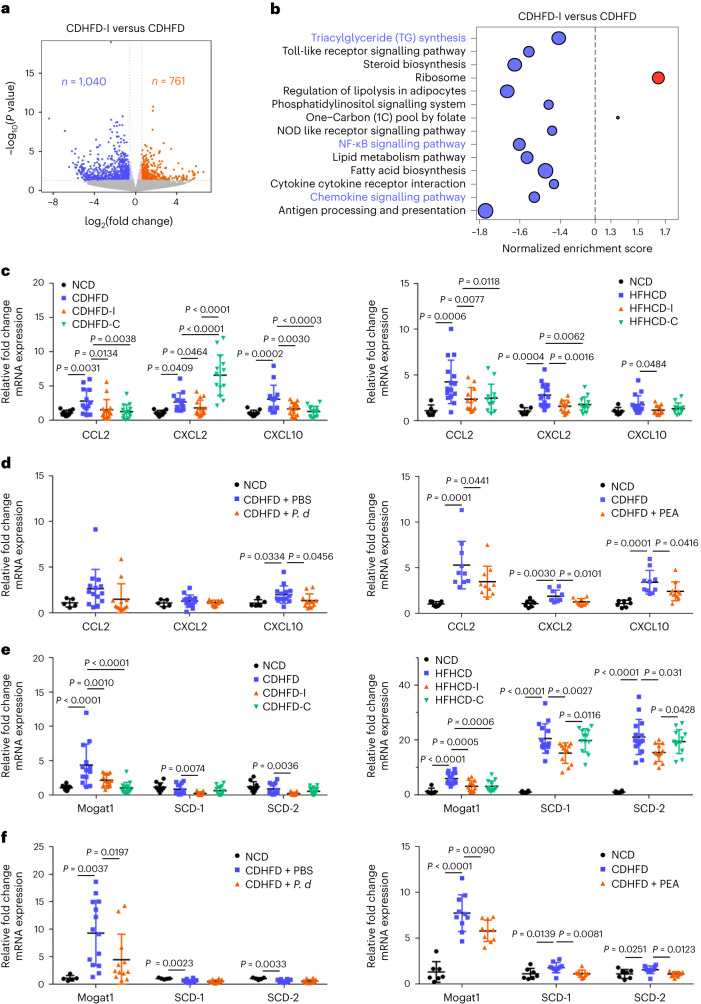
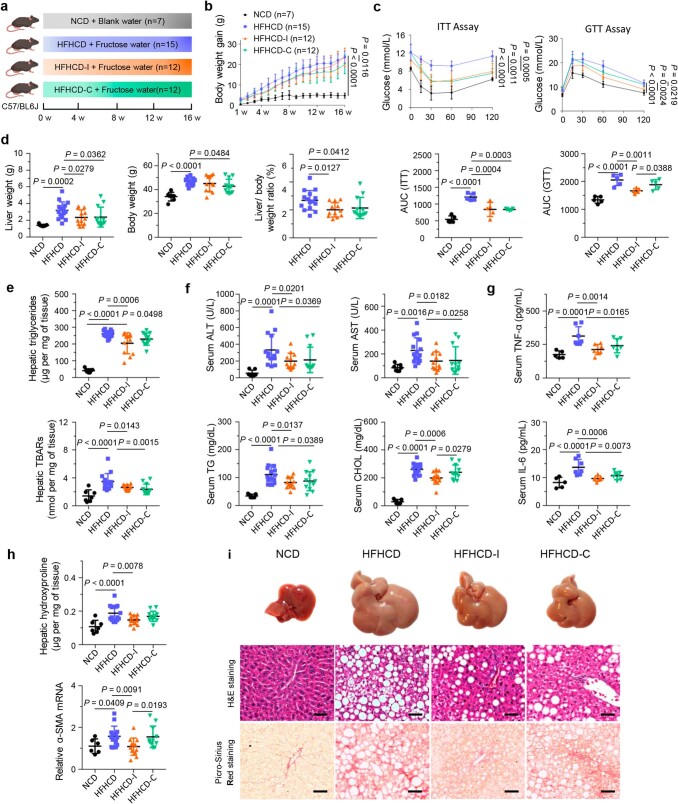
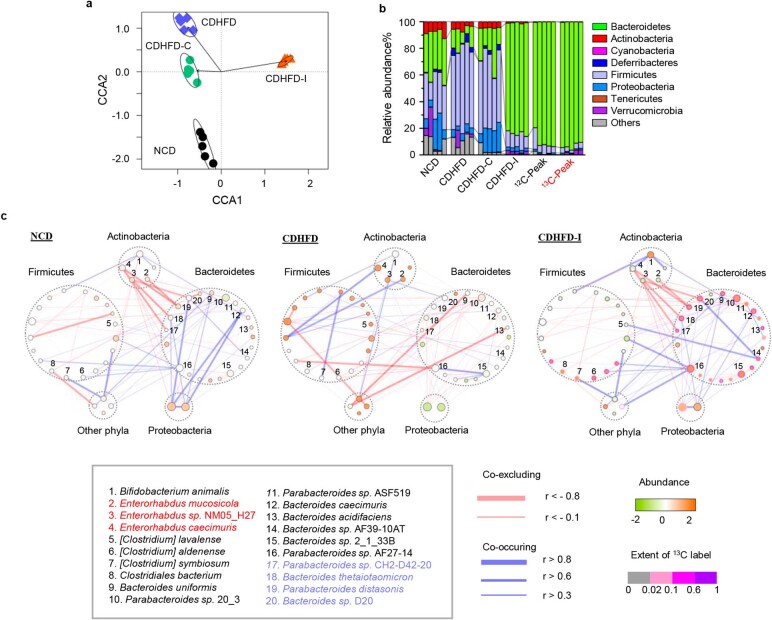
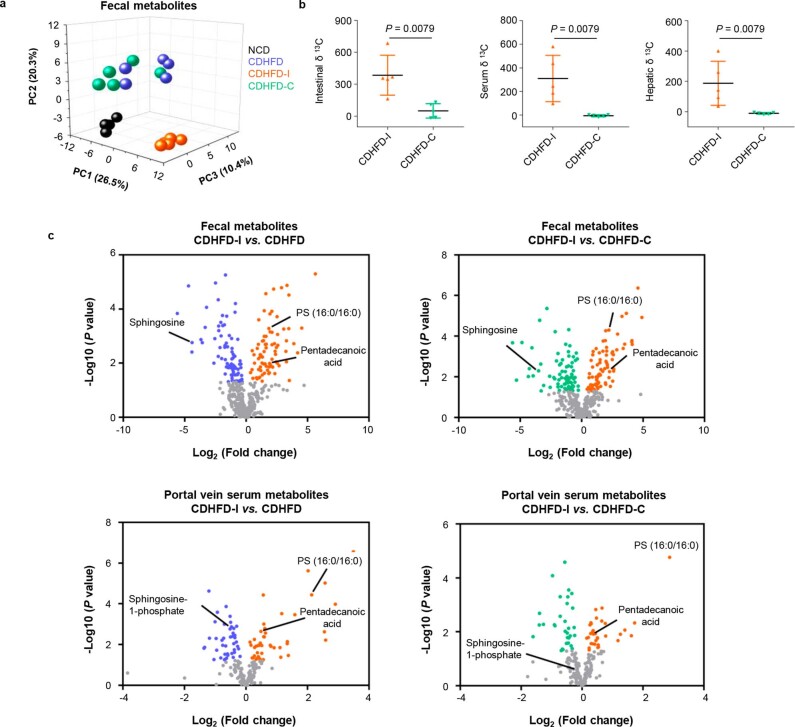
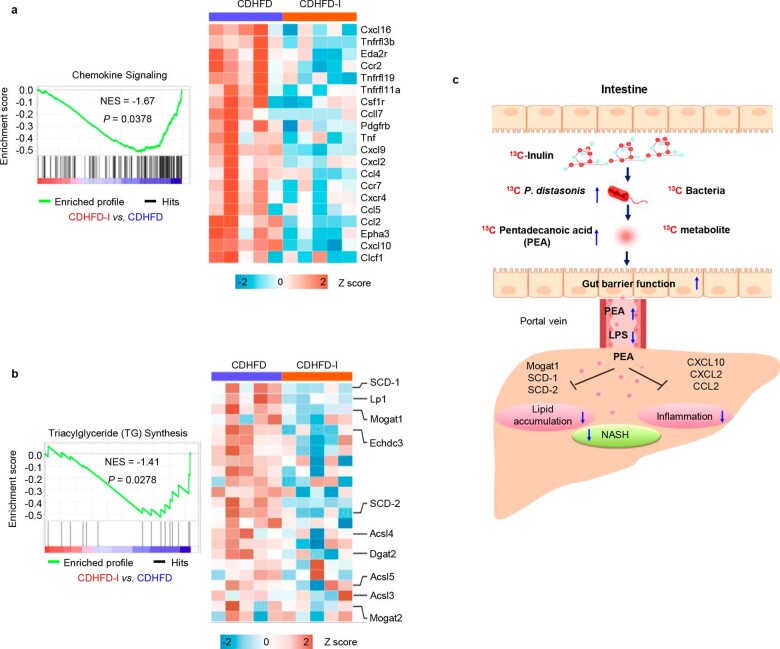
Non-alcoholic steatohepatitis (NASH) is the severe form of non-alcoholic fatty liver disease, and is characterized by liver inflammation and fat accumulation. Dietary interventions, such as fibre, have been shown to alleviate this metabolic disorder in mice via the gut microbiota. Here, we investigated the mechanistic role of the gut microbiota in ameliorating NASH via dietary fibre in mice. Soluble fibre inulin was found to be more effective than insoluble fibre cellulose to suppress NASH progression in mice, as shown by reduced hepatic steatosis, necro-inflammation, ballooning and fibrosis. We employed stable isotope probing to trace the incorporation of 13C-inulin into gut bacterial genomes and metabolites during NASH progression. Shotgun metagenome sequencing revealed that the commensal Parabacteroides distasonis was enriched by 13C-inulin. Integration of 13C-inulin metagenomes and metabolomes suggested that P. distasonis used inulin to produce pentadecanoic acid, an odd-chain fatty acid, which was confirmed in vitro and in germ-free mice. P. distasonis or pentadecanoic acid was protective against NASH in mice. Mechanistically, inulin, P. distasonis or pentadecanoic acid restored gut barrier function in NASH models, which reduced serum lipopolysaccharide and liver pro-inflammatory cytokine expression. Overall this shows that gut microbiota members can use dietary fibre to generate beneficial metabolites to suppress metabolic disease.


Conflict of interest statement

The authors declare no competing interests.

Figures

Fig. 1
Fig. 1. Inulin ameliorated CDHFD-induced NASH in mice.
a, Study design of the CDHFD-induced NASH model. Created with BioRender.com. b, Body weight curve under different treatments. Data are presented as the mean of biological replicates ± s.d. P value obtained by two-way ANOVA with Fisher’s LSD test. c, Insulin tolerance and glucose tolerance tests. Between five and seven mice were used in each group in the insulin tolerance test (ITT): NCD (n = 5), CDHFD (n = 6), CDHFD-I (n = 7) and CDHFD-C (n = 7). Five mice were used in each group in the glucose tolerance test (GTT). Data are presented as the mean of biological replicates ± s.d. P value obtained by two-way ANOVA with Fisher’s LSD test for the growth curve, or one-way ANOVA with Fisher’s LSD test for area under the curve. d, Liver weight, body weight and liver-to-body weight ratio. e, Hepatic TG and TBARs. f, Serum ALT, AST, TG and CHOL. df, Between 10 and 15 mice were used in each group: NCD (n = 10), CDHFD (n = 13), CDHFD-I (n = 15) and CDHFD-C (n = 15). g, Serum TNF-α and IL-6. Between five and seven mice were used in each group: NCD (n = 5), CDHFD (n = 7), CDHFD-I (n = 7) and CDHFD-C (n = 7). h, Hepatic hydroxyproline and α-SMA mRNA. Between 7 and 15 mice were used in each group for the hepatic hydroxyproline assay: NCD (n = 7), CDHFD (n = 13), CDHFD-I (n = 11) and CDHFD-C (n = 15). Between 9 and 15 mice were used in each group for α-SMA mRNA expression: NCD (n = 9), CDHFD (n = 12), CDHFD-I (n = 15) and CDHFD-C (n = 15). i, Representative morphology, haematoxylin and eosin (H&E) staining, and Picro-Sirius Red staining of the liver from mice fed NCD, CDHFD, CDHFD-I and CDHFD-C. Scale bar, 50 µm. One slide per mouse was stained. dh, Data are presented as the mean of biological replicates ± s.d. P value obtained by one-way ANOVA with Fisher’s LSD method. Source data
Fig. 2
Fig. 2. Inulin altered gut microbiota.
a, Design and workflow of the 13C-labelling experiment. Mice from the CDHFD-I and CDHFD-C groups received 13C-fibre (13C-inulin or 13C-cellulose) in the diet for 36 h. Mouse stools were collected at 0 and 36 h. The extracted faecal DNA was fractionated by gradient density ultracentrifugation to separate 13C-labelled ‘heavy’ DNA, and was analysed by metagenomic and 16S rRNA sequencing. Faecal metabolites were profiled by non-targeted metabolomics analysis. Created with BioRender.com. b, Quantitative distribution of 16S rRNA gene from mice receiving 13C-inulin or 13C-cellulose for 36 h compared with non-labelled samples (0 h), n = 5 per group. c, Relative abundance of Bacteroides and Parabacteroides from mice fed CDHFD-13C-inulin for 0 h (12C) and 36 h (13C) (n = 5 per group), respectively. P value determined by two-tailed Mann–Whitney U-test. d, Relative distribution of Bacteroides or Parabacteroides across gradient densities, based on 16S rRNA sequencing abundance, normalized to total 16S rRNA expression by qPCR, n = 5 per group. e, Heatmap of different bacterial species in mice fed CDHFD, CDHFD-I or CDHFD-C. f, q-SIP showing the excess atom fraction of 13C in individual OTUs. Points are coloured according to their phylum category. Error bars represent 90% confidence interval. Key OTUs belonging to Bacteroidetes are presented on the right, n = 5 per group. bd, Data are presented as the mean of biological replicates ± s.e.m. Source data
Fig. 3
Fig. 3. P. distasonis ameliorated CDHFD-induced NASH in mice.
a, Study design of the CDHFD-induced NASH model with bacteria treatment. Created with BioRender.com. b, Body weight curve. c, Liver weight, body weight and liver-to-body weight ratio. d, Hepatic TG and hepatic TBARs. bd, Between 5 and 14 mice were used in each group: NCD (n = 5), CDHFD + PBS (n = 14), CDHFD + E. coli (E. c) (n = 11) and CDHFD + P. distasonis (P. d) (n = 12). e, Serum ALT and AST. Between 5 and 14 mice were used in each group: NCD (n = 5), CDHFD + PBS (n = 14), CDHFD + E. c (n = 10) and CDHFD + P. d (n = 11). f, Serum TNF-α and IL-6, n = 5 per group. g, Representative morphology, haematoxylin and eosin staining of liver from mice fed NCD, CDHFD + PBS, CDHFD + E. c and CDHFD + P. d. Scale bars, 50 µm. One slide per mouse was stained. bf, Data are presented as the mean of biological replicates ± s.d. P value obtained by one-way ANOVA with Fisher’s LSD. Source data
Fig. 4
Fig. 4. Inulin modulated gut metabolites.
a, Heatmap of representative faecal metabolites in mice fed CDHFD, CDHFD-I and CDHFD-C. The right-hand side represents the percentage of 13C-labelling for each metabolite. Lyso-PE, lysophosphatidylethanolamine; PS, phosphatidylserine; sn-glycerol 3-PE, sn-glycerol 3-phosphoethanolamine. b, Quantification of representative metabolites in faecal (n = 5 per group) and portal vein serum (n = 6–7 per group). c, Isotopologue distribution of labelled pentadecanoic acid in stool from mice treated with CDHFD-I (n = 3), data are presented as the mean of biological replicates ± s.e.m. d, Correlation analysis between 13C-labelled bacteria and metabolites by partial Spearman’s correlation. Plus signs indicate that the bacteria expressed genes necessary for the biosynthesis of the respective metabolites. e, Correlation between P. distasonis and pentadecanoic acid abundance with (red) and without (grey) correction. Error bands indicate the 95% confidence interval. f, Targeted metabolomic analysis of pentadecanoic acid in blank medium or P. distasonis conditioned medium with or without the addition of inulin, n = 4 per group. g, Experimental design of P. distasonis (P. d) gavage in germ-free mice fed with CDHFD-I. Created with BioRender.com. Pentadecanoic acid was detected in faeces and portal vein serum, n = 5 per group. h, Effect of pentadecanoic acid (0.4%) on CDHFD diet-induced liver damage. Created with BioRender.com. Between 7 and 10 mice were used in the serum ALT and AST tests: NCD (n = 7), CDHFD (n = 10), and CDHFD + pentadecanoic acid (PEA) (n = 10). Five mice from each group were used for serum TNF-α and IL-6 tests. b, fh, Data are presented as biological replicates ± s.d. P value obtained by one-way ANOVA with Fisher’s LSD. Source data
Fig. 5
Fig. 5. Inulin, P. distasonis and pentadecanoic acid restored gut barrier function.
a, Portal vein serum LPS in CDHFD- or HFHCD-induced NASH mouse models treated with inulin or cellulose. Between 7 and 12 mice were used in each group in the first model: NCD (n = 7), CDHFD (n = 10), CDHFD-I (n = 10) and CDHFD-C (n = 12). Five mice were used in each group in the second model. b, Portal vein serum LPS in a CDHFD-induced NASH model treated with P. distasonis or pentadecanoic acid. Between five and seven mice were used in each group. c, Representative TEM images of the gut epithelium from mice fed NCD, CDHFD, CDHFD-I or CDHFD-C. Scale bars, 400 nm. Red and yellow arrows indicate a tight junction and adherence junction, respectively. d, Tight and adherence junction marker expression in NASH mouse models treated with inulin, cellulose, P. distasonis (P. d) or PEA, n = 3–4 per group. a,b,d, Data are presented as biological replicates ± s.d. P value obtained by one-way ANOVA with Fisher’s LSD. Source data
Fig. 6
Fig. 6. Inulin suppressed hepatic inflammation and TG synthesis pathways through enriching P. distasonis and pentadecanoic acid.
RNA-seq analysis of liver tissues from mice fed CDHFD or CDHFD-I. a, Volcano plot showing differentially expressed genes. b, Kyoto Encyclopedia of Genes and Genomes pathway enrichment. Five mice were used in each group. P value determined by DESeq2. c,d, qPCR validation of pro-inflammatory cytokines in the liver tissues from mouse NASH models treated with inulin (c), cellulose (c), P. distasonis (P. d) (d) or PEA (d). e,f, qPCR validation of triacylglyceride synthesis genes in the liver tissues in mouse NASH models supplemented with inulin (e), cellulose (e), P. d (f) or PEA (f). c,e, Between 10 and 15 mice were used for CDHFD-induced NASH models: NCD (n = 10), CDHFD (n = 13), CDHFD-I (n = 15) and CDHFD-C (n = 14). Between 6 and 15 mice were used for HFHCD-induced NASH models: NCD (n = 6), HFHCD (n = 15), HFHCD-I (n = 12) and HFHCD-C (n = 12). d,f, Between 5 and 14 mice were used for the CDHFD treated with P. d experiments: NCD (n = 5), CDHFD + PBS (n = 14) and CDHFD + P. d (n = 12). Between 7 and 10 mice were used for the CDHFD treated with PEA experiments: NCD (n = 5), CDHFD (n = 10) and CDHFD + PEA (n = 10). cf, Data are presented as means of biological replicates ± s.d. P value obtained by one-way ANOVA with Fisher’s LSD. Source data
Extended Data Fig. 1
Extended Data Fig. 1. Inulin ameliorated HFHCD induced NASH in mice.
a Study design of high fat high cholesterol diet (HFHCD) + fructose water induced NASH model (Created with BioRender.com). b Body weight curve under different treatments. Data are presented as mean of biological replicates ± s.d. P value obtained with two-way ANOVA Fisher’s LSD test. c Insulin tolerance and glucose tolerance tests. 5 mice were used in each group. Data are presented as mean of biological replicates ± s.d. P value obtained with two-way ANOVA Fisher’s LSD test for growth curve or one-way ANOVA Fisher’s LSD test for area under curve. d Liver weight, body weight, and the liver-to-body weight ratio. e Hepatic triglyceride and hepatic TBARs level. f Serum ALT, AST, triglyceride (TG), and cholesterol (CHOL). d-f 7–15 mice were used in each group, including NCD (n = 7), HFHCD (n = 15), HFHCD-I (n = 12), and HFHCD-C (n = 12). g Serum tumour necrosis factor alpha (TNF-α) and interleukin 6 (IL-6). 5–7 mice were used in each group, including NCD (n = 5), HFHCD (n = 7), HFHCD-I (n = 7), and HFHCD-C (n = 7). h Hepatic hydroxyproline and α-SMA mRNA. 7–15 mice were used in each group for hepatic hydroxyproline assay, including NCD (n = 7), HFHCD (n = 15), HFHCD-I (n = 12), and HFHCD-C (n = 12); 6–14 mice were used in each group for α-SMA mRNA expression, including NCD (n = 6), HFHCD (n = 14), HFHCD-I (n = 12), and HFHCD-C (n = 11). i Representative morphology, H&E staining, and Picro-Sirius Red staining of the liver from mice fed NCD, HFHCD, HFHCD-I, and HFHCD-C. scale bars, 50 µm. One slide per mouse was stained. d-h Data are presented as mean of biological replicates ± s.d. P value obtained with one-way ANOVA using Fisher’s LSD. Source data
Extended Data Fig. 2
Extended Data Fig. 2. Inulin altered gut microbiota composition and ecological network.
a Beta diversity (Constrained Correspondence Analysis) in the stool of mice fed NCD, CDHFD, CDHFD-I and CDHFD-C, respectively. b Phylum composition of gut microbiota from mice fed NCD, CDHFD, CDHFD-C, CDHFD-I, and peak fractions of un-labelled and labelled faecal DNA (12C-peak, 0 h; 13C-peak, 36 h). c Ecological network analysis among differentially abundant bacteria in NCD, CDHFD, and CDHFD-I group. Correlations were measured by SparCC. a-c 5 mice were used in each group.
Extended Data Fig. 3
Extended Data Fig. 3. Inulin altered gut metabolomics.
a Principal component analysis (PCA) of faecal metabolites from mice fed NCD, CDHFD, CDHFD-I, and CDHFD-C, respectively.5 mice were included in each group. b δ13C value in the intestinal tissue, serum and liver tissue of mice received 13C-inulin or 13C-cellulose (n = 5 per group) for 36 h. Data are presented as mean of biological replicates ± s.d. Statistical significance was determined by two tailed Mann-Whitney U test. c Volcano plots showing altered faecal or portal vein serum metabolites in CDHFD-I group compared to CDHFD group or CDHFD-C group. 5–7 mice were used in each group. P value was obtained by two tailed students’ t test.
Extended Data Fig. 4
Extended Data Fig. 4. Inulin ameliorated NASH through modulating Chemokine signaling and triacylglyceride synthesis pathway.
a Enrichment plots of chemokine signaling pathway and heatmap of differentially expressed pro-inflammatory genes. b Enrichment plot of triacylglyceride synthesis and heatmap of differentially expressed triacylglyceride synthesis genes. a,b, 5 mice were used in each group. P value obtained with gene set enrichment analysis. c The overall summary of this study. The supplementation of inulin in mouse NASH models lead to the enrichment of P. distasonis and pentadecanoic acid, which restores gut barrier function and downregulated NASH related regulatory pathway (Created with BioRender.com).

Comment in

Similar articles

Cited by

References

    1. Estes C, et al. Modeling NAFLD disease burden in China, France, Germany, Italy, Japan, Spain, United Kingdom, and United States for the period 2016–2030. J. Hepatol. 2018;69:896–904. doi: 10.1016/j.jhep.2018.05.036. - DOI - PubMed
    1. Nicolucci AC, et al. Prebiotics reduce body fat and alter intestinal microbiota in children who are overweight or with obesity. Gastroenterology. 2017;153:711–722. doi: 10.1053/j.gastro.2017.05.055. - DOI - PubMed
    1. Liping Z, et al. Gut bacteria selectively promoted by dietary fibers alleviate type 2 diabetes. Science. 2018;359:1151–1156. doi: 10.1126/science.aao5774. - DOI - PubMed
    1. Koopman N, Molinaro A, Nieuwdorp M, Holleboom AG. Review article: can bugs be drugs? The potential of probiotics and prebiotics as treatment for non-alcoholic fatty liver disease. Aliment. Pharmacol. Ther. 2019;50:628–639. doi: 10.1111/apt.15416. - DOI - PubMed
    1. Pérez-Montes de Oca A, Julián MT, Ramos A, Puig-Domingo M, Alonso N. icrobiota, fiber, and NAFLD: is there any connection? Nutrients. 2020;12:3100. doi: 10.3390/nu12103100. - DOI - PMC - PubMed

Publication types

Supplementary concepts

LinkOut - more resources