. 2023 Jul;25(7):989-1003.
doi: 10.1038/s41556-023-01163-3. Epub 2023 Jun 29.

mTORC2-NDRG1-CDC42 axis couples fasting to mitochondrial fission

Affiliations

mTORC2-NDRG1-CDC42 axis couples fasting to mitochondrial fission

Nuria Martinez-Lopez et al. Nat Cell Biol. 2023 Jul.

Abstract

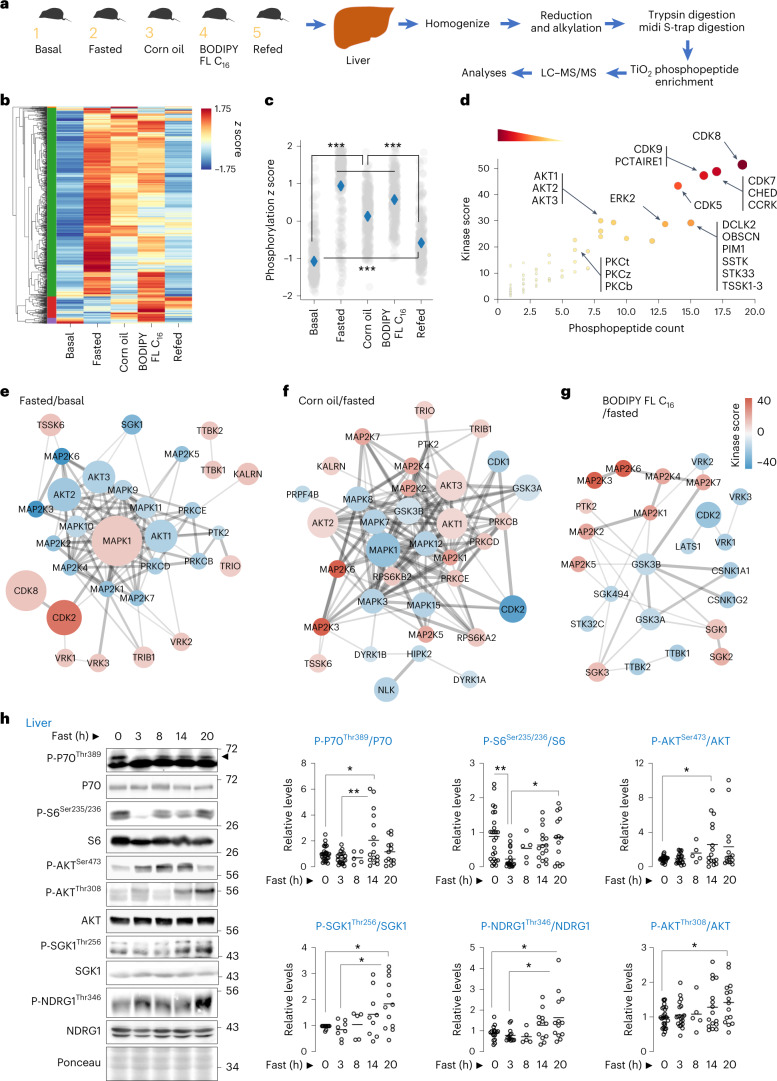
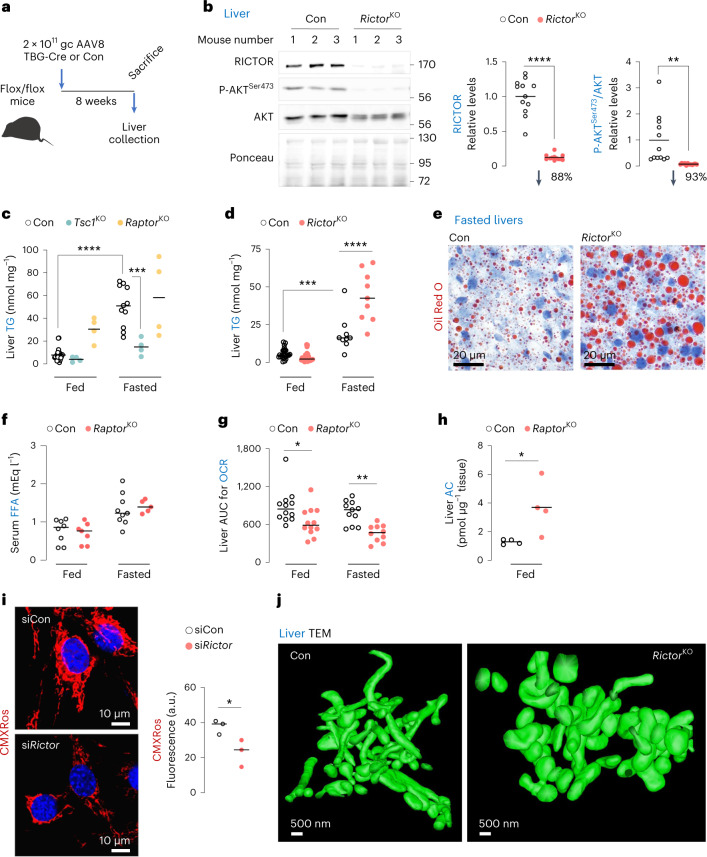
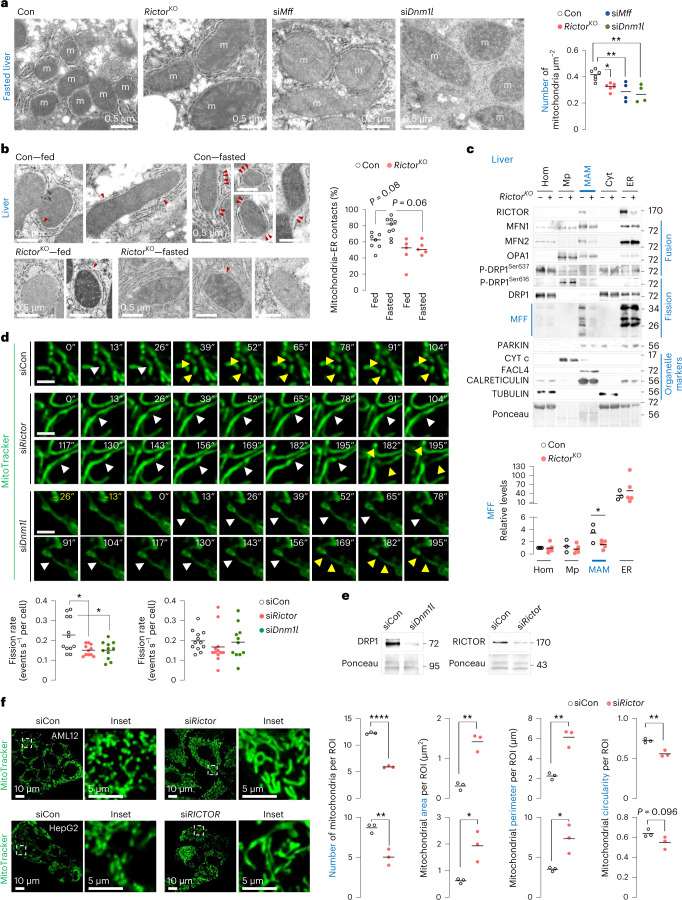
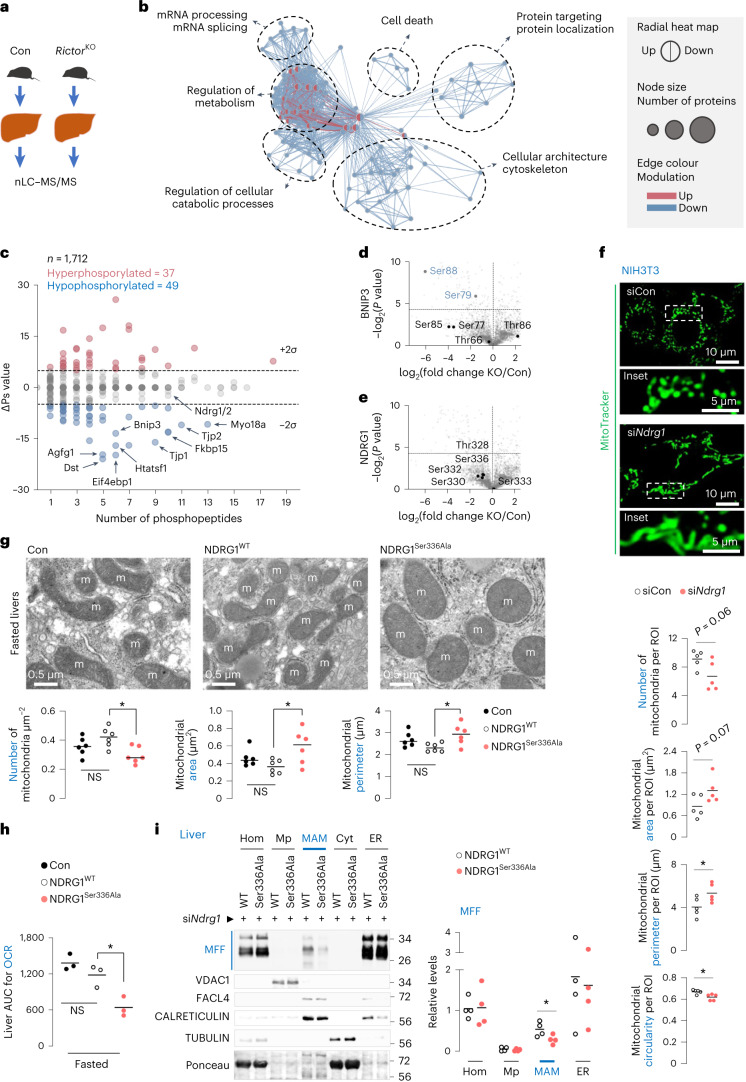
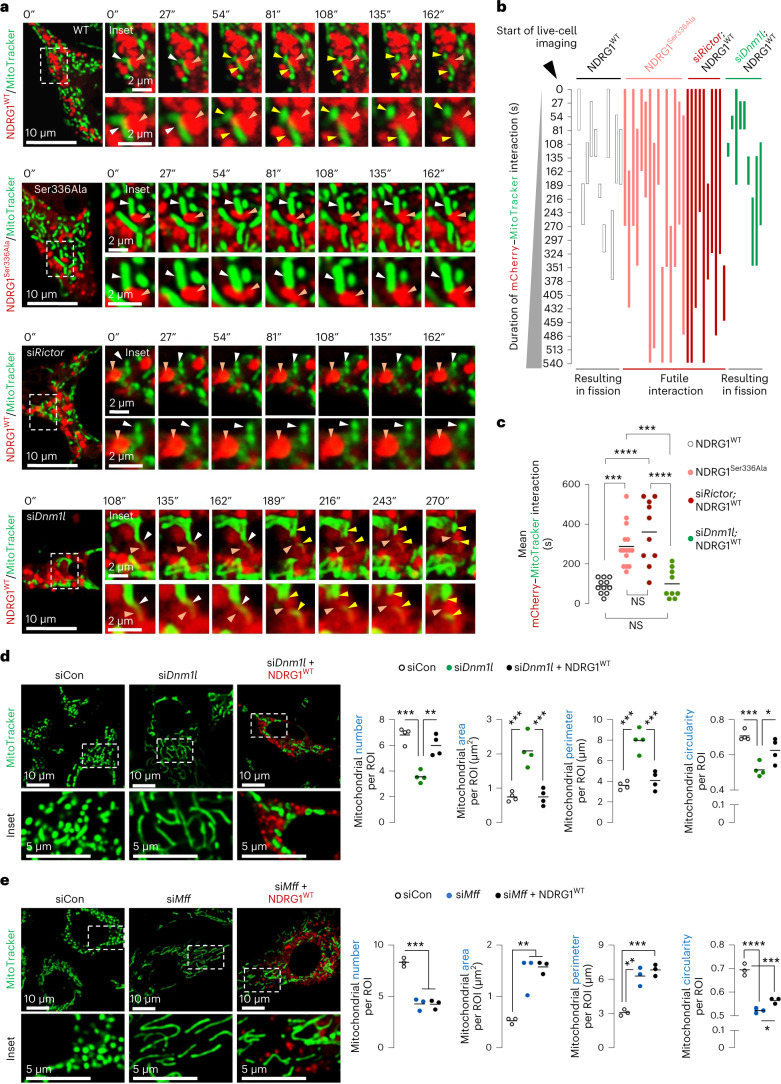
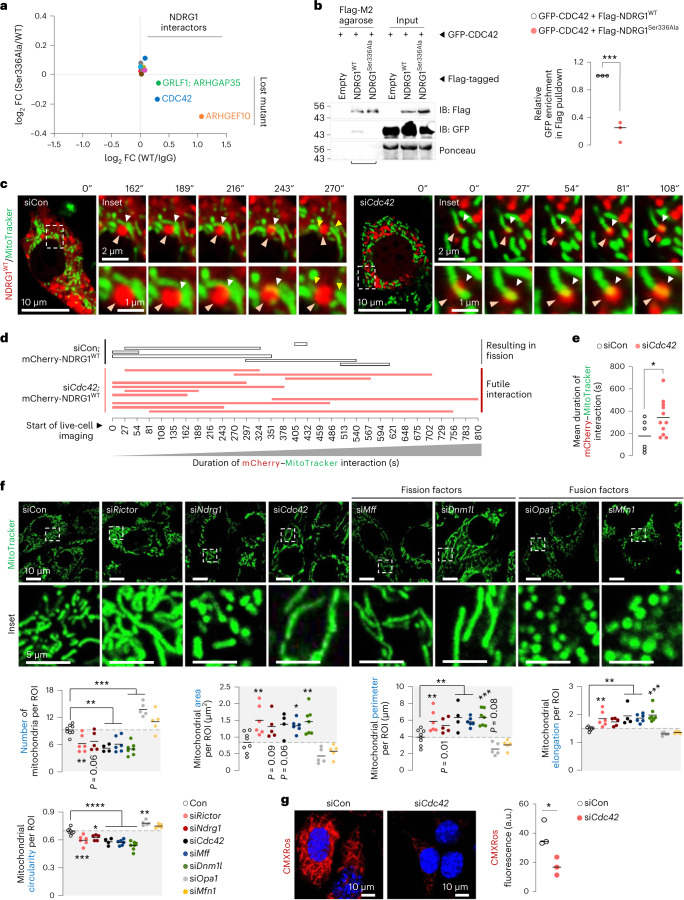
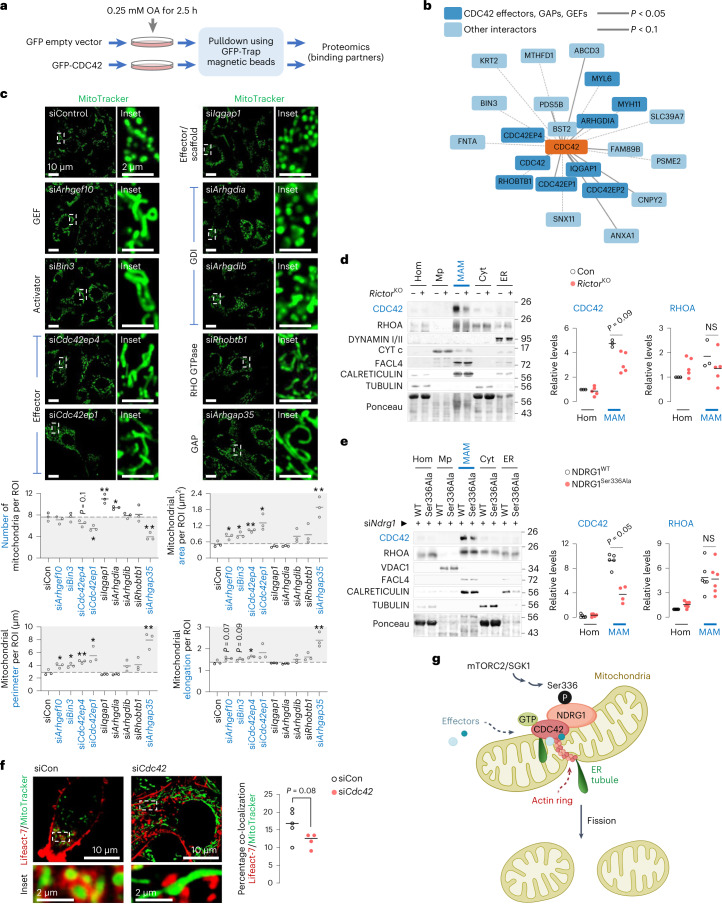
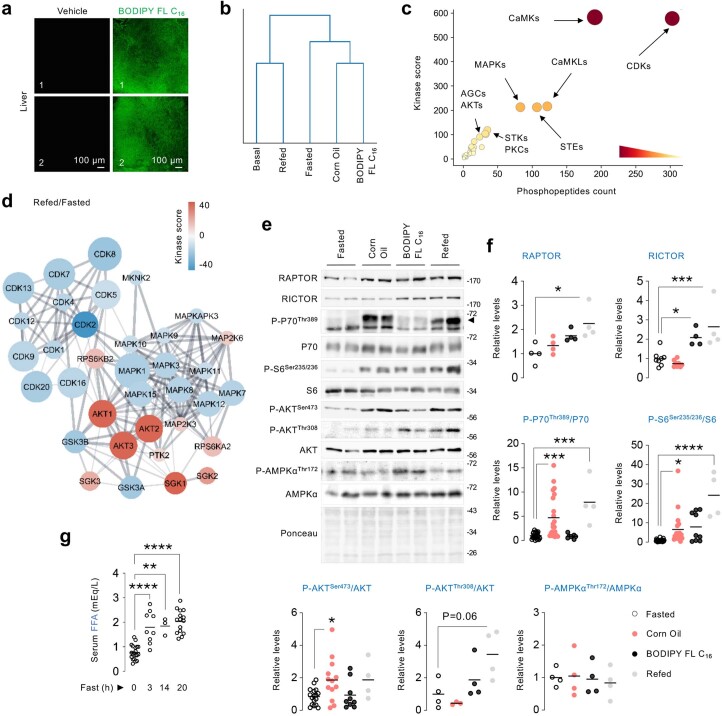
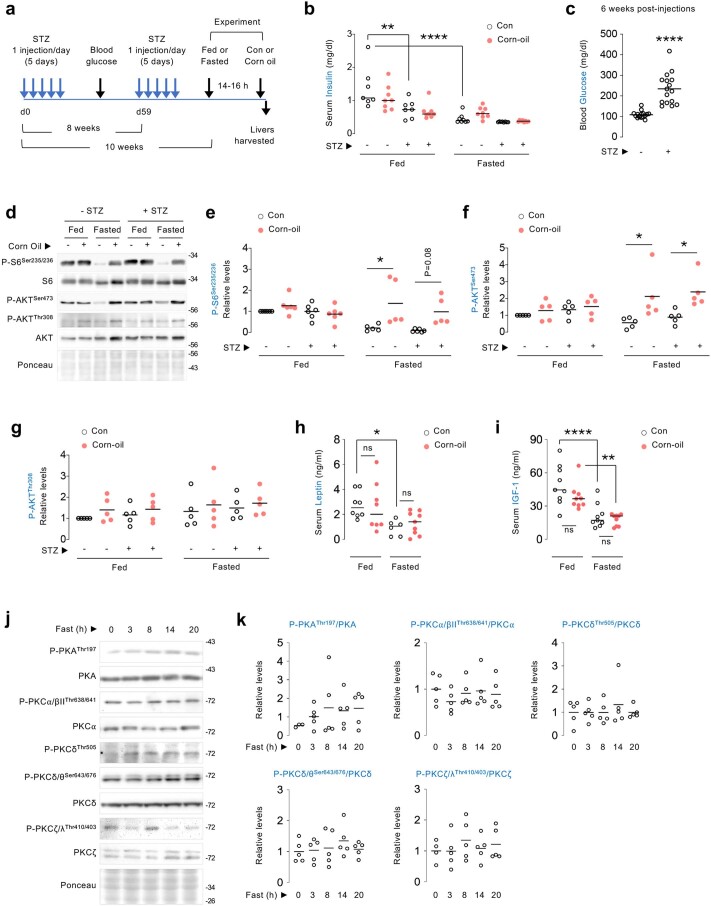
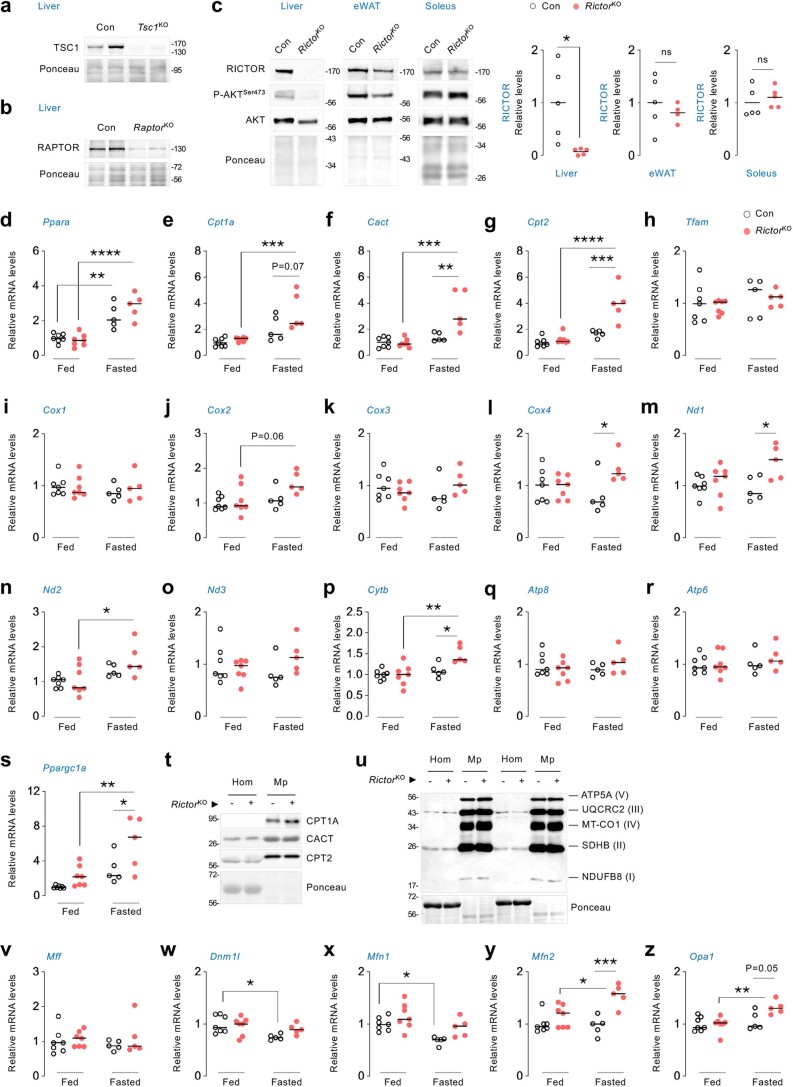
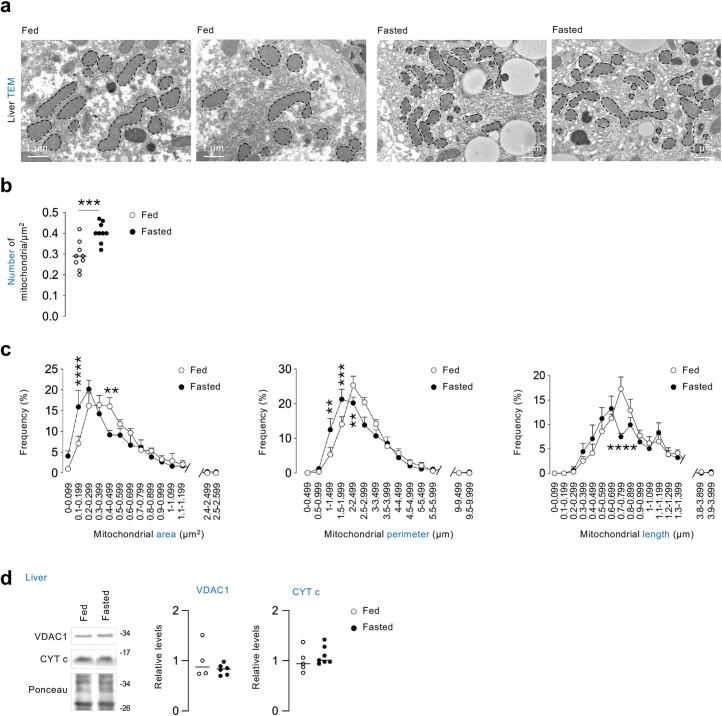
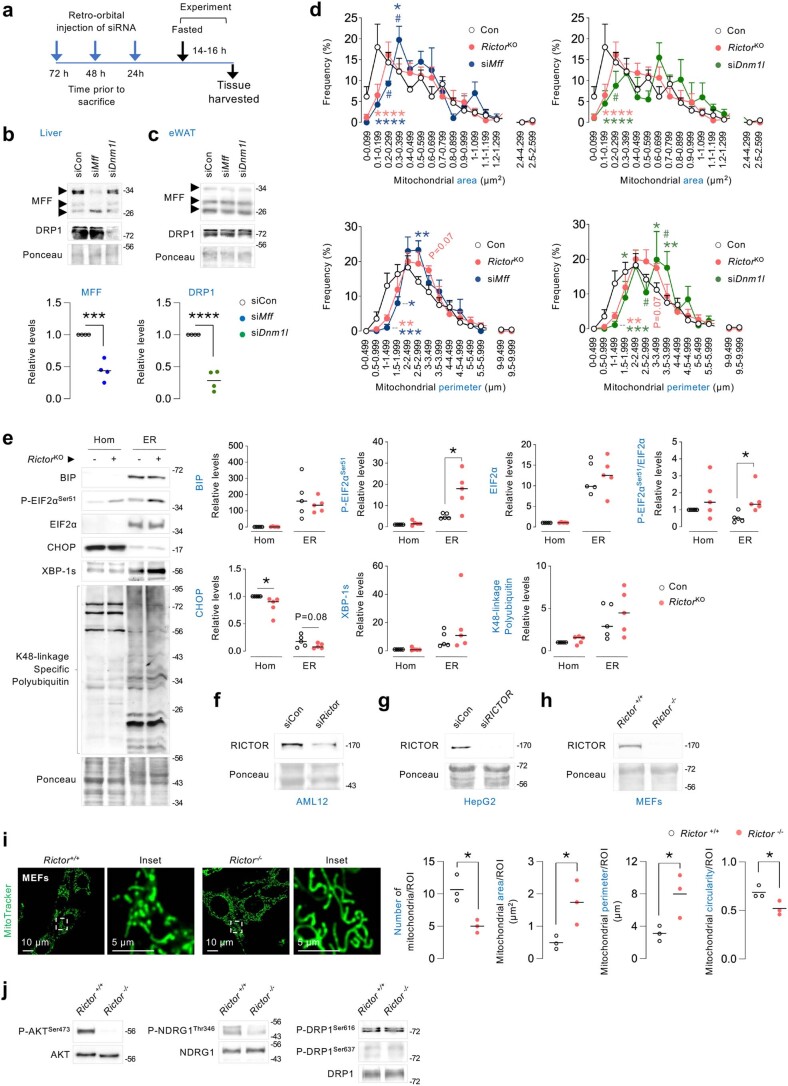
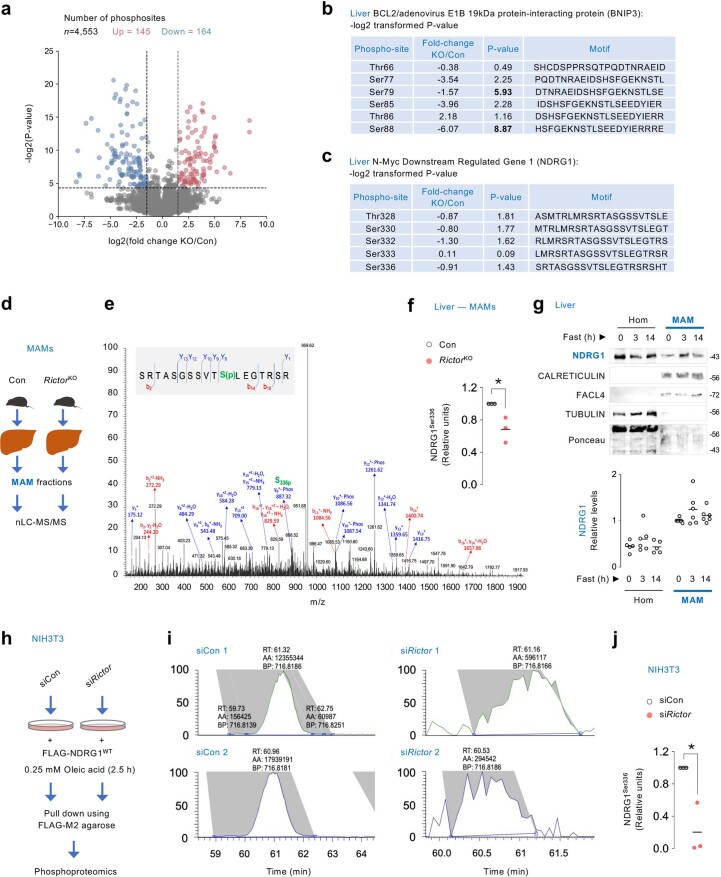
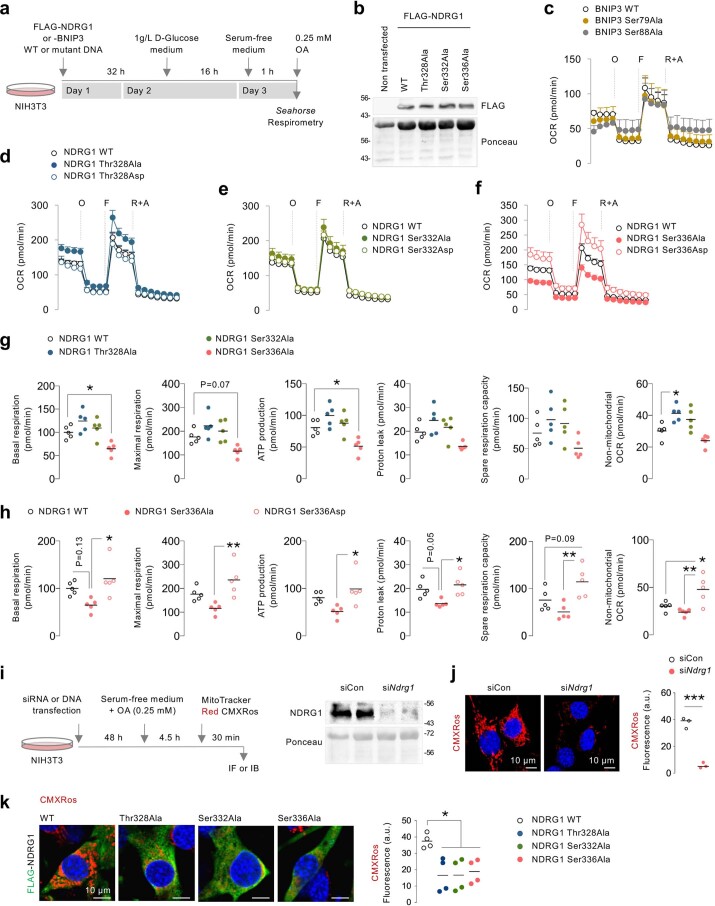
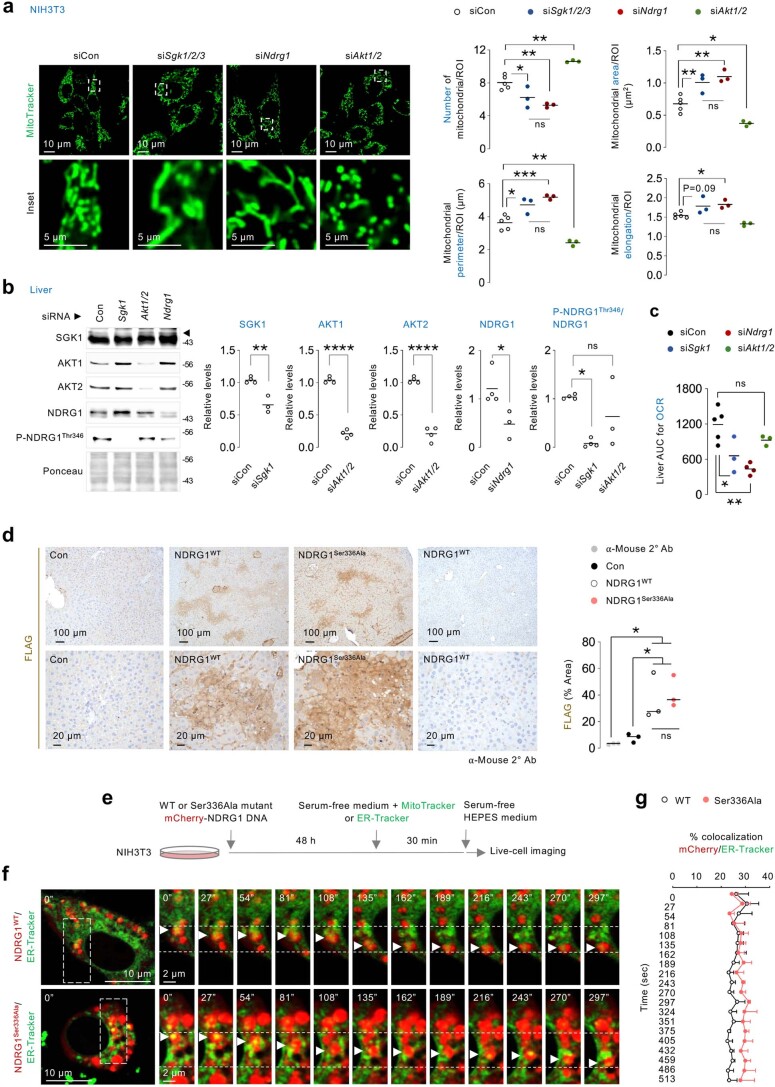
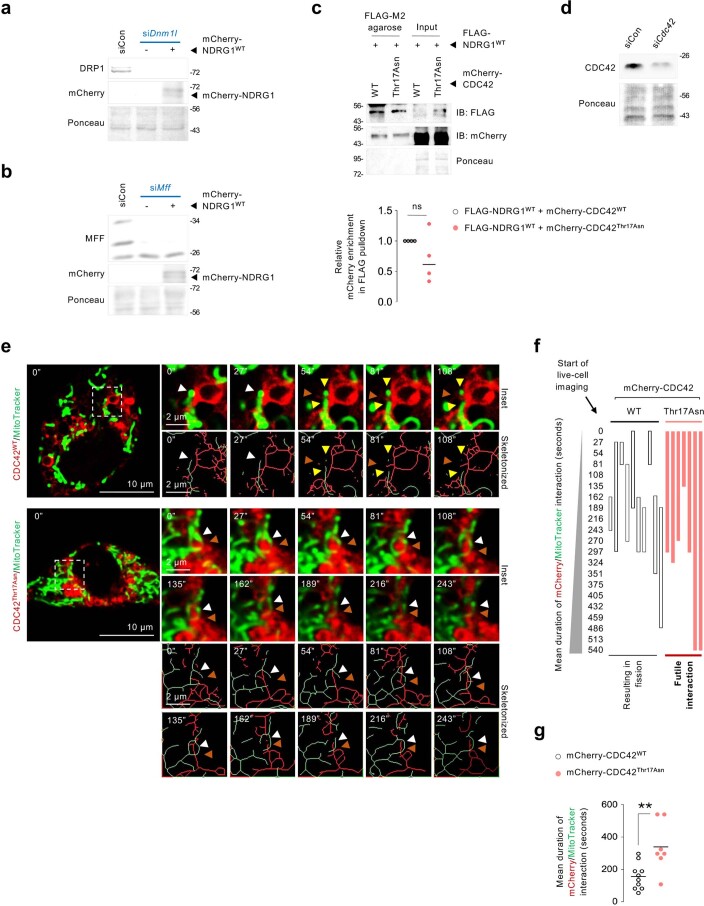
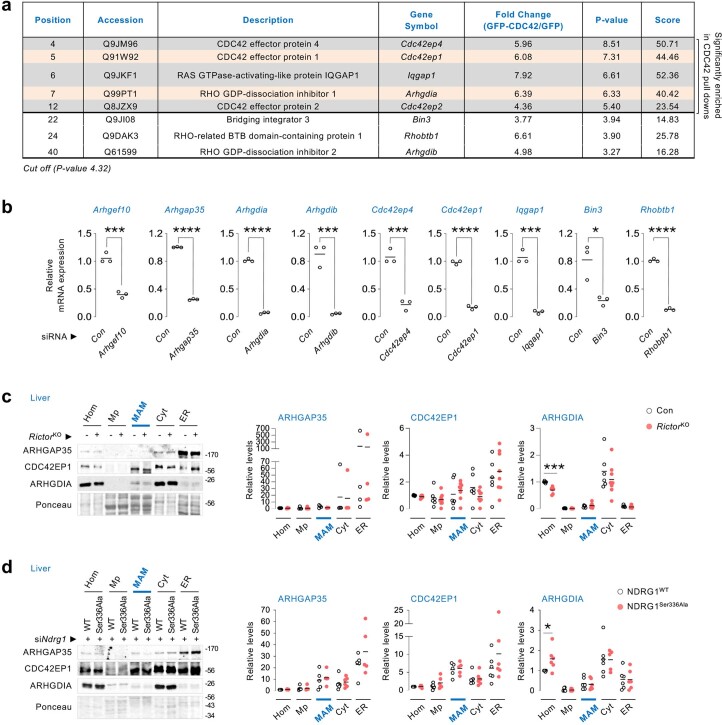
Fasting triggers diverse physiological adaptations including increases in circulating fatty acids and mitochondrial respiration to facilitate organismal survival. The mechanisms driving mitochondrial adaptations and respiratory sufficiency during fasting remain incompletely understood. Here we show that fasting or lipid availability stimulates mTORC2 activity. Activation of mTORC2 and phosphorylation of its downstream target NDRG1 at serine 336 sustains mitochondrial fission and respiratory sufficiency. Time-lapse imaging shows that NDRG1, but not the phosphorylation-deficient NDRG1Ser336Ala mutant, engages with mitochondria to facilitate fission in control cells, as well as in those lacking DRP1. Using proteomics, a small interfering RNA screen, and epistasis experiments, we show that mTORC2-phosphorylated NDRG1 cooperates with small GTPase CDC42 and effectors and regulators of CDC42 to orchestrate fission. Accordingly, RictorKO, NDRG1Ser336Ala mutants and Cdc42-deficient cells each display mitochondrial phenotypes reminiscent of fission failure. During nutrient surplus, mTOR complexes perform anabolic functions; however, paradoxical reactivation of mTORC2 during fasting unexpectedly drives mitochondrial fission and respiration.


Conflict of interest statement

The authors declare no competing interests.

Figures

Fig. 1
Fig. 1. Phosphoproteomics reveal kinases that respond to fasting or lipids.
a, Phosphoproteomics in livers as per plan in cartoon. b, Heat map and hierarchical clustering of phosphosites across groups indicated in a. c, Phosphoproteome-wide comparisons via z score normalization of phosphosites in green cluster. Grey dots represent individual phosphosites. Blue diamonds represent group means. ***P < 0.001, non-parametric ANOVA (Kruskal–Wallis statistic 797.3, P < 0.0001) followed by Dunn’s multiple comparisons test. d, iGPS prediction of upstream individual kinases that respond to lipids across groups indicated and identified in the green cluster in b. eg, Pairwise comparisons between indicated groups (fasted versus basal (e), corn oil versus fasted (f), and BODIPY FL C16 versus fasted (g)), showing upregulated or downregulated kinase networks. For ag, n = 4 mice. For d, darker colour intensity reflects higher kinase score. h, Immunoblots (IB) and quantification for indicated proteins in livers of 2–10-month-old male and female mice that were fed or fasted for indicated durations. N values for number of mice analysed at each timepoint for individual phosphoproteins are indicated in parentheses. P-P70Thr389/P70: 0 h (n = 27), 3 h (n = 21), 8 h (n = 5), 14 h (n = 16) and 20 h (n = 14); P-S6Ser235/236/S6: 0 h (n = 26), 3 h (n = 20), 8 h (n = 5), 14 h (n = 16) and 20 h (n = 14); P-AKTSer473/AKT: 0 h (n = 26), 3 h (n = 21), 8 h (n = 5), 14 h (n = 16) and 20 h (n = 15); P-SGK1Thr256/SGK1: 0 h (n = 11), 3 h (n = 9), 8 h (n = 4), 14 h (n = 9) and 20 h (n = 12); P-NDRG1Thr346/NDRG1: 0 h (n = 17), 3 h (n = 14), 8 h (n = 5), 14 h (n = 12) and 20 h (n = 13); and P-AKTThr308/AKT: 0 h (n = 27), 3 h (n = 20), 8 h (n = 5), 14 h (n = 16) and 20 h (n = 15). Ponceau is loading control. Individual replicates and means are shown. *P < 0.05 and **P < 0.01, one-way ANOVA followed by Tukey’s multiple comparisons test (h). Please refer to Supplementary Table 10 statistical summary, and Supplementary Tables 1 and 2. Source numerical data are available in Source Data Extended Data Table 1, and unprocessed blots are available in the Source Data for this figure. Source data
Fig. 2
Fig. 2. mTORC2 supports mitochondrial respiration and triglyceride disposal during fasting.
a, Generation of liver-specific knockout (KO) of Rictor, Tsc1 or Raptor. b, Representative immunoblots to validate deletion of Rictor gene in livers of 4–6-month-old RictorKO male and female mice. Quantifications and percentage reduction of protein levels for RICTOR and P-AKTSer473/AKT in RictorKO livers are shown (n = 12 mice). c,d, Liver triglyceride (TGs) in 3–7-month-old Con, Tsc1KO and RaptorKO (c) or 4–5-month-old Con and RictorKO (d) male and female mice that were fed or fasted for 14–16 h. N values for number of mice per group are indicated in parentheses. For c, fed Con (n = 27), fasted Con (n = 11) and fed or fasted Tsc1KO or RaptorKO mice (n = 4). For d, fed Con (n = 24), fasted Con (n = 13), fed RictorKO (n = 23) and fasted RictorKO (n = 12). e, Representative Oil Red O stains in livers of 6-month-old Con or RictorKO male mice fasted for 14–16 h (n = 5 mice). f, Serum FFA levels in fed or 14–16 h fasted 3–6-month-old Con or RictorKO male mice. Fed Con (n = 8), fasted Con (n = 9), fed RictorKO (n = 7) and fasted RictorKO (n = 5) mice. g, Area under curve (AUC) for OCRs in Con and RictorKO livers from fed or 14–16 h fasted mice. Fed Con (n = 12), fasted Con (n = 11), fed RictorKO (n = 12) and fasted RictorKO (n = 10) mice. h, Acylcarnitine (AC) content in livers of 4–5-month-old Con or RictorKO male mice (n = 4 mice). i, MitoTracker CMXRos fluorescence in serum-deprived and OA-treated siControl (siCon) or siRictor NIH3T3 cells (siCon 59 cells and siRictor 59 cells from n = 3 independent experiments). j, Representative 3D-TEM images of mitochondria in livers of 4–5-month-old Con or RictorKO male mice (n = 3 mice). Please refer to Supplementary Video 1 (Con) and Supplementary Video 2 (RictorKO). Ponceau is loading control. Individual replicates and means are shown. *P < 0.05, **P < 0.01, ***P < 0.001 and ****P < 0.0001, two-tailed unpaired Student’s t-test (b, h and i); two-way ANOVA followed by Tukey’s multiple comparisons test (c, d and g). Please refer to Supplementary Table 10 statistical summary. Source numerical data are available in Source Data Extended Data Table 1, and unprocessed blots are available in the Source Data for this figure. Source data
Fig. 3
Fig. 3. Loss of mTORC2 blocks fasting-induced mitochondrial fission.
a, Conventional TEM in 14–16 h fasted Con, RictorKO, siMff or siDnm1l livers of 4–9-month-old male mice. N values for number of mice per group are indicated in parentheses. Con or RictorKO mice (n = 6), and siMff or siDnm1l mice (n = 4). Quantification for mitochondrial number is shown. b, TEM in fed or 14–16 h fasted Con and RictorKO livers of 4–9-month-old male mice. Fed Con (n = 7), fasted Con (n = 9) and fed or fasted RictorKO mice (n = 5). Quantification for percentage of mitochondria–ER contacts is shown. Red arrowheads depict contact sites. c, Immunoblots and quantification of indicated proteins in homogenates (Hom), pure mitochondria (Mp), MAMs, cytosol (Cyt) and ER fractions from 14–16 h fasted Con (n = 3) and RictorKO livers (n = 5). Two livers were pooled to generate one sample. d, Live cell imaging and quantification for fission and fusion rates in siCon, siRictor or siDnm1l NIH3T3 cells cultured in serum-free medium for 30 min in presence of MitoTracker green to stain for mitochondria (siCon 12 cells, siRictor 11 cells (fission rate) and n = 12 cells (fusion rate), and siDnm1l 11 cells from n = 8 independent experiments; each cell was tracked on an independent plate). White arrowheads depict mitochondrial constriction sites. Yellow arrowheads depict daughter mitochondria arising from fission at a mitochondrial constriction. Scale bar, 2 µm. Please refer to Supplementary Videos 3 (siCon cells), 4 (siRictor cells) and 5 (siDnm1l cells). e, Representative IB for indicated proteins in siCon, siDnm1l and siRictor NIH3T3 cells. Blots are representative of n = 8 (DRP1) and n = 4 (RICTOR) independent experiments obtaining similar results. f, Representative confocal images of (top) AML12 and (bottom) HepG2 cells knocked down for Rictor, and corresponding controls in serum-free medium for 30 min in presence of MitoTracker green to stain for mitochondria. Magnified insets are shown. Quantifications for mitochondrial number and mitochondrial size/shape descriptors (area, perimeter and circularity) are shown (AML12 45 siCon or siRictor cells; HepG2 35 siCon and 38 siRICTOR cells from n = 3 independent experiments each). Ponceau is loading control. Individual replicates and means are shown. *P < 0.05, **P < 0.01 and ****P < 0.0001, one-way ANOVA followed by Tukey’s multiple comparisons test (a and d); two-way ANOVA followed by Tukey’s multiple comparisons test (b); two-tailed unpaired Student’s t-test (c and f). Please refer to Supplementary Table 10 statistical summary. Source numerical data are available in Source Data Extended Data Table 1, and unprocessed blots are available in the Source Data for this figure. Source data
Fig. 4
Fig. 4. mTORC2 signalling drives mitochondrial fission via NDRG1Ser336 phosphorylation.
a, Experimental plan for be. b, Enrichment map-based network visualization of Gene Ontology enrichment for differentially modulated phosphosites. Blue edges show similarity between decreased phosphosites, and red nodes show similarity between increased phosphosites. Node size indicates the number of proteins per node; major clusters are circled. Associated name represents the major functional association. c, Global ∆Ps analyses of phosphoproteins. Hyperphosphorylated and hypophosphorylated peptides in each comparison are shown. Labels indicate the genes encoding the proteins. Dotted lines: ∆Ps = ±2σ. d,e, Volcano plot for BNIP3 (d) or NDRG1 (e) phosphorylation in RictorKO versus Con livers fasted for 14–16 h. For ae, n = 3 mice. f, Representative MitoTracker green fluorescence in serum-deprived siCon and siNdrg1 NIH3T3 cells (siCon 84 cells and siNdrg1 91 cells from n = 5 independent experiments). Quantifications for mitochondrial number and mitochondrial size/shape descriptors are shown. gi, TEM with mitochondrial quantifications (n = 6 mice) (g), AUC for liver OCR (n = 3 mice) (h) and immunoblots and quantification (i) for indicated proteins in indicated fractions from livers of 3–4-month-old fasted (14–16 h) male mice expressing NDRG1WT or NDRG1Ser336Ala after silencing endogenous Ndrg1 by siRNAs (n = 4 mice). Ponceau is loading control. Individual replicates and means are shown. *P < 0.05, two-tailed unpaired Student’s t-test (cf and i); one-way ANOVA followed by Tukey’s comparisons test (g and h). NS, not significant. Please refer to Supplementary Table 10 statistical summary, and Supplementary Tables 4 and 5. Source numerical data are available in Source Data for Extended Data Table 1, and unprocessed blots are available in the Source Data for this figure. Source data
Fig. 5
Fig. 5. Phosphorylated NDRG1Ser336 requires MFF, but not DRP1, for mitochondrial fission.
a, Live cell imaging of mCherry–NDRG1WT or mCherry–NDRG1Ser336Ala and MitoTracker green in siCon NIH3T3 cells or live cell imaging of mCherry–NDRG1WT and MitoTracker in siRictor or siDnm1l NIH3T3 cells cultured in serum-free medium for 30 min. Orange arrowheads: NDRG1 (mCherry). White arrowheads: mCherry/MitoTracker contact reflecting NDRG1/mitochondria contact before fission. Yellow arrowheads: divided mitochondria after scission by NDRG1 (mCherry). Magnified insets are shown. Please refer to Supplementary Video 6 (mCherry–NDRG1WT/MitoTracker), Supplementary Video 9 (mCherry–NDRG1Ser336Ala/MitoTracker), Supplementary Video 10 (siRictor; mCherry–NDRG1WT/MitoTracker) and Supplementary Video 11 (siDnm1l; mCherryNDRG1WT/MitoTracker). b, Quantification for duration/fate (fission versus no fission) of interaction between NDRG1 (mCherry) and mitochondria (MitoTracker). Quantifications are also shown for duration of NDRG1 (mCherry)-mitochondrial (MitoTracker) interaction events and whether each interaction led to fission (useful) or not (futile) as recorded via live cell imaging. The X axis represents time in seconds—reflecting duration of contact of NDRG1 (mCherry) with mitochondria (MitoTracker). Each individual-coloured bar on the Y axis represents one interaction per individual cell. The length of each coloured bar represents the time from the initiation of interaction of NDRG1 (mCherry) with mitochondria (MitoTracker) till end of interaction. c, Quantification for mean duration of mCherry–NDRG1/mitochondria (MitoTracker) interaction is shown. For b and c (NDRG1WT 11 cells, NDRG1Ser336Ala 15 cells, siRictor/NDRG1WT 10 cells and siDnm1l/NDRG1WT 9 cells from n = 4 independent experiments; each tracked cell was monitored on an independent plate). d,e, Representative images of siDnm1l (n = 4 independent experiments) (d) or siMff (n = 3 independent experiments) (e) NIH3T3 cells expressing mCherry–NDRG1WT or not and cultured in serum-free medium for 30 min in presence of MitoTracker green. Magnified insets are shown. Quantifications for mitochondrial number and mitochondrial size/shape descriptors are shown. Individual replicates and means are shown. *P < 0.05, **P < 0.01, ***P < 0.001 and ****P < 0.0001, one-way ANOVA followed by Tukey’s multiple comparisons test. Please refer to Supplementary Table 10 statistical summary. Source numerical data are available in the Source Data to Extended Data Table 1.
Fig. 6
Fig. 6. Phosphorylated NDRG1Ser336 interacts with CDC42 to drive mitochondrial fission.
a, The log2-transformed fold change (FC) of interaction of Flag–NDRG1WT or Flag–NDRG1Ser336Ala with CDC42, ARHGAP35 and ARHGEF10 (n = 3 independent experiments). b, Pulldowns of Flag (using Flag M2 agarose) and immunoblots and quantification for GFP and Flag levels in OA-treated (2.5 h) NIH3T3 cells co-expressing Flag–NDRG1WT or Flag–NDRG1Ser336Ala and GFP–CDC42WT (n = 3 independent experiments). Flag-tagged empty vector is the negative control. Ponceau is loading control. Quantification for relative enrichment of GFP in Flag pulldowns was calculated by normalizing the densitometric value of GFP to the densitometric value of Flag. c, Representative live-cell imaging of mCherry–NDRG1WT and MitoTracker green in siCon or siCdc42 NIH3T3 cells. Magnified insets are shown. Orange arrowhead: NDRG1 (mCherry) mediating fission. White arrowhead: mCherry/MitoTracker reflecting NDRG1/mitochondrial co-localization before fission. Yellow arrowheads: divided mitochondria after fission. Please refer to Supplementary Video 12 (siCon cells; mCherry–NDRG1WT) and Supplementary Video 13 (siCdc42 cells; mCherry–NDRG1WT). d, Graphical representation for duration of interaction between mCherry–NDRG1 and mitochondria (MitoTracker) in siCon or siCdc42 cells, and whether interactions lead to division or are futile. e, Quantification for mean duration of mCherry–NDRG1WT/mitochondria (MitoTracker) interaction is shown (siCon 6 cells and siCdc42 11 cells from n = 3 independent experiments; each tracked cell was monitored on an independent plate). f, Representative confocal images of NIH3T3 cells transfected with indicated siRNAs and cultured in serum-free medium with MitoTracker green for 30 min. Magnified insets are shown. Quantifications for mitochondria number and mitochondrial size/shape descriptors are shown (siCon 142 cells, siRictor 105 cells, siNdrg1 91 cells, siCdc42 64 cells, siMff 106 cells, siDnm1l 128 cells, siOpa1 86 cells and siMfn1 83 cells from n = 8 (siCon), n = 6 (siRictor and siMff), n = 5 (siNdrg1, siOpa1 and siMfn1), n = 4 (siCdc42) and n = 7 (siDnm1l) independent experiments). Grey areas indicate mitochondria fission-deficient models. g, MitoTracker CMXRos fluorescence in siCon and siCdc42 cells cultured in serum-free medium in presence of OA for 5 h (siCon 102 cells and siCdc42 116 cells from n = 3 independent experiments). Individual replicates and means are shown. *P < 0.05, **P < 0.01, ***P < 0.001 and ****P < 0.0001, two-tailed unpaired Student’s t-test (a, b, e and g); one-way ANOVA and Dunnett’s multiple comparisons test (f). Please refer to Supplementary Table 10 statistical summary, and Supplementary Table 8. Source numerical data are available in Source Data Extended Data Table 1, and unprocessed blots are available in the Source Data for this figure. Source data
Fig. 7
Fig. 7. CDC42 regulators and effectors modulate fission.
a, Experimental plan to pull down GFP-tagged CDC42 to identify interactors that regulate mitochondrial fission. b, Cartoon representing significantly (P < 0.05) enriched interacting partners of CDC42 (in bold) identified via proteomics, some of which belong to the RHO family of GTPases (n = 4 independent experiments). c, Representative images of NIH3T3 cells knocked-down for indicated CDC42-binding partners and cultured in serum-free medium for 30 min in presence of MitoTracker green. Magnified insets are shown. Quantifications for mitochondrial number and mitochondrial size/shape descriptors are shown (siCon, siArhgef10, siIqgap, siArhgdib, siRhobtb1 and siArhgap35 39 cells, siBin3 and siCdc42ep4 40 cells, siCdc42ep1 43 cells and siArhgdia 37 cells from n = 3 independent experiments). Grey areas indicate mitochondria fission-deficient models. d,e, Immunoblots and quantification for indicated proteins in indicated fractions from livers of 14–16 h-fasted 5–6-month-old Con (n = 3) and RictorKO (n = 5) mice (d), and 3–4-month-old mice expressing NDRG1WT or NDRG1Ser336Ala plasmids after silencing endogenous Ndrg1 with siRNAs (e). N values for number of mice per fraction are indicated in parentheses. CDC42: all fractions from NDRG1WT and NDRG1Ser336Ala mice are n = 5 except for NDRG1Ser336Ala MAMs where n = 4; RHOA: n = 6 mice for all groups. Ponceau is loading control. f, Representative confocal images of siCon or siCdc42 NIH3T3 cells expressing mCherry–Lifeact-7 and cultured in serum-free medium for 30 min in presence of MitoTracker green. Magnified insets are shown. Quantification for percentage co-localization of mCherry–Lifeact-7 with mitochondria is shown (siCon 33 cells and siCdc42 30 cells from n = 5 (siCon) or n = 4 (siCdc42) independent experiments). g, Reactivation of mTORC2 during fasting phosphorylates NDRG1 at Ser336, which engages with mitochondria and recruits CDC42 to mitochondria–ER contact sites wherein CDC42 and its effector proteins orchestrate fission. Individual replicates and means are shown. *P < 0.05 and **P < 0.01, two-tailed unpaired Student’s t-test. NS, not significant. Please refer to Supplementary Table 10 statistical summary, and Supplementary Table 9. Source numerical data are available in Source Data Extended Data Table 1, and unprocessed blots are available in the Source Data for this figure. Source data
Extended Data Fig. 1
Extended Data Fig. 1. Kinases responsive to fasting or fatty acids.
(a) Direct BODIPY fluorescence in liver slices of 8 mo-old C57BL/6 male mice subjected to 30 min gavage with vehicle or 10 mg/kg of BODIPY FL C16 after 14–16 h fasting (n = 5 mice). (b) Dendrogram of hierarchical clustering analysis (Euclidean distance) between experimental groups based on phosphorylation status of 863 phosphosites. (c) Prediction for kinases that putatively target the phosphosites identified within the green cluster in main Fig. 1b. Darker color intensity reflects higher kinase score. (d) Pairwise comparisons showing upregulated (red) or downregulated (blue) kinase networks in mice refed high fat diet (HFD) for 30 min after 14–16 h fasting. For b-d (n = 4 mice). (e) Representative IB, and (f) quantification for the indicated proteins in livers of 2–8 mo-old C57BL/6 male or female mice kept fasted for 14–16 h or treated with corn oil or BODIPY FL C16 or refed a HFD for 30 min after fasting. N values for number of mice analyzed for individual proteins and conditions are indicated in parentheses. RAPTOR and P-AMPKThr172/AMPK: n = 4 per group; RICTOR: fasted (n = 8), corn oil (n = 8), BODIPY FL C16 (n = 4), refed (n = 4); P-P70Thr389/P70: fasted (n = 23), corn oil (n = 22), BODIPY FL C16 (n = 8), refed (n = 4); P-S6Ser235/236/S6 fasted (n = 23), corn oil (n = 24), BODIPY FL C16 (n = 9), refed (n = 4); P-AKTSer473/AKT: fasted (n = 17), corn oil (n = 13), BODIPY FL C16 (n = 9), refed (n = 4); P-AKTThr308/AKT: fasted (n = 4), corn oil (n = 3), BODIPY FL C16 (n = 4), refed (n = 4). Ponceau is the loading control. (g) Circulating free fatty acids (FFA) in 2–7 mo-old male mice fasted for: 0 h (n = 20 mice), 3 h (n = 9 mice), 14 h (n = 3 mice) or 20 h (n = 15 mice). Individual replicates and mean values are shown. *P < 0.05, ***P < 0.001 and ****P < 0.0001, One-way ANOVA followed by Šídák’s multiple comparisons test (f); One-way ANOVA followed by Tukey’s multiple comparisons test (g). Please refer to Supplementary Table 10_statistical summary, and Supplementary Tables 1, 2. Source numerical data are available in SourceData_Table 1, and unprocessed blots are available in Source Data Extended Data Fig. 1. Source data
Extended Data Fig. 2
Extended Data Fig. 2. Protein kinases A and Cs are not activated by fasting in liver, and lipid-driven mTORC1/C2 activation is leptin, IGF-1 or insulin-independent.
(a) Experimental plan for generation of insulin-deficient diabetic mice using streptozotocin (STZ). (b) Serum insulin levels in 3 mo-old STZ-treated C57BL/6 male mice that were fed or fasted for 14–16 h and then gavaged with corn oil for 30 min. N values for number of mice in each group are in parenthesis. Fed (n = 7); fed + STZ (n = 7); fed + corn oil (n = 8); fed + STZ + corn oil (n = 8); fasted (n = 8); fasted + STZ (n = 8); fasted + corn oil (n = 8); fasted + STZ + corn oil (n = 8). (c) Blood glucose levels 6 weeks after the first injection with STZ (n = 16 mice). (d) Representative IB, and (e-g) quantification for indicated proteins normalized to corresponding total protein in livers of 3 mo-old STZ-treated C57BL/6 male mice that were fed or fasted for 14–16 h and then gavaged with corn oil for 30 min. For e, fed (n = 6); fed + STZ (n = 6); fed + corn oil (n = 6); fed + STZ + corn oil (n = 6); fasted (n = 5); fasted + STZ (n = 6); fasted + corn oil (n = 5); fasted + STZ + corn oil (n = 5). For f and g, all indicated groups consist of n = 5 mice each. (h, i) Serum (h) leptin and (i) IGF-1 levels in 3 mo-old C57BL/6 male mice that were fed or fasted for 14–16 h and then gavaged with corn oil for 30 min. For h, fed (n = 8); fed + corn oil (n = 8); fasted (n = 6); fasted + corn oil (n = 9). For i, all indicated groups consist of n = 9 mice each. (j) IB and (k) quantification for the indicated proteins in livers of 2–10 mo-old mice fed or fasted for the indicated durations. N values for number of mice analyzed at each time-point for individual phosphoproteins are indicated in parentheses. P-PKAThr197/PKA: 0 h (n = 3), 3 h-20 h (n = 5); P-PKCα/βIIThr638/641/PKCα (all time-points are n = 5); P-PKCδThr505/PKCδ (all time-points are n = 5); P-PKCδ/θSer643/676/PKCδ (all time-points are n = 5); and P-PKCζ/λThr410/403/PKCζ: 0 h (n = 4), 3 h-20 h (n = 5). Ponceau is the loading control. Individual replicates and mean values are shown. *P < 0.05, **P < 0.01 and ****P < 0.0001, 2-way ANOVA followed by Tukey’s multiple comparisons test (b, e, f, h and i); two-tailed unpaired Student’s t-test (c). ns=not significant. Please refer to Supplementary Table 10_statistical summary. Source numerical data are available in SourceData_Table 1, and unprocessed blots are available in Source Data Extended Data Fig. 2. Source data
Extended Data Fig. 3
Extended Data Fig. 3. Effect of loss of mTORC2 on expression of genes and proteins related to mitochondrial oxidative metabolism and dynamics.
(a, b) Representative IB to validate deletion of the indicated genes in livers of 4–6 mo-old Con, Tsc1KO or RaptorKO male and female mice. Blots for TSC1 and RAPTOR are representative of n = 7 Con or corresponding KO mice obtaining similar results. (c) IB for mTORC2 signaling and quantification of RICTOR protein levels in liver (n = 5 mice), epididymal white adipose tissue (eWAT) (n = 5 Con and n = 4 RictorKO mice) and soleus (n = 5 mice) of 4–6 mo-old Con and RictorKO male mice fasted for 14–16 h. (d-s and v-z) Relative mRNA expression of indicated genes in livers of 4–6 mo-old Con and RictorKO male mice that were fed or fasted for 14–16 h (n = 7 fed Con or RictorKO mice, and n = 5 fasted Con or RictorKO mice). (t) Representative IB for proteins involved in mitochondrial fatty acid uptake, and (u) OXPHOS in whole homogenates (Hom) and pure mitochondrial (Mp) fractions from livers of 5–6 mo-old Con and RictorKO male mice after 14–16 h fasting (n = 3 Con and n = 5 RictorKO mice). Ponceau is the loading control. Individual replicates and mean values are shown. *P < 0.05, **P < 0.01, ***P < 0.001 and ****P < 0.0001, two-tailed unpaired Student’s t-test (c); 2-way ANOVA followed by Tukey’s multiple comparisons (d-s and v-z). ns=not significant. Please refer to Supplementary Table 10_statistical summary. Source numerical data are available in SourceData_Table 1, and unprocessed blots are available in Source Data Extended Data Fig. 3. Source data
Extended Data Fig. 4
Extended Data Fig. 4. Fasting stimulates mitochondrial fission in livers.
(a-c) (a) Liver TEM of fed or 14–16 h fasted 4–7-mo-old male mice. Quantification for mitochondrial number is shown in b. Frequency histograms depicting distribution of mitochondrial area, perimeter and length are shown in c. Mean ± SEM is shown. For a-c (n = 9 mice). (d) Representative IB and quantification for indicated mitochondrial markers in livers of fed or 14–16 h fasted mice. N values for number of mice analyzed for individual proteins and conditions are indicated in parentheses. VDAC1: fed (n = 4) and fasted (n = 6); CYT c: fed (n = 5) and fasted (n = 7). Ponceau is the loading control. Individual replicates and mean values are shown in b and d. **P < 0.01, ***P < 0.001 and ****P < 0.0001, two-tailed unpaired Student’s t-test (b); 2-way ANOVA followed by Tukey’s multiple comparisons test (c). Please refer to Supplementary Table 10_statistical summary. Source numerical data are available in SourceData_Table 1, and unprocessed blots are available in Source Data Extended Data Fig. 4. Source data
Extended Data Fig. 5
Extended Data Fig. 5. Fasting-induced mitochondrial fission is mTORC2-dependent.
(a) Experimental plan and (b-c) representative IB for indicated proteins in (b) livers and (c) eWAT of 4–9 mo-old male mice injected with siCon, siMff or siDnm1l and fasted for 14–16 h (n = 4 mice). Quantifications for loss of MFF and DRP1 protein levels in liver are shown. (d) Frequency histograms depicting distribution of mitochondrial area and perimeter in Con, RictorKO and siMff or siDnm1l livers. N values for number of mice are in parenthesis: Con (n = 6), RictorKO (n = 6), siMff (n = 4), and siDnm1l (n = 4). Mean ± SEM is shown. (e) IB and quantification for indicated ER-stress and proteostasis markers in Hom and ER fractions from livers of 6 mo-old Con and RictorKO mice fasted for 14–16 h (n = 5 mice). (f-h) Representative IB for RICTOR in siCon or siRictor (f) AML12 or (g) HepG2 cells, or in (h) Rictor +/+ and Rictor -/- MEFs. RICTOR blots are representative of independent experiments obtaining similar results in AML12 (n = 4), HepG2 (n = 3), and MEF (n = 7) cells. (i) Representative confocal images of Rictor +/+ and Rictor -/- MEFs cultured in serum-free medium for 30 min in presence of MitoTracker green. Magnified insets are shown. Quantification for mitochondrial number and mitochondria size/shape descriptors is shown (Rictor+/+ 36 cells and Rictor-/- 43 cells from n = 3 independent experiments). (j) Representative IB for indicated proteins in Rictor+/+ and Rictor-/- MEFs (n = 3 independent experiments). Ponceau is loading control. Individual replicates and mean values are shown. *P < 0.05, **P < 0.01, ***P < 0.001 and ****P < 0.0001 are versus Con; #P < 0.05 versus RictorKO, two-tailed unpaired student’s t-test (b, e and i); One-way ANOVA followed by Tukey’s multiple comparisons test (d). Please refer to Supplementary Table 10_statistical summary. Source numerical data are available in SourceData_Table 1, and unprocessed blots are available in Source Data Extended data Fig. 5. Source data
Extended Data Fig. 6
Extended Data Fig. 6. Phosphoproteomics reveal mTORC2 phosphorylation of NDRG1 at Ser336 in MAMs.
(a) Volcano plot for phosphoproteomics in 14–16 h fasted Con and RictorKO livers. The numbers indicate total phosphosites. Red and blue dots represent significantly increased (P < 0.05 and log2(fold change)>1.5) and decreased (P < 0.05 and log2(fold change)<1.5) phosphosites, respectively. (b, c) Tables showing fold-change and log2 transformed P-values for indicated phosphorylations on liver (b) BNIP3, and (c) NDRG1 from 3–4-mo-old liver-specific RictorKO mice fasted for 14–16 h. For a-c (n = 3 mice). (d) MAMs of 4–6 mo-old Con and RictorKO livers from 14–16 h fasted mice were subjected to phosphoproteomics. (e) Annotated MS/MS spectrum of phosphopeptide SRTASGSSVTS(p)LEGTRSR in NDRG1, wherein S(p) represents phosphorylated Ser336. (f) Quantification for SRTASGSSVTS(p)LEGTRSR peptide in NDRG1 in MAMs is shown, with relative abundance of SRTASGSSVTS(p)LEGTRSR in Con or RictorKO MAMs. For d-f (n = 3 samples wherein 2 livers were pooled to generate 1 sample). (g) Representative IB and quantifications for indicated proteins in Hom and MAM fractions from livers of 2–10 mo-old male mice fed or fasted for indicated time points. N values for number of mice at each time point are in parenthesis: Hom 0 h and 14 h (n = 5); Hom 3 h (n = 6); and all time points for MAMs (n = 6). Ponceau is the loading control. (h) Experimental plan to pulldown FLAG-NDRG1WT in siCon or siRictor NIH3T3 cells co-transfected with FLAG-NDRG1WT plasmid for assessment of phosphorylation of FLAG-NDRG1WT via phosphoproteomics. FLAG-NDRG1WT pulled-down from total lysates of serum-deprived siCon or siRictor NIH3T3 cells in presence of OA for 2.5 h. (i) Representative extracted ion chromatograms of SRTASGSSVTS(p)LEGTRSR in FLAG-NDRG1 in siCon and siRictor NIH3T3 cells, and (j) quantification for relative abundance of SRTASGSSVTS(p)LEGTRSR peptide from pulled-down FLAG-NDRG1 from siCon and siRictor cells expressing FLAG-NDRG1WT. For h-j (n = 3 independent experiments). Individual replicates and means are shown. *P < 0.05, two-tailed unpaired Student’s t-test (a-c, f and j). p=phosphorylation. Please refer to Supplementary Table 10_statistical summary. Please refer to Supplementary Table 4(a-c), Supplementary Table 6(e and f), and Supplementary Table 7(i and j). Source numerical data are available in SourceData_Table 1, and unprocessed blots are available in Source Data Extended Data Fig. 6. Source data
Extended Data Fig. 7
Extended Data Fig. 7. Phosphorylation of NDRG1 at Ser336 supports mitochondrial respiration and membrane potential.
(a) Experimental plan for Seahorse mitochondrial stress tests shown through c-h. (b) Representative IB for FLAG in NIH3T3 cells expressing the indicated FLAG-tagged NDRG1 wild type (WT) or FLAG-tagged Ser/Thr>Ala mutant of NDRG1 (n = 3 independent experiments). (c) Seahorse mitochondrial stress test in serum-deprived NIH3T3 cells expressing FLAG-tagged BNIP3 WT or FLAG-tagged Ser79Ala or Ser88Ala mutant BNIP3 in presence of 0.25 mM OA, followed by sequential addition of oligomycin (O), FCCP (F), and rotenone + antimycin (R + A) to assess mitochondrial respiratory function (n = 5 independent experiments). (d-f) Seahorse mitochondrial stress tests in NIH3T3 cells expressing the indicated FLAG-tagged NDRG1 WT or Ser/Thr>Ala or Ser/Thr>Asp mutant of NDRG1. Quantifications for mitochondrial respiratory function in cells expressing (g) FLAG-tagged NDRG1 WT or Ser/Thr>Ala mutants of NDRG1, or (h) FLAG-tagged NDRG1 WT or Ser336Ala and Ser336Asp mutants of NDRG1 are shown. For d-h (n = 5 independent experiments). (i) Cartoon depicting experimental plan for confocal microscopy performed in j and k. Representative blots for NDRG1 in siCon and siNdrg1 NIH3T3 cells are shown in i, right (n = 5 independent experiments). (j) MitoTracker CMXRos red fluorescence in siCon or siNdrg1 cells (siCon 58 cells and siNdrg1  62 cells from n = 3 independent experiments). (k) MitoTracker CMXRos red fluorescence in FLAG (green fluorescence)-tagged WT or phosphorylation-deficient mutants of NDRG1 (NDRG1WT  37 cells, NDRG1Thr328Ala  34 cells, NDRG1Ser332Ala  32 cells, and NDRG1Ser336Ala  33 cells from n = 4 independent experiments). Ponceau is loading control. For c-f, values are mean ± SEM. For g, h, j and k, individual replicates and means are shown. *P < 0.05, **P < 0.01 and ***P < 0.001, One-way ANOVA followed by Tukey’s multiple comparisons test (g, h and k); two-tailed unpaired Student’s t-test (j). Please refer to Supplementary Table 10_statistical summary. Source numerical data are available in SourceData_Table 1, and unprocessed blots are available in Source Data Extended Data Fig. 7. Source data
Extended Data Fig. 8
Extended Data Fig. 8. Silencing NDRG1 and SGK1, but not AKT1/2, recapitulates mitochondrial fission failure observed in Rictor silenced cells.
(a) Representative confocal images of NIH3T3 cells silenced for Sgk1/2/3, Ndrg1 or Akt1/2 and cultured in serum-free medium for 30 min in presence of MitoTracker green. Magnified insets are shown. Quantifications for mitochondrial number and mitochondrial size/shape descriptors are shown (siCon 71 cells, siSgk1/2/3  36 cells, siNdrg1  62 cells, and siAkt1/2  36 cells from n = 5 (siCon) and n = 3 (siSgk1/2/3, siNdrg1, and siAkt1/2) independent experiments). (b) IB and quantifications for indicated proteins in livers of 3–4 mo-old male mice injected with siRNAs against Sgk1, Akt1/2 or Ndrg1 and subjected to 14–16 h fasting. N values for number of mice analyzed for indicated proteins are in parentheses. SGK1: siCon (n = 4) and siSgk1 (n = 3); AKT1 and 2: siCon (n = 4) and siAkt1/2 (n = 4); NDRG1: siCon (n = 4) and siNdrg1 (n = 3); P-NDRG1Thr346/NDRG1: siCon (n = 4), siSgk1 (n = 4) and siAkt1/2 (n = 3). (c) AUC for OCR in livers of 14–16 h fasted Con (n = 5), siSgk1 (n = 3), siNdrg1 (n = 4), and siAkt1/2 (n = 3) mice. (d) Immunohistochemistry and quantification for equivalent FLAG expression in livers silenced for endogenous Ndrg1 and then injected with FLAG-tagged WT or Ser336Ala NDRG1 plasmid (n = 3 mice). 2° Ab-only control is shown. (e) Cartoon depicting experimental plan performed in Fig. 5a and Extended Data Fig. 8f. (f) Representative live-cell imaging of mCherry-NDRG1WT or mCherry-NDRG1Ser336Ala and ER-Tracker green in NIH3T3 cells cultured in serum-free medium for 30 min. Magnified insets are shown. White arrowheads: NDRG1 (mCherry)/ER (ER-Tracker) contacts. (h) Quantification for % colocalization of mCherry with ER-tracker in g. Values are mean ± SEM (n = 3 independent experiments). Please refer to Supplementary Video 7 (mCherry-NDRG1WT/ER-Tracker), and Supplementary Video 8 (mCherry-NDRG1Ser336Ala/ER-Tracker). Ponceau is loading control. Individual replicates and means are shown. *P < 0.05, **P < 0.01, ***P < 0.001 and ****P < 0.0001, One-way ANOVA followed by Tukey’s multiple comparisons test (a, c and d); two-tailed unpaired Student’s t-test (b); 2-way ANOVA followed by Tukey’s multiple comparisons test (g). ns=not significant. Please refer to Supplementary Table 10_statistical summary. Source numerical data are available in SourceData_Table 1, and unprocessed blots are available in Source Data Extended Data Fig. 8. Source data
Extended Data Fig. 9
Extended Data Fig. 9. Validating silencing of Dnml1, Mff and Cdc42 in NIH3T3 cells, and time-lapse imaging showing loss of fission in cells expressing the mcherry-CDC42Thr17Asn GTP-binding mutant.
(a, b) Representative IB for indicated proteins in NIH3T3 cells silenced for (a) Dnml1 or (b) Mff and expressing mCherry-tagged NDRG1WT. Blots are representative of n = 3 independent experiments obtaining similar results. (c) IB for FLAG and mCherry in OA-treated (2.5 h) NIH3T3 cells co-expressing FLAG-NDRG1WT and mCherry-CDC42WT or mCherry-CDC42Thr17Asn mutant and subjected to pulldown of FLAG using FLAG M2 agarose (n = 4 independent experiments). Quantification for relative enrichment of mCherry in FLAG pulldowns was calculated by normalizing the densitometry value of mCherry to the densitometry value of FLAG. (d) Representative IB for indicated proteins in NIH3T3 cells silenced for Cdc42 and expressing mCherry-tagged NDRG1WT. CDC42 blot is representative of n = 3 independent experiments obtaining similar results. (e) Representative live-cell imaging in cells expressing mcherry-CDC42WT or dominant negative mcherry-CDC42Thr17Asn mutant in presence of MitoTracker green to label mitochondria. Red arrowheads: CDC42 (mCherry). White arrowheads: CDC42 (mCherry)/mitochondria (MitoTracker) contacts prior to fission. Yellow arrowheads: divided mitochondria after contact with CDC42 (mCherry). Magnified insets are shown. Please refer to Supplementary Video 14 (mCherry-CDC42WT/MitoTracker), and Supplementary Video 15 (mCherry-CDC42Thr17Asn/MitoTracker). (f) Graphical representation for duration of interaction between mCherry-CDC42WT or mCherry-CDC42Thr17Asn and mitochondria (MitoTracker), and whether interactions lead to division or are futile. (g) Quantification for mean duration of interaction (mCherry-CDC42WT  10 cells, and mCherry-CDC42Thr17Asn  7 cells from n = 3 independent experiments. Each tracked cell was monitored on an independent plate). Ponceau is loading control. Individual replicates and means are shown. **P < 0.01, two-tailed unpaired Student’s t-test (c and g). ns=not significant. Please refer to Supplementary Table 10_statistical summary. Source numerical data are available in SourceData_Table 1, and unprocessed blots are available in Source Data Extended Data Fig. 9. Source data
Extended Data Fig. 10
Extended Data Fig. 10. An siRNA screen to target interacting partners of CDC42 reveals effectors and regulators of CDC42 controlling mitochondrial dynamics.
(a) Significantly enriched interacting partners of CDC42 that belong to the RHO family of GTPases. A log2 transformed P-value cut-off of 4.32 was used as threshold (n = 4 independent experiments). (b) qPCR in NIH3T3 cells to validate the silencing of selected CDC42-binding partners identified by proteomics (n = 3 independent experiments). (c, d) IB and quantification for indicated proteins in Hom, Mp, MAMs, Cyt, and ER fractions from livers of (c) 5–6 mo-old Con or RictorKO male mice, and (d) 3–4 mo-old NDRG1WT or NDRG1Ser336Ala male mice co-injected with siRNA against endogenous Ndrg1 and fasted for 14–16 h. N values for number of mice analyzed for individual proteins in indicated fractions are in parentheses. For c, ARHGAP35: all fractions from Con (n = 4) and RictorKO (n = 4) mice; CDC42EP1: all fractions, Con (n = 6) and RictorKO (n = 8) mice except RictorKO Hom where n = 7 mice; ARHGDIA: all fractions from Con (n = 6) mice except Mp, MAMs and ER where n = 5 mice, and all fraction from RictorKO (n = 8) mice except Hom and ER where n = 7 mice. For d, ARHGAP35: all fractions from NDRG1WT and NDRG1Ser336Ala mice are n = 6 except Mp, MAMs and ER from NDRG1WT mice where n = 5; CDC42EP1: all fractions from NDRG1WT and NDRG1Ser336Ala mice are n = 6 except MAMs in both groups where n = 5; ARHGDIA: all fractions from NDRG1WT and NDRG1Ser336Ala mice are n = 6 except Cyt in NDRG1Ser336Ala mice where n = 5. Ponceau is loading control. Individual replicates and means are shown. *P < 0.05, ***P < 0.001 and ****P < 0.0001, two-tailed unpaired Student’s t-test (a-d). GAP: GTPase activating protein; GDI: GDP dissociation inhibitors. Please refer to Supplementary Table 10_statistical summary, and Supplementary Table 9. Source numerical data are available in SourceData_Table 1, and unprocessed blots are available in Source Data Extended Data Fig. 10. Source data

References

    1. Sharma A, Smith HJ, Yao P, Mair WB. Causal roles of mitochondrial dynamics in longevity and healthy aging. EMBO Rep. 2019;20:e48395. doi: 10.15252/embr.201948395. - DOI - PMC - PubMed
    1. Barazzuol L, Giamogante F, Cali T. Mitochondria associated membranes (MAMs): architecture and physiopathological role. Cell Calcium. 2021;94:102343. doi: 10.1016/j.ceca.2020.102343. - DOI - PubMed
    1. Loson OC, Song Z, Chen H, Chan DC. Fis1, Mff, MiD49, and MiD51 mediate Drp1 recruitment in mitochondrial fission. Mol. Biol. Cell. 2013;24:659–667. doi: 10.1091/mbc.e12-10-0721. - DOI - PMC - PubMed
    1. Otera H, et al. Mff is an essential factor for mitochondrial recruitment of Drp1 during mitochondrial fission in mammalian cells. J. Cell Biol. 2010;191:1141–1158. doi: 10.1083/jcb.201007152. - DOI - PMC - PubMed
    1. Ge, Y. et al. Two forms of Opa1 cooperate to complete fusion of the mitochondrial inner-membrane. eLife10.7554/eLife.50973 (2020). - PMC - PubMed

Publication types

MeSH terms

Substances