

doi: 10.1038/s41592-023-01909-9.
Epub 2023 Jun 29.
MultiVI: deep generative model for the integration of multimodal data
Affiliations
- PMID: 37386189
- PMCID: PMC10406609
- DOI: 10.1038/s41592-023-01909-9
Item in Clipboard
MultiVI: deep generative model for the integration of multimodal data
Nat Methods.
2023 Aug.
Abstract
Jointly profiling the transcriptome, chromatin accessibility and other molecular properties of single cells offers a powerful way to study cellular diversity. Here we present MultiVI, a probabilistic model to analyze such multiomic data and leverage it to enhance single-modality datasets. MultiVI creates a joint representation that allows an analysis of all modalities included in the multiomic input data, even for cells for which one or more modalities are missing. It is available at scvi-tools.org .
© 2023. The Author(s).
Conflict of interest statement
N.Y. is an adviser and/or has equity in Cellarity, Celsius Therapeutics and Rheos Medicines. T.A is an employee of Vevo Therapeutics. All other authors declare no competing interests.
Figures
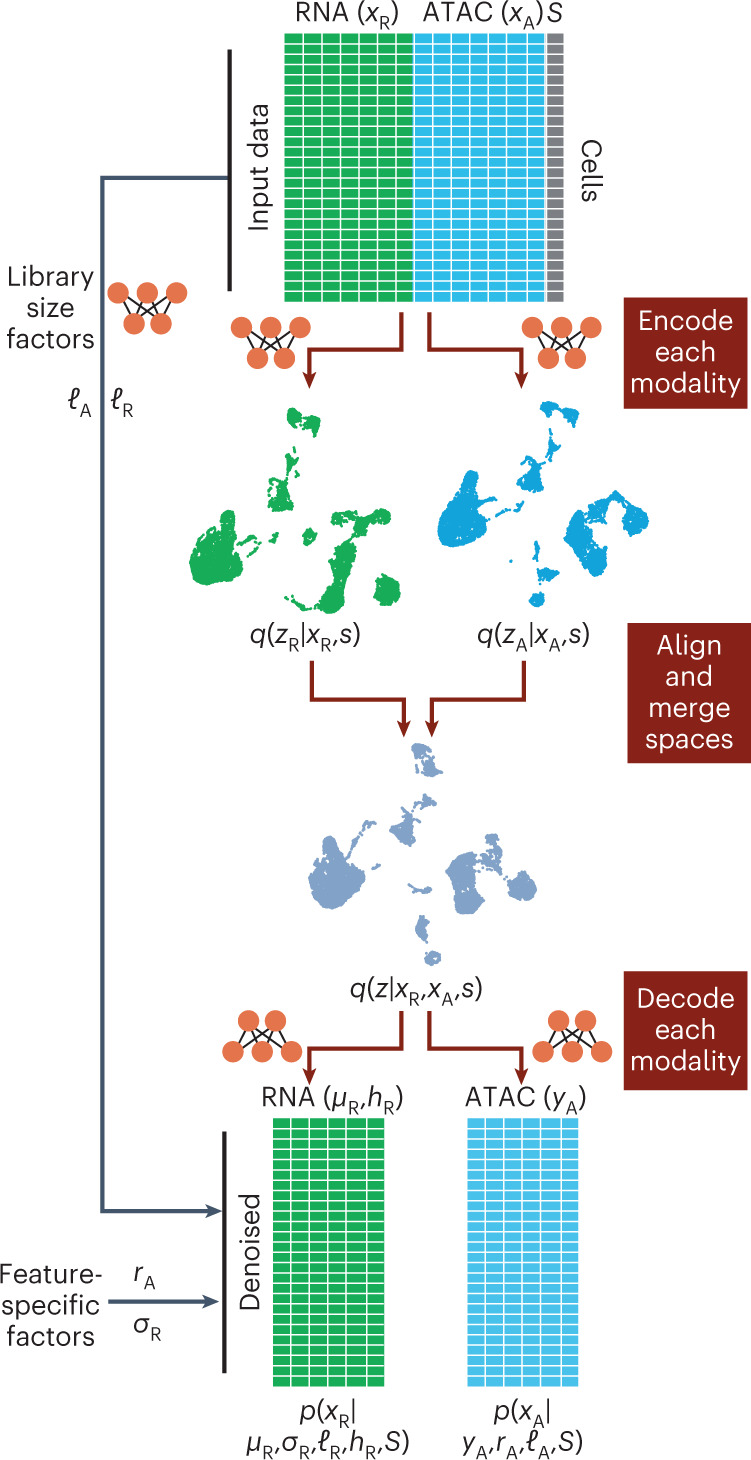
Variable S represents experimental covariates, such as batch or experimental condition. Each data modality is encoded into modality-independent latent representations (using neural network encoders) and then, these representations are merged into a joint latent space. The joint latent representation is used to estimate (decode) the input data together with chromatin region-specific effects (rA), gene-specific dispersion (σR), cell-specific effects (ℓA, ℓR), accessibility probability estimates (YZ) and mean gene expression values (μR).
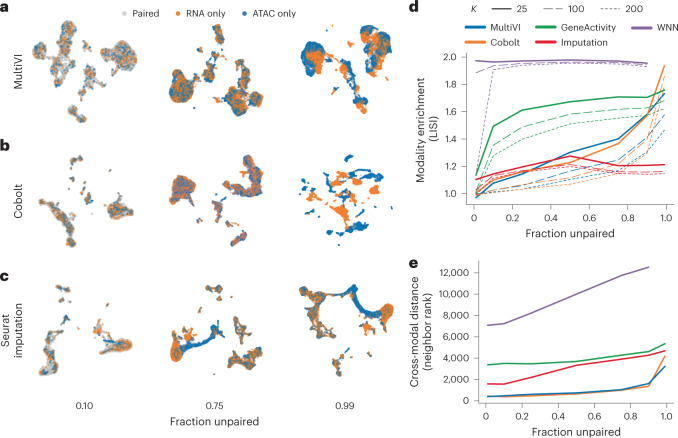
a–c, UMAP representations of the latent spaces learned by MultiVI (a), Cobolt (b) and Seurat using the RNA-imputation based integration (c), for various rates of unpaired data, colored by cell modality. d, Modality enrichment (LISI score), computed as the fraction of neighbors of the KNN that are from the same modality, normalized by the overall fraction of the cells from that modality. e, The mean distance between the two representations of artificially unpaired cells, measured as the number of cells between them.
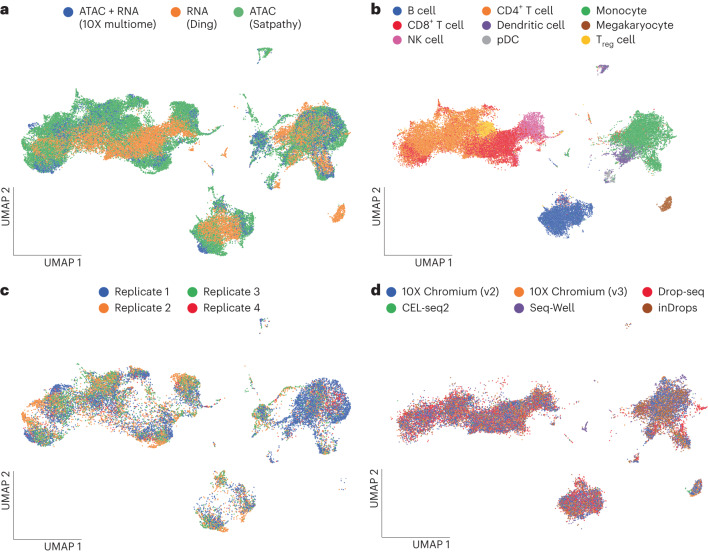
a–d, UMAP representation computed from the latent space of MultiVI in which cells are color labeled by their modality (a) and cell-type label (b); scATAC-seq PBMC cells labeled by the replicate from which they were collected (c) and scRNA-seq cells labeled by their experimental technology (d). NK cell, natural killer cell; pDC, plasmacytoid dendritic cell; Treg cell, regulatory T cell.
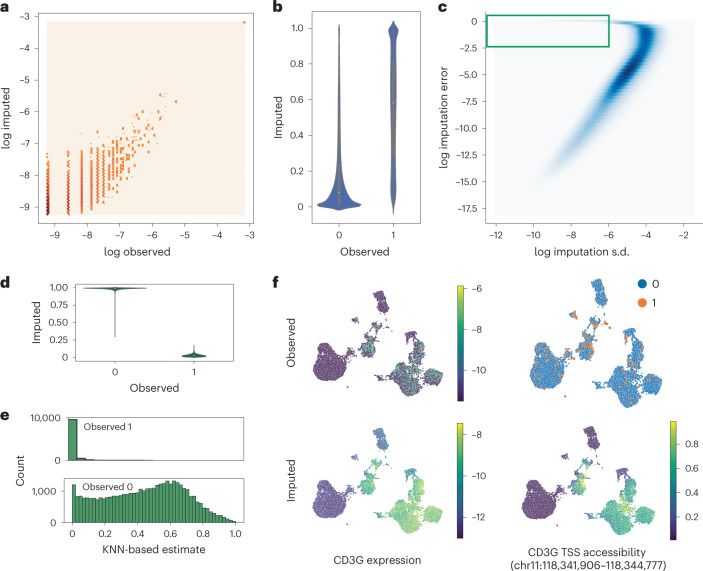
a, Normalized observed RNA counts by MultiVI-imputed RNA estimates; all values, including color intensity, are presented on a log scale (log(x + 1 − 4)) for stability. b, MultiVI-imputed accessibility estimates by the observed values. c, The imputation error (imputed − observed)2 as a function of the standard deviation (s.d.) of the imputed accessibility estimates. The green box marks the high-confidence–high-error values examined in the following panels. d, MultiVI-imputed accessibility estimates by the observed values for high-confidence–high-error cases. e, Smooth accessibility estimates for values observed as 1 (top) and 0 (bottom). Estimates computed by averaging the accessibility profiles of the 50 nearest neighbors, in a 50-dimensional space computed using latent semantic indexing. f, Observed and imputed values for CD3G expression and CD3G TSS accessibility. Expression values are normalized per cell and displayed on a log scale.
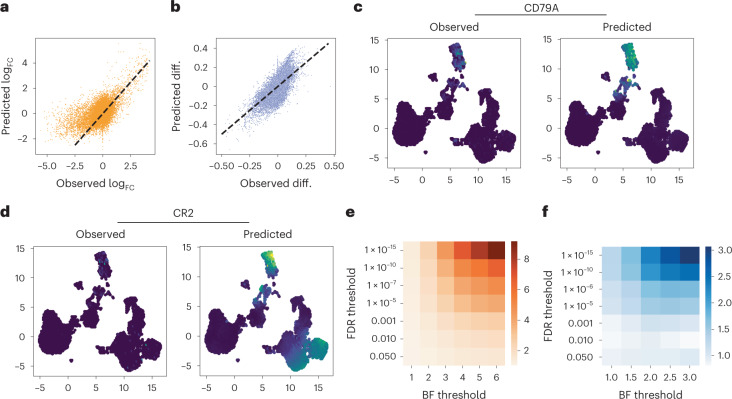
a,b, Differential effect sizes between B cells and the remainder of the data, comparing the effects computed from the held-out expression data with those predicted by MultiVI, for differential expression (a) and differential accessibility (b). c,d, Expression values for B cell marker CD79A (c) and B and T cell marker CR2 (d), observed in the held-out data (left) and predicted by MultiVI (right), displayed using latent space coordinated computed using all the available data. e,f, Fold enrichment of the overlap between statistically significant results for various significance thresholds for expression (e) and accessibility (f). Observed diff., observed differential. BF threshold, Bayes factor threshold.
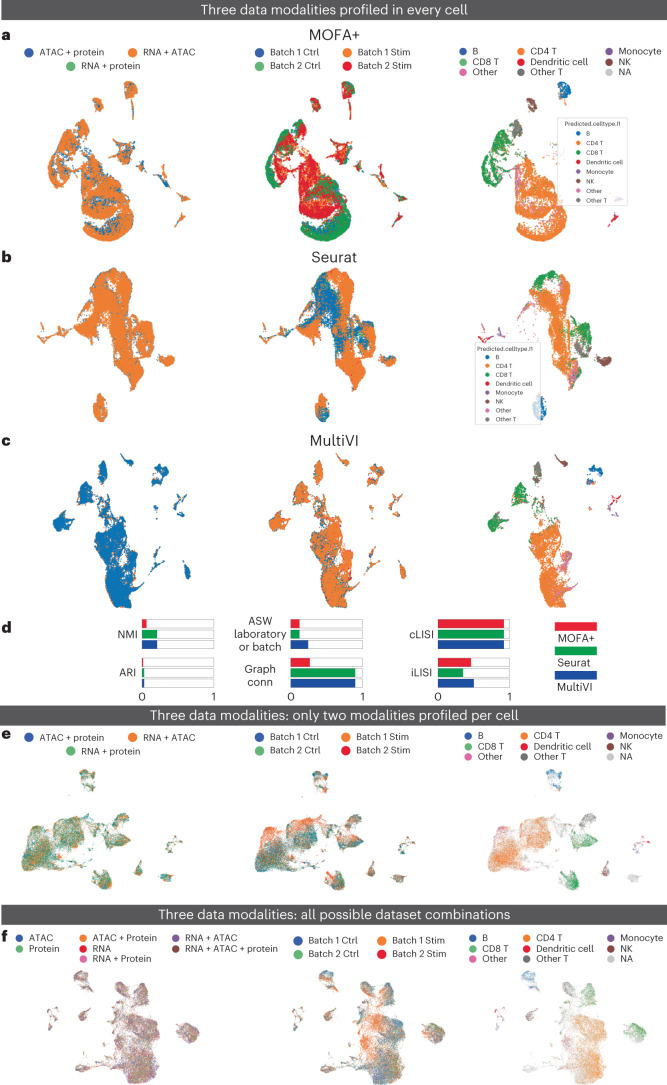
a–c, UMAP representations computed for a dataset of PBMCs collected using the DOGMA-seq protocol by MOFA (a), Seurat WNN (b) and MultiVI (c). In each panel, cells are color coded by replicate (left), condition (middle) and cell type (right). d, Summary metrics describing batch correction and biological preservation color coded by method. e, PBMC DOGMA-seq dataset in which no cells has three modality information. UMAP representation of the latent representation computed by MultiVI in which cells are color labeled by their modality, batch and cell type. f, PBMC DOGMA-seq dataset in which cells are measured in every possible combination. UMAP representation of the latent representation computed by MultiVI in which cells are color labeled by their modality, batch and cell type. Stim, stimulation; Ctrl, control; ASW, average silhouette width; NMI, normalized mutual information; Graph conn., graph connectivity.
References
Publication types
MeSH terms
Grants and funding
LinkOut - more resources
Full Text Sources
