. 2023 Aug;160(2):83-96.
doi: 10.1007/s00418-023-02211-7. Epub 2023 Jun 29.

The unremarkable alveolar epithelial glycocalyx: a thorium dioxide-based electron microscopic comparison after heparinase or pneumolysin treatment

Affiliations

The unremarkable alveolar epithelial glycocalyx: a thorium dioxide-based electron microscopic comparison after heparinase or pneumolysin treatment

Sara Timm et al. Histochem Cell Biol. 2023 Aug.

Abstract

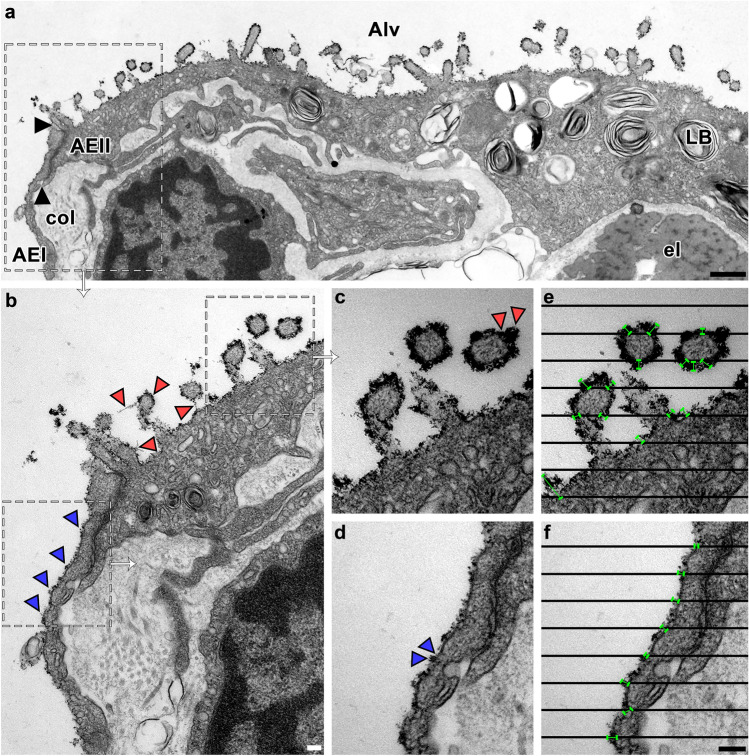
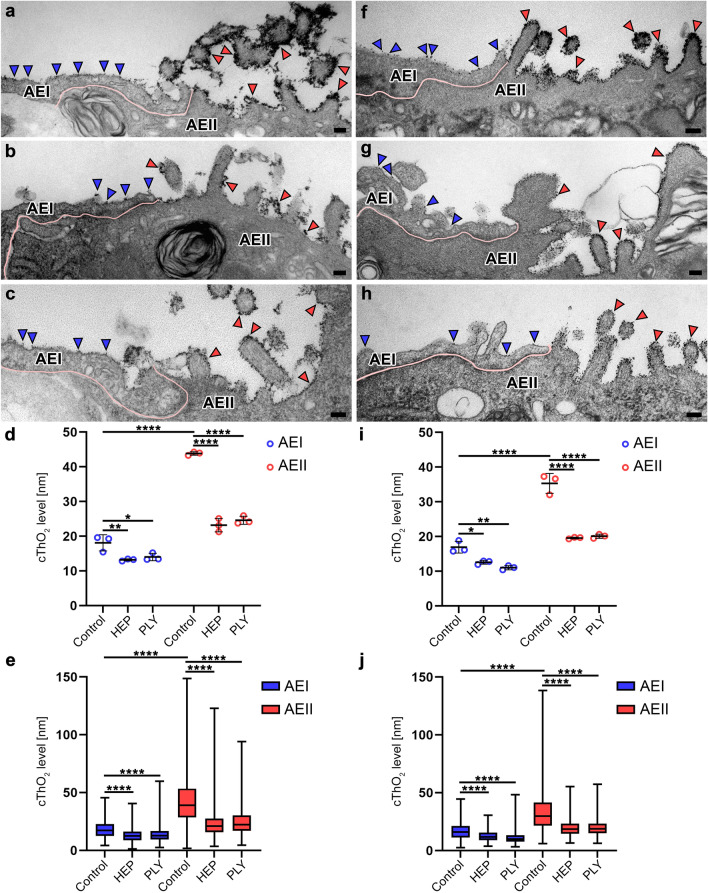
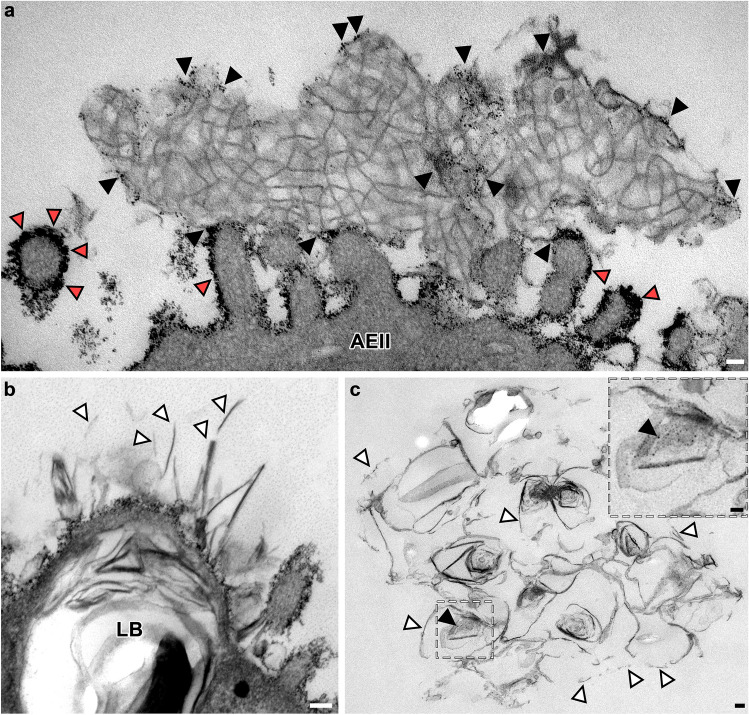
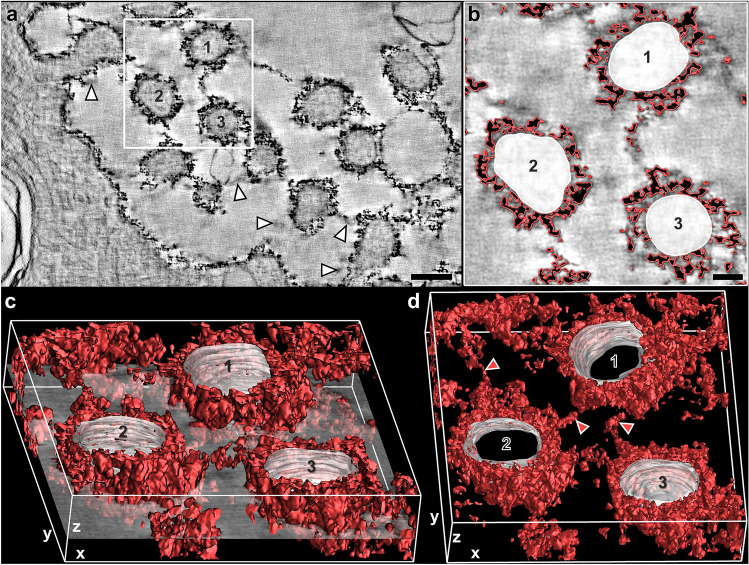
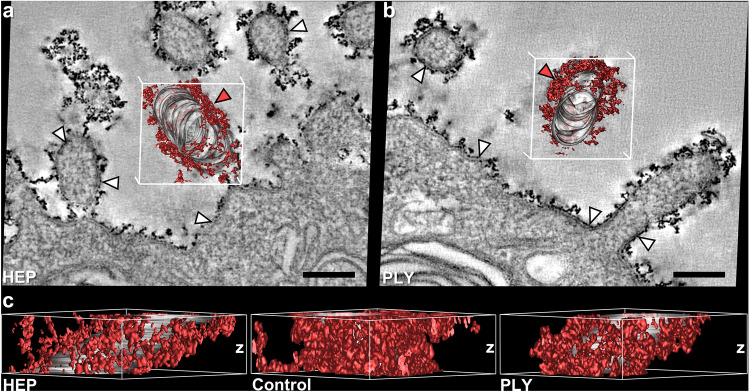
Recent investigations analyzed in depth the biochemical and biophysical properties of the endothelial glycocalyx. In comparison, this complex cell-covering structure is largely understudied in alveolar epithelial cells. To better characterize the alveolar glycocalyx ultrastructure, unaffected versus injured human lung tissue explants and mouse lungs were analyzed by transmission electron microscopy. Lung tissue was treated with either heparinase (HEP), known to shed glycocalyx components, or pneumolysin (PLY), the exotoxin of Streptococcus pneumoniae not investigated for structural glycocalyx effects so far. Cationic colloidal thorium dioxide (cThO2) particles were used for glycocalyx glycosaminoglycan visualization. The level of cThO2 particles orthogonal to apical cell membranes (≙ stained glycosaminoglycan height) of alveolar epithelial type I (AEI) and type II (AEII) cells was stereologically measured. In addition, cThO2 particle density was studied by dual-axis electron tomography (≙ stained glycosaminoglycan density in three dimensions). For untreated samples, the average cThO2 particle level was ≈ 18 nm for human AEI, ≈ 17 nm for mouse AEI, ≈ 44 nm for human AEII and ≈ 35 nm for mouse AEII. Both treatments, HEP and PLY, resulted in a significant reduction of cThO2 particle levels on human and mouse AEI and AEII. Moreover, a HEP- and PLY-associated reduction in cThO2 particle density was observed. The present study provides quantitative data on the differential glycocalyx distribution on AEI and AEII based on cThO2 and demonstrates alveolar glycocalyx shedding in response to HEP or PLY resulting in a structural reduction in both glycosaminoglycan height and density. Future studies should elucidate the underlying alveolar epithelial cell type-specific distribution of glycocalyx subcomponents for better functional understanding.

Keywords: Alveolar epithelial glycocalyx; Electron tomography; Heparinase; Lung stereology; Pneumolysin; Thorium dioxide.


Conflict of interest statement

The authors declare that they have no conflict of interest.

Figures

Fig. 1
Fig. 1
Measurement of alveolar epithelial cThO2 particle levels. TEM of an ultra-thin section from human control lung tissue. a AEI and AEII facing the alveolar lumen (Alv) with thin, dark cThO2 particle layer on apical membranes. Black arrows mark the boundary between AEI and AEII, shown in b at higher magnification. LB = lamellar body, col = collagen fibers, el = elastic fibers. Scale bar: 500 nm. b Magnified boundary between AEI and AEII from a. Blue arrowheads indicate a continuous cThO2 layer on AEI. Red arrowheads indicate a continuous cThO2 layer on AEII, some of which have filamentous extensions. Scale bar: 100 nm. cf Magnified areas from b. Note the intense cThO2 staining on AEII in c with locally larger extensions (red arrowheads) versus the less intense, thinner cThO2 staining on AEI in d with less large extensions (blue arrowheads). The black line grid in e and f is placed over c and d images. Orthogonal distance from clearly visible cell membranes intersected by a line to the end of cThO2 staining was measured (green bars). Cut membranes that were not clearly identifiable due to orientation or overlap within the section were not included in the analysis. Scale bar: 100 nm
Fig. 2
Fig. 2
Comparison of cThO2 particle levels on control versus HEP- or PLY-treated AEI and AEII. TEM of ultra-thin sections from human lung tissue explants (ac) and mouse lungs (fh). ac and fh Boundary between AEI and AEII marked by pink line. CThO2 particles on alveolar epithelium marked by blue (AEI) and red (AEII) arrowheads. Compared to control (a and f), HEP (b and g) and PLY (c and h) treatments show a decreased density of cThO2 particles on both AEI and AEII with a rather patchy cThO2 layer, particularly pronounced in human lung tissue. Scale bars: 100 nm. d and i Statistical analysis for measured means of human (d) and mouse (i) treatment subgroups was performed with two-way ANOVA test. Data are shown as mean ± standard deviation. *P < 0.05, **P < 0.01, ****P < 0.0001 compared to controls. e and j Distribution of all measurements per treatment group shown as box plot with median for human (e) and mouse (j) samples. Statistical analysis was performed with the Kruskal–Wallis test. ****P < 0.0001 compared to controls
Fig. 3
Fig. 3
CThO2 particles on alveolar surfactant subtypes. TEM of ultra-thin sections from mouse (a) and human (bc) lung tissue. a Control AEII microvilli extending into alveolar lumen containing tubular myelin as intra-alveolar surfactant subtype. Note cThO2 particles located not only on the microvilli membranes (red arrowheads) but also in direct relation to tubular myelin (black arrowheads). Scale bar: 50 nm. b HEP-treated AEII with exocytosed surfactant components, which appear fragmented (white arrowheads). LB = lamellar body. Scale bar: 100 nm. c Fragmented and disorganized surfactant components after PLY treatment (white arrowheads). Individual cThO2 particles (black arrowhead) are visible in the magnification on the upper right. Scale bar: 100 nm
Fig. 4
Fig. 4
Computer-based cThO2 signal analysis of human control AEII. Dual-axis ET of a semi-thin section from human control lung. a Single virtual xy-slice (z = 1.84 nm) out of the tomogram. Note the relatively continuous cThO2 particle layer present even in such very thin slice. White arrowheads exemplarily mark “shadow-like” effects in close proximity to the glycocalyx, radiating from the strong signal of cThO2 particles from preceding and following virtual slices. Scale bar: 150 nm. b Virtual xy-slice cutout from a. Automatic isosurface for intensity values of cThO2 particle outer limits (red) and manually marked area of three microvilli cytoplasm and membranes (1, 2, 3). Scale bar: 50 nm. c Virtual transparent xy-slice cutout from b rotated around the y-axis with resulting 3D model of 55 consecutive above and below virtual xy-slices (≈ 100 nm z-thickness) in which cThO2 particles and microvilli membranes were tracked as labeled in b. d 3D model of cThO2 particles from c rotated around the y-axis reveals interconnections between microvilli (red arrowheads)
Fig. 5
Fig. 5
Comparison of cThO2 particle distribution in the z-direction between control versus HEP and PLY treatment. Dual-axis ET of semi-thin sections (microtome set z-thickness = 250 nm) from human HEP- or PLY-treated lung tissue. a, b Single virtual xy-slices (z = 1.84 nm) out of the tomogram each with a red 3D cThO2 particle model on microvillus membranes (gray) tracked in over 55 consecutive virtual xy-slices (≈ 100 nm z-thickness) as shown in Fig. 3. Note the more discontinuous cThO2 layers compared to Fig. 4a. White arrowheads exemplary mark larger membrane areas on which cThO2 staining is absent. Membranes after HEP (a) and PLY (b) treatment are comparably intact. Red arrowheads on the 3D model mark regions of higher cThO2 accumulation whose z-distribution is analyzed in c. Scale bars: 150 nm.  c View on the z-axis of the 3D cThO2 particle models from a and b from the direction of the red arrowheads and for comparison view on the z-axis of control microvillus 1 from Fig. 4. HEP and PLY show alterations in the form of cThO2 staining gaps of different sizes towards the cell membrane compared to only very small gaps in the control

References

    1. Adamson IY, Bowden DH. The surface complexes of the lung: a cytochemical partition of phospholipid surfactant and mucopolysaccharide. Am J Pathol. 1970;61(3):359–376. - PMC - PubMed
    1. Aquino RS, Hayashida K, Hayashida A, Park PW. Role of HSPGs in systemic bacterial infections. Methods Mol Biol. 2022;2303:605–625. doi: 10.1007/978-1-0716-1398-6_46. - DOI - PMC - PubMed
    1. Bartlett AH, Park PW. Proteoglycans in host-pathogen interactions: molecular mechanisms and therapeutic implications. Expert Rev Mol Med. 2010;12:e5. doi: 10.1017/S1462399409001367. - DOI - PMC - PubMed
    1. Bennett HS. Morphological aspects of extracellular polysaccharides. J Histochem Cytochem. 1963;11(1):14–23. doi: 10.1177/11.1.14. - DOI
    1. Bernfield M, Gotte M, Park PW, Reizes O, Fitzgerald ML, Lincecum J, Zako M. Functions of cell surface heparan sulfate proteoglycans. Annu Rev Biochem. 1999;68:729–777. doi: 10.1146/annurev.biochem.68.1.729. - DOI - PubMed

LinkOut - more resources