Observational Study
. 2023 Jul;29(7):1804-1813.
doi: 10.1038/s41591-023-02396-3. Epub 2023 Jun 29.

Machine learning for ECG diagnosis and risk stratification of occlusion myocardial infarction

Affiliations
Observational Study

Machine learning for ECG diagnosis and risk stratification of occlusion myocardial infarction

Salah S Al-Zaiti et al. Nat Med. 2023 Jul.

Abstract

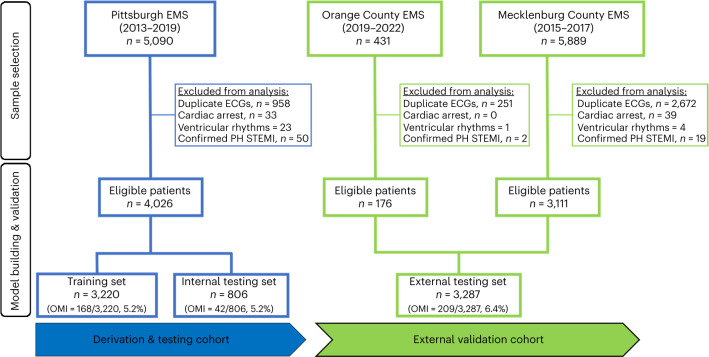
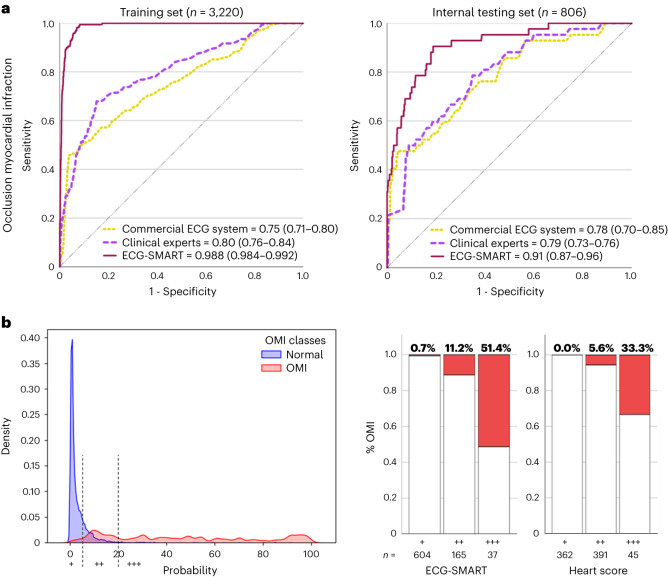
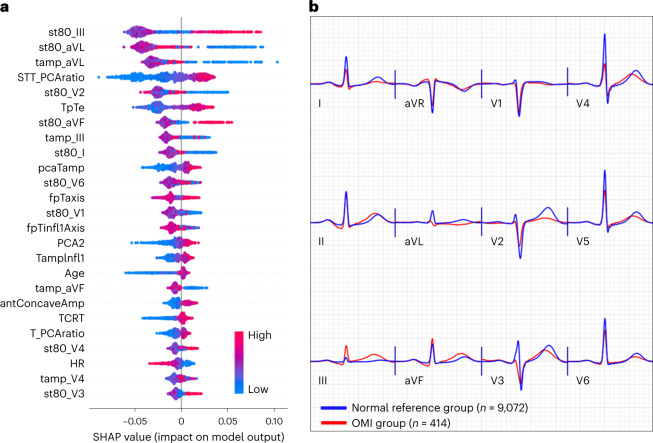
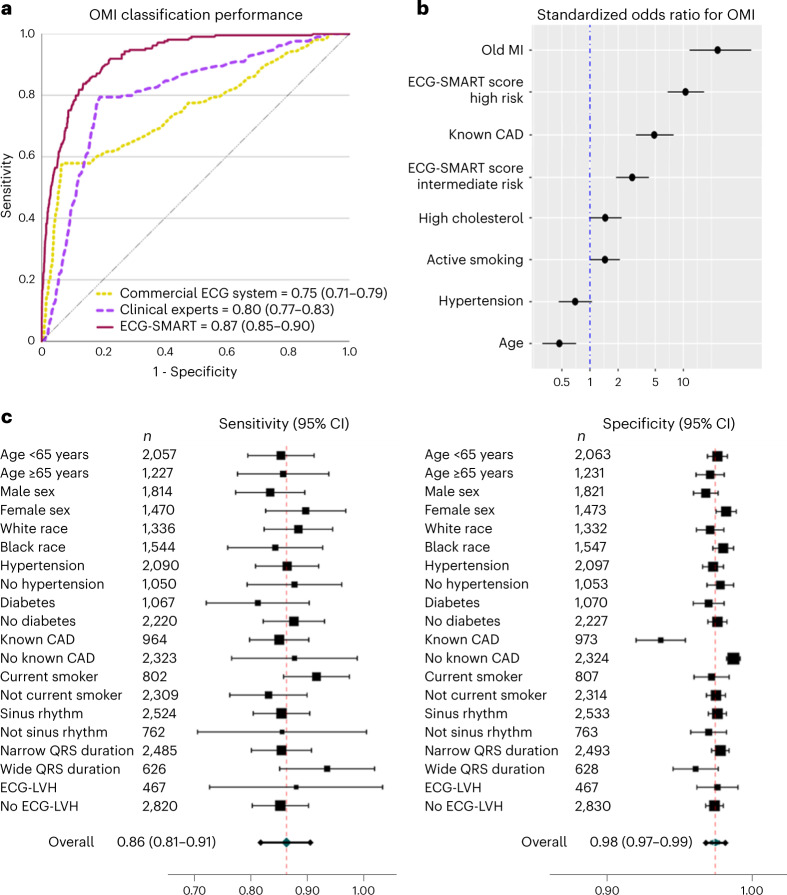
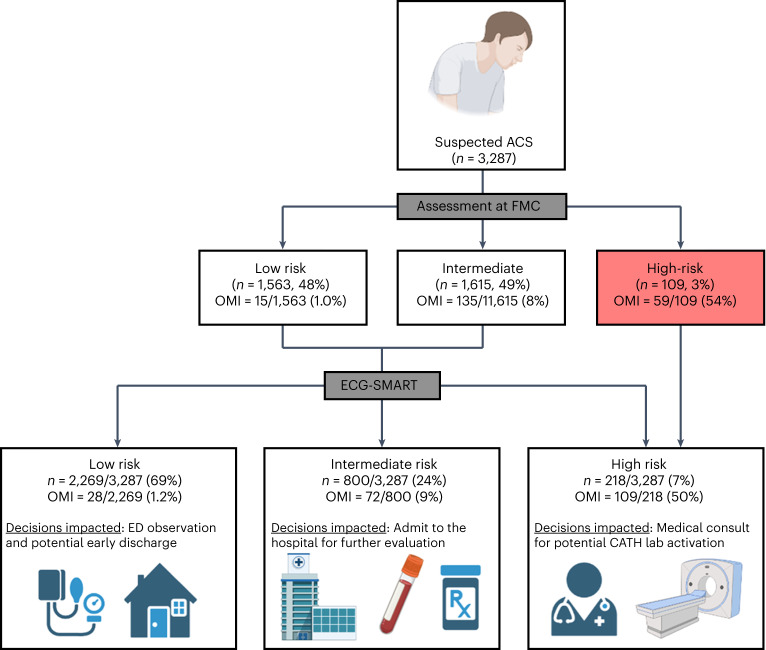
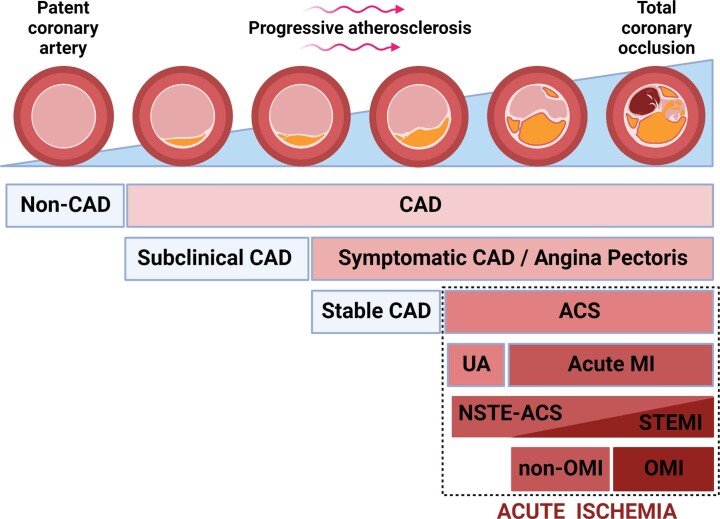
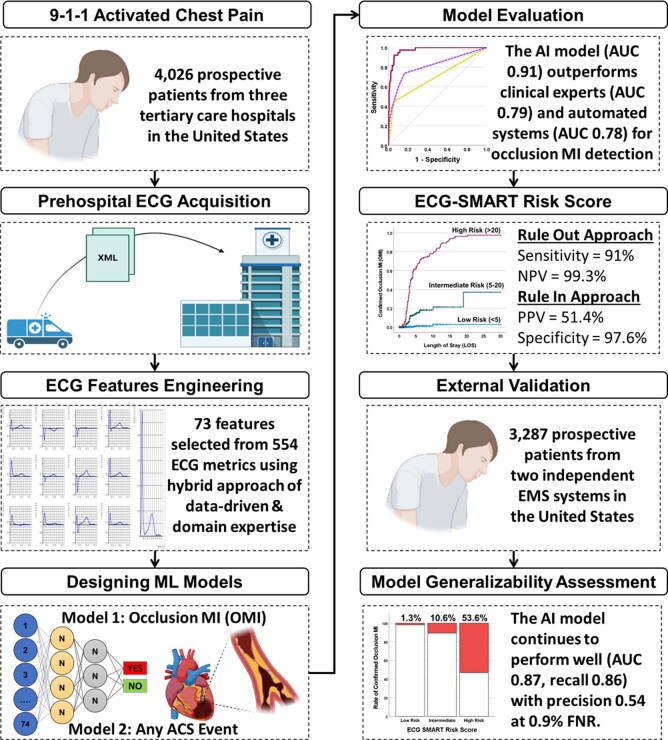
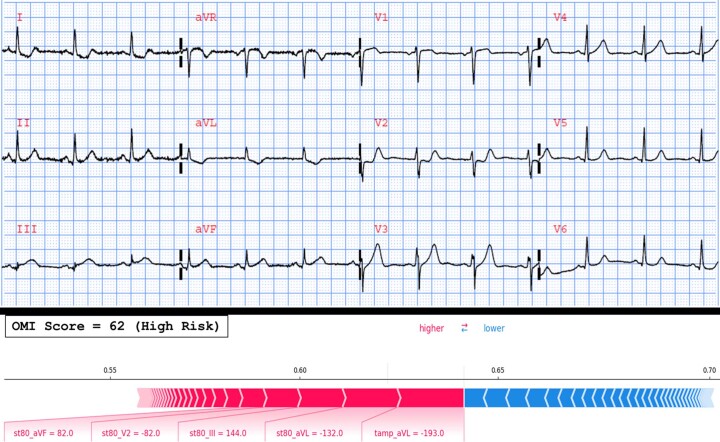
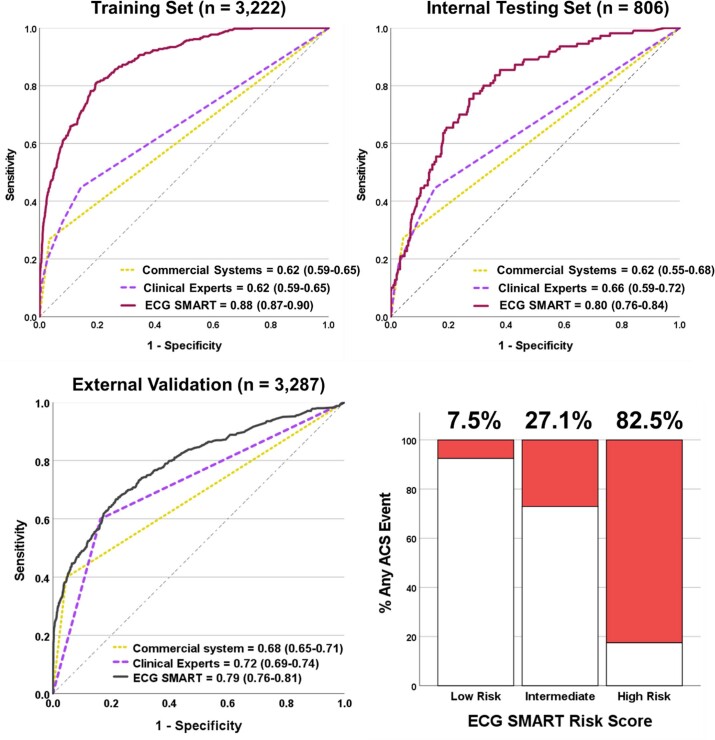
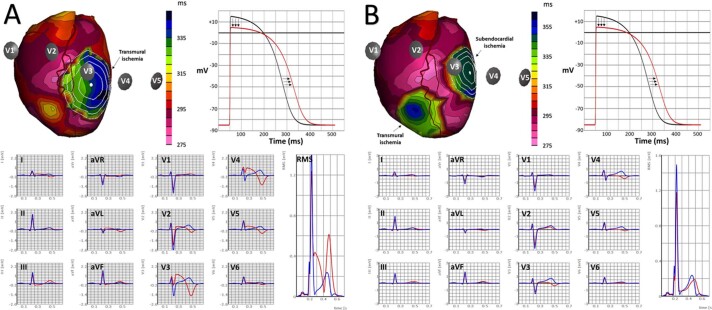
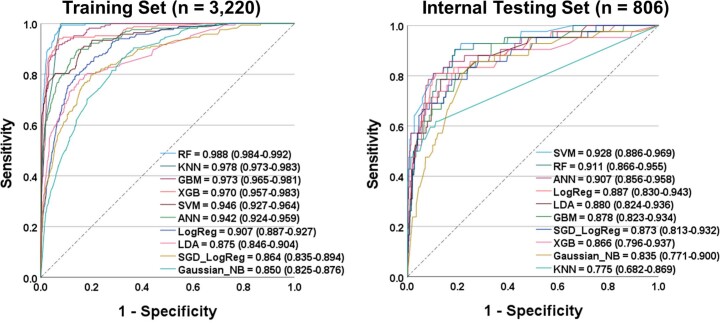
Patients with occlusion myocardial infarction (OMI) and no ST-elevation on presenting electrocardiogram (ECG) are increasing in numbers. These patients have a poor prognosis and would benefit from immediate reperfusion therapy, but, currently, there are no accurate tools to identify them during initial triage. Here we report, to our knowledge, the first observational cohort study to develop machine learning models for the ECG diagnosis of OMI. Using 7,313 consecutive patients from multiple clinical sites, we derived and externally validated an intelligent model that outperformed practicing clinicians and other widely used commercial interpretation systems, substantially boosting both precision and sensitivity. Our derived OMI risk score provided enhanced rule-in and rule-out accuracy relevant to routine care, and, when combined with the clinical judgment of trained emergency personnel, it helped correctly reclassify one in three patients with chest pain. ECG features driving our models were validated by clinical experts, providing plausible mechanistic links to myocardial injury.


Conflict of interest statement

US Patent 10820822; owner: University of Pittsburgh; inventors: S.S.A.-Z., E.S. and C.W.C. This patent describes methods and systems for identifying increased likelihood of non-ST elevation myocardial infarction (NSTEMI) in a patient based on ECG data. This patent is not under any licensing or commercial agreement whatsoever. The remaining authors declare no competing interests.

Figures

Fig. 1
Fig. 1. Cohort and sample selection.
This flow diagram shows patient inclusion and exclusion criteria in each cohort as well as the dataset partition for training, internal testing and external validation cohorts. Exclusions are not mutually exclusive. EMS, Emergency Medical Services; PH, pre-hospital.
Fig. 2
Fig. 2. Algorithm derivation and testing.
This figure shows the classification performance of the machine learning model against other reference standards for detecting OMI (a), the probability density plots of OMI(+) and OMI(−) classes as denoted by the machine learning model, along with optimal cutoffs of low risk, intermediate risk and high risk (b, left), and distribution of patients in low risk (+), intermediate risk (++) and high risk (+++) as per the machine learning model and HEART score (b, right).
Fig. 3
Fig. 3. Model explainability for OMI detection.
This figure shows SHAP values for the 25 most important features driving the predictions of the machine learning classifier in the derivation cohort (a) and the aggregate median beats of ECGs with OMI class (red) and the aggregate median beats of ECGs with normal sinus rhythm and no OMI (blue) (b). antConcaveAmp, the sum of concave amplitudes in the anterior leads; fpTaxis, T axis in the frontal plane; HR, heart rate; Infl1, the first inflection point before T peak; ST80, ST amplitude at the J point + 80 ms; tamp, T amplitude; TCRT, total cosine R-to-T; TpTe, Tpeak–Tend interval.
Fig. 4
Fig. 4. External validation of the ECG-SMART algorithm.
ac, This figure shows the classification performance of the machine learning model against other reference standards for detecting OMI on the external validation set (n = 3,287) (a), adjusted OR (center) with 95% CI (error bars) for the independent clinical predictors of OMI on the external validation set (n = 3,287) (b) and the overall sensitivity and specificity (center) with 95% CI (error bars) of the derived OMI score, along with breakdown across subgroups based on age, sex, comorbidities and baseline ECG findings (c). The size of the center marker is proportionate to the sample size of the respective subgroup.
Fig. 5
Fig. 5. NRI of OMI risk score when integrated in the clinical workflow and concept of potential impact on subsequent clinical decisions.
This figure describes the incremental gain of the derived risk score in reclassifying the initial triage decisions by emergency personnel at first medical contact and depicts the concept of potential impact on subsequent clinical decisions. This figure was created with BioRender (credit to S.S.A.-Z.). CATH, catheterization; ED, emergency department; FMC, first medical contact.
Extended Data Fig. 1
Extended Data Fig. 1. The relationship between the magnitude of vessel occlusion and the classification of acute coronary events.
This figure shows the spectrum of coronary artery disease (CAD) as a function of severity and extent of atherosclerosis plaque progression, ranging from patent coronary artery (far left) to total coronary occlusion (far right). Among patients who develop symptomatic CAD, including those evaluated for chest pain or angina-like symptoms, a subset is diagnosed with acute coronary syndrome (ACS). This group is subclassified as either acute myocardial infarction (MI) or unstable angina (UA). Those with acute MI can be further subclassified, based on the presence of ST-elevation on the ECG, as either ST-elevation myocardial infarction (STEMI) or without ST-elevation (NSTEMI). The STEMI and NSTEMI patients overlap in terms of the presence or absence of total occlusion (depicted as triangles across the continuum in the figure). Alternatively, the same group with acute MI can be subclassified, based on angiographic TIMI flow criteria, as either occlusion (OMI) or non-occlusion (non-OMI) myocardial infarction. Unlike STEMI, OMI classification better aligns with focal angiographic findings since this group exclusively contains patients with total coronary occlusion. The color gradient indicates the severity of disease. This Figure was created with BioRender.com. Reproduced with permission from Al-Zaiti et. al.1 (permission number 5471421247333, Licensed content publisher: Elsevier).
Extended Data Fig. 2
Extended Data Fig. 2. Graphical abstract summarizing the flow of study and main finding.
This figure provides a graphical summary of the study flow and main findings. This Figure was created with BioRender.com (Credit to Salah Al-Zaiti).
Extended Data Fig. 3
Extended Data Fig. 3. Local explainability of feature importance on a selected example.
This figure shows the baseline ECG of a 50-year-old female with a past medical history of hypertension, high cholesterol, prior myocardial infarction, and current smoking. The ECG was documented as benign with isolated non-specific T wave changes, and the patient was triaged as intermediate risk. The patient was later sent to the catheterization lab where she had complete occlusion of the right coronary artery. The OMI score on this baseline ECG was 62 indicating high risk designation. The force plot identified the five most important ECG features that met the contribution threshold of the random forest model: negative T wave in aVL, slight ST depression in aVL and V2, and slight ST elevation in aVF and III.
Extended Data Fig. 4
Extended Data Fig. 4. Selected example of a patient correctly reclassified as OMI.
This figure shows an ECG that was correctly reclassified as occlusion myocardial infarction by the machine learning model. This baseline ECG was for a 67-year-old male with a past medical history of high cholesterol and a prior myocardial infarction. The ST-depression in anterior-lateral leads were noted, and the patient was triaged as intermediate risk. The OMI score was 49 indicating the need to up-triage. The patient was later sent to the catheterization lab where he had complete occlusion of the right coronary artery.
Extended Data Fig. 5
Extended Data Fig. 5. Selected example of a missed OMI by our model.
This figure provides a selected example of a patient with occlusion myocardial infarction that was missed by the machine learning model and other reference standards. This ECG was obtained on a 70-year-old female with a past medical history of hypertension, high cholesterol, prior myocardial infarction, and current smoking. The baseline clinical interpretation suggests normal sinus rhythm with benign findings. There are isolated Q waves in inferior leads, low ECG voltage, and some baseline wander and high frequency noise in few leads. The OMI risk score was 2 indicating a low risk. The patient was later sent to the catheterization lab, which showed severe left main occlusion and had many stents placed. The patient developed new-onset HF during hospitalization. A closer look at this ECG by experienced ECG readers suggests that this ECG could resemble the ‘precordial swirl pattern’, a rightward ST-elevation vector, with STE in V1 and aVR and reciprocal ST-depression in V5 and V6. This pattern was found to correlate with LAD occlusion.
Extended Data Fig. 6
Extended Data Fig. 6. Development and validation of an algorithm to screen for any ACS event.
This figure shows the classification performance of the machine learning model against other reference standards for detecting any acute coronary syndrome event (ACS). The figure also shows the distribution of patients in low-risk, intermediate risk, and high-risk groups as per our derived risk score. There is a notable gain in precision (rule-in) but a significant loss in recall (rule-out).
Extended Data Fig. 7
Extended Data Fig. 7. Limitations of ST amplitude on surface ECG as a sole marker of myocardial ischemia.
This figure shows: (a) cardiac model of anterior wall epicardial ischemia with corresponding ST-elevation on V3 to V5 of the 12-lead ECG. (b) cardiac model of anterolateral and inferior-apical epicardial ischemia with corresponding attenuation of ST changes on the 12-lead ECG. This figure was generated using ECGSIM (www.ecgsim.org). Reproduced with permission from Al-Zaiti et. al.1 (permission number 5471421247333, Licensed content publisher: Elsevier).
Extended Data Fig. 8
Extended Data Fig. 8. Comparison between 10 algorithms trained on the derivation cohort to classify OMI.
This figure compares the area under the receiver operator characteristics curves (95% confidence interval) of 10 classifiers during training (left) and testing (right) on the derivation cohort. RF: random forest; KNN: K-nearest neighbors; GBM: gradient boosting machine; XGB: extreme gradient boosting; SVM: support vector machine; ANN: artificial neural networks; LogReg: regularized logistic regression; LDA: linear discriminant analysis; SGD_LogReg: stochastic gradient descent logistic regression; G_NB: Gaussian Naïve Bayes.

Update of

References

    1. Al-Zaiti S, Macleod MR, Van Dam PM, Smith SW, Birnbaum Y. Emerging ECG methods for acute coronary syndrome detection: recommendations & future opportunities. J. Electrocardiol. 2022;74:65–72. doi: 10.1016/j.jelectrocard.2022.08.003. - DOI - PMC - PubMed
    1. Birnbaum Y, et al. ECG diagnosis and classification of acute coronary syndromes. Ann. Noninvasive Electrocardiol. 2014;19:4–14. doi: 10.1111/anec.12130. - DOI - PMC - PubMed
    1. Goodacre S, et al. Clinical diagnosis of acute coronary syndrome in patients with chest pain and a normal or non-diagnostic electrocardiogram. Emerg. Med. J. 2009;26:866–870. doi: 10.1136/emj.2008.064428. - DOI - PubMed
    1. Ioannidis JP, Salem D, Chew PW, Lau J. Accuracy and clinical effect of out-of-hospital electrocardiography in the diagnosis of acute cardiac ischemia: a meta-analysis. Ann. Emerg. Med. 2001;37:461–470. doi: 10.1067/mem.2001.114904. - DOI - PubMed
    1. Thygesen K, et al. What’s new in the Fourth Universal Definition of Myocardial Infarction? Eur. Heart J. 2018;39:3757–3758. doi: 10.1093/eurheartj/ehy655. - DOI - PubMed

Publication types