. 2023 Jul;55(7):1198-1209.
doi: 10.1038/s41588-023-01433-8. Epub 2023 Jun 29.

Single-cell multi-omics of mitochondrial DNA disorders reveals dynamics of purifying selection across human immune cells

Affiliations

Single-cell multi-omics of mitochondrial DNA disorders reveals dynamics of purifying selection across human immune cells

Caleb A Lareau et al. Nat Genet. 2023 Jul.

Abstract

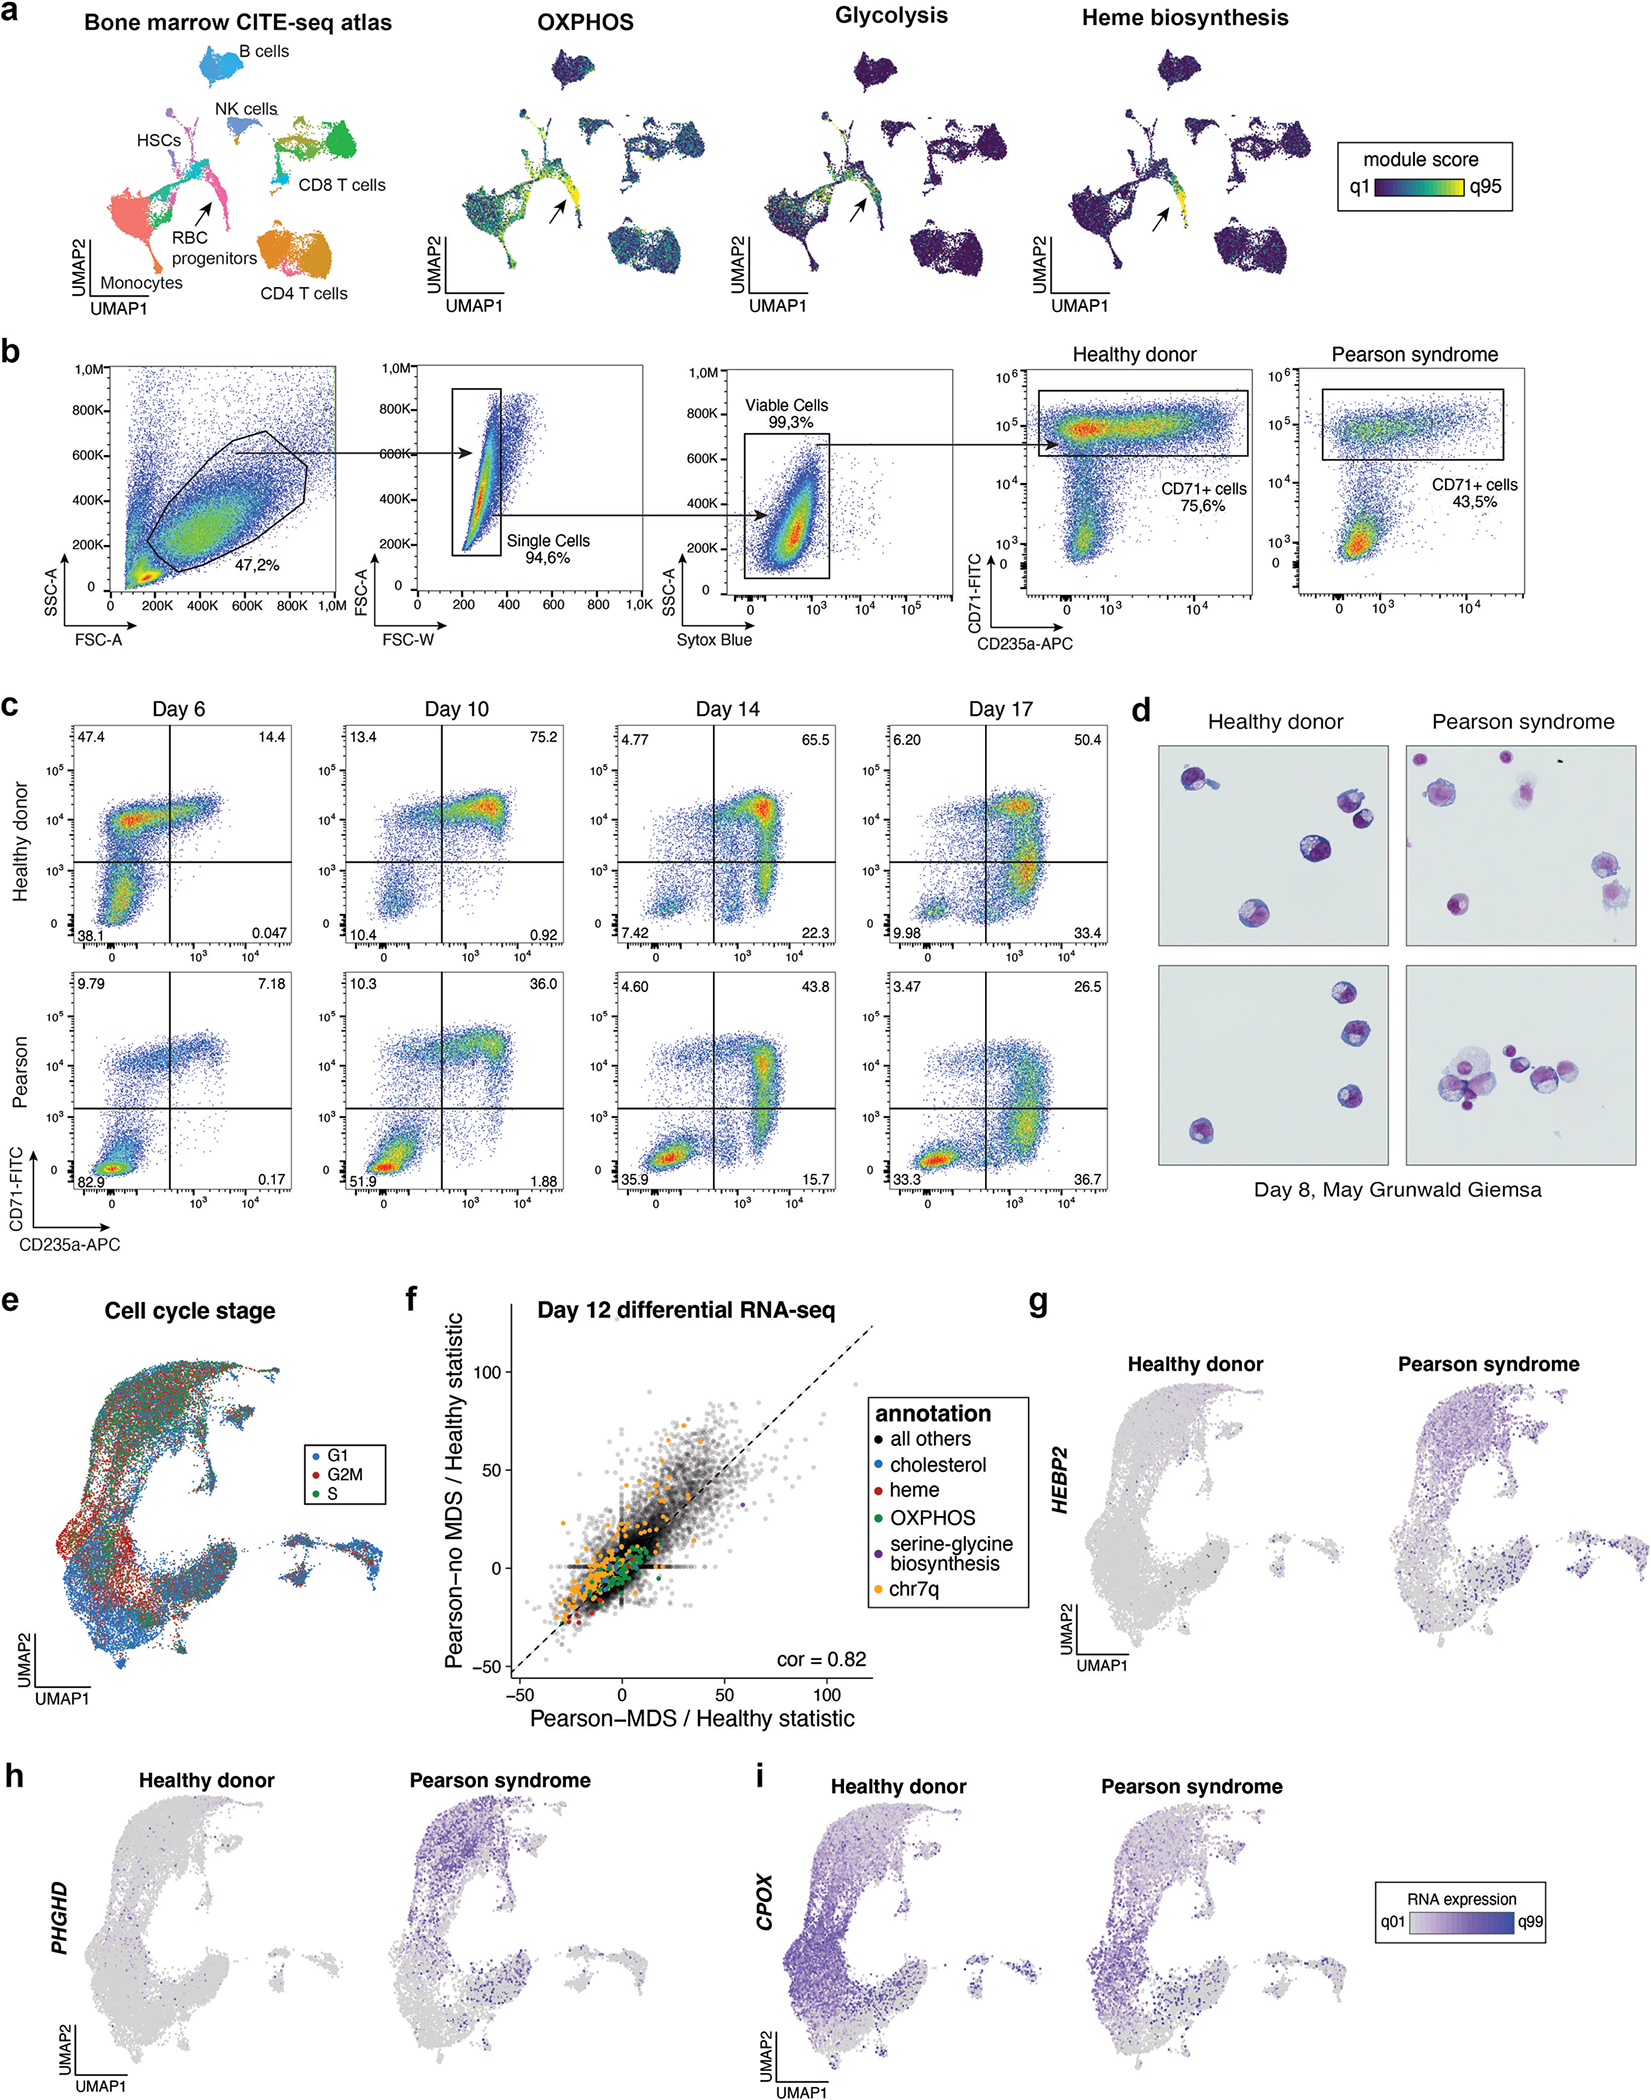
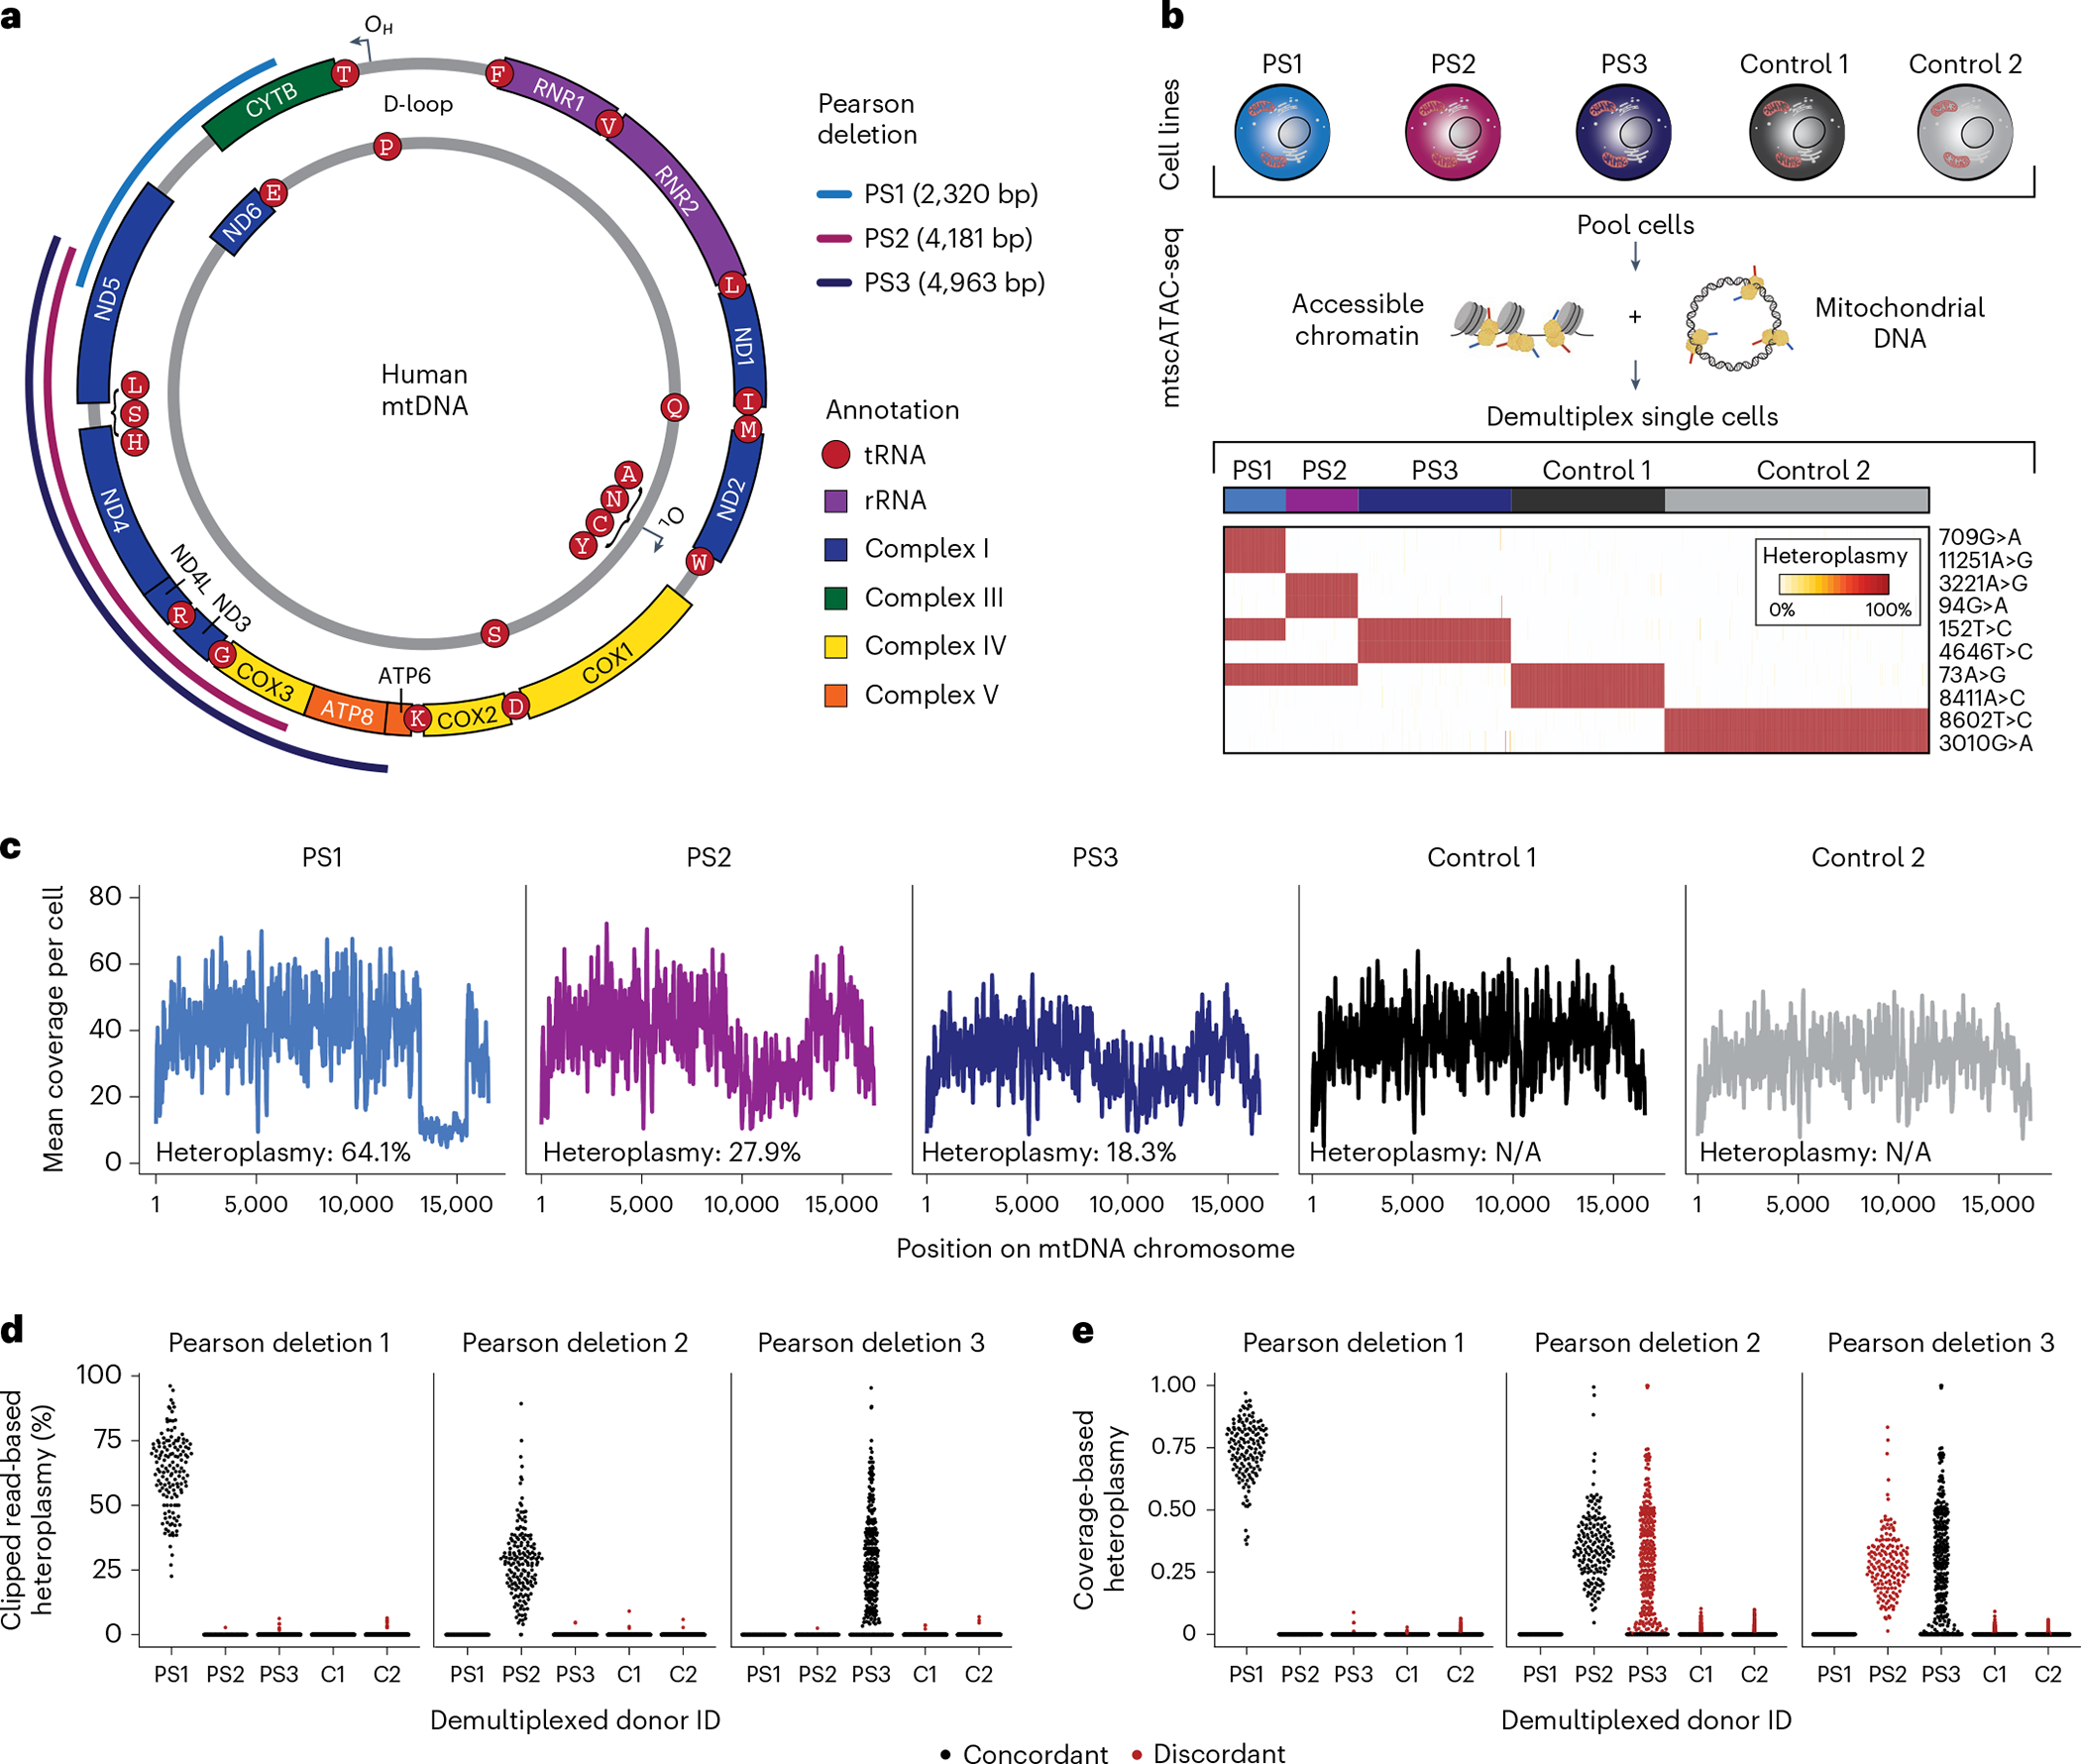
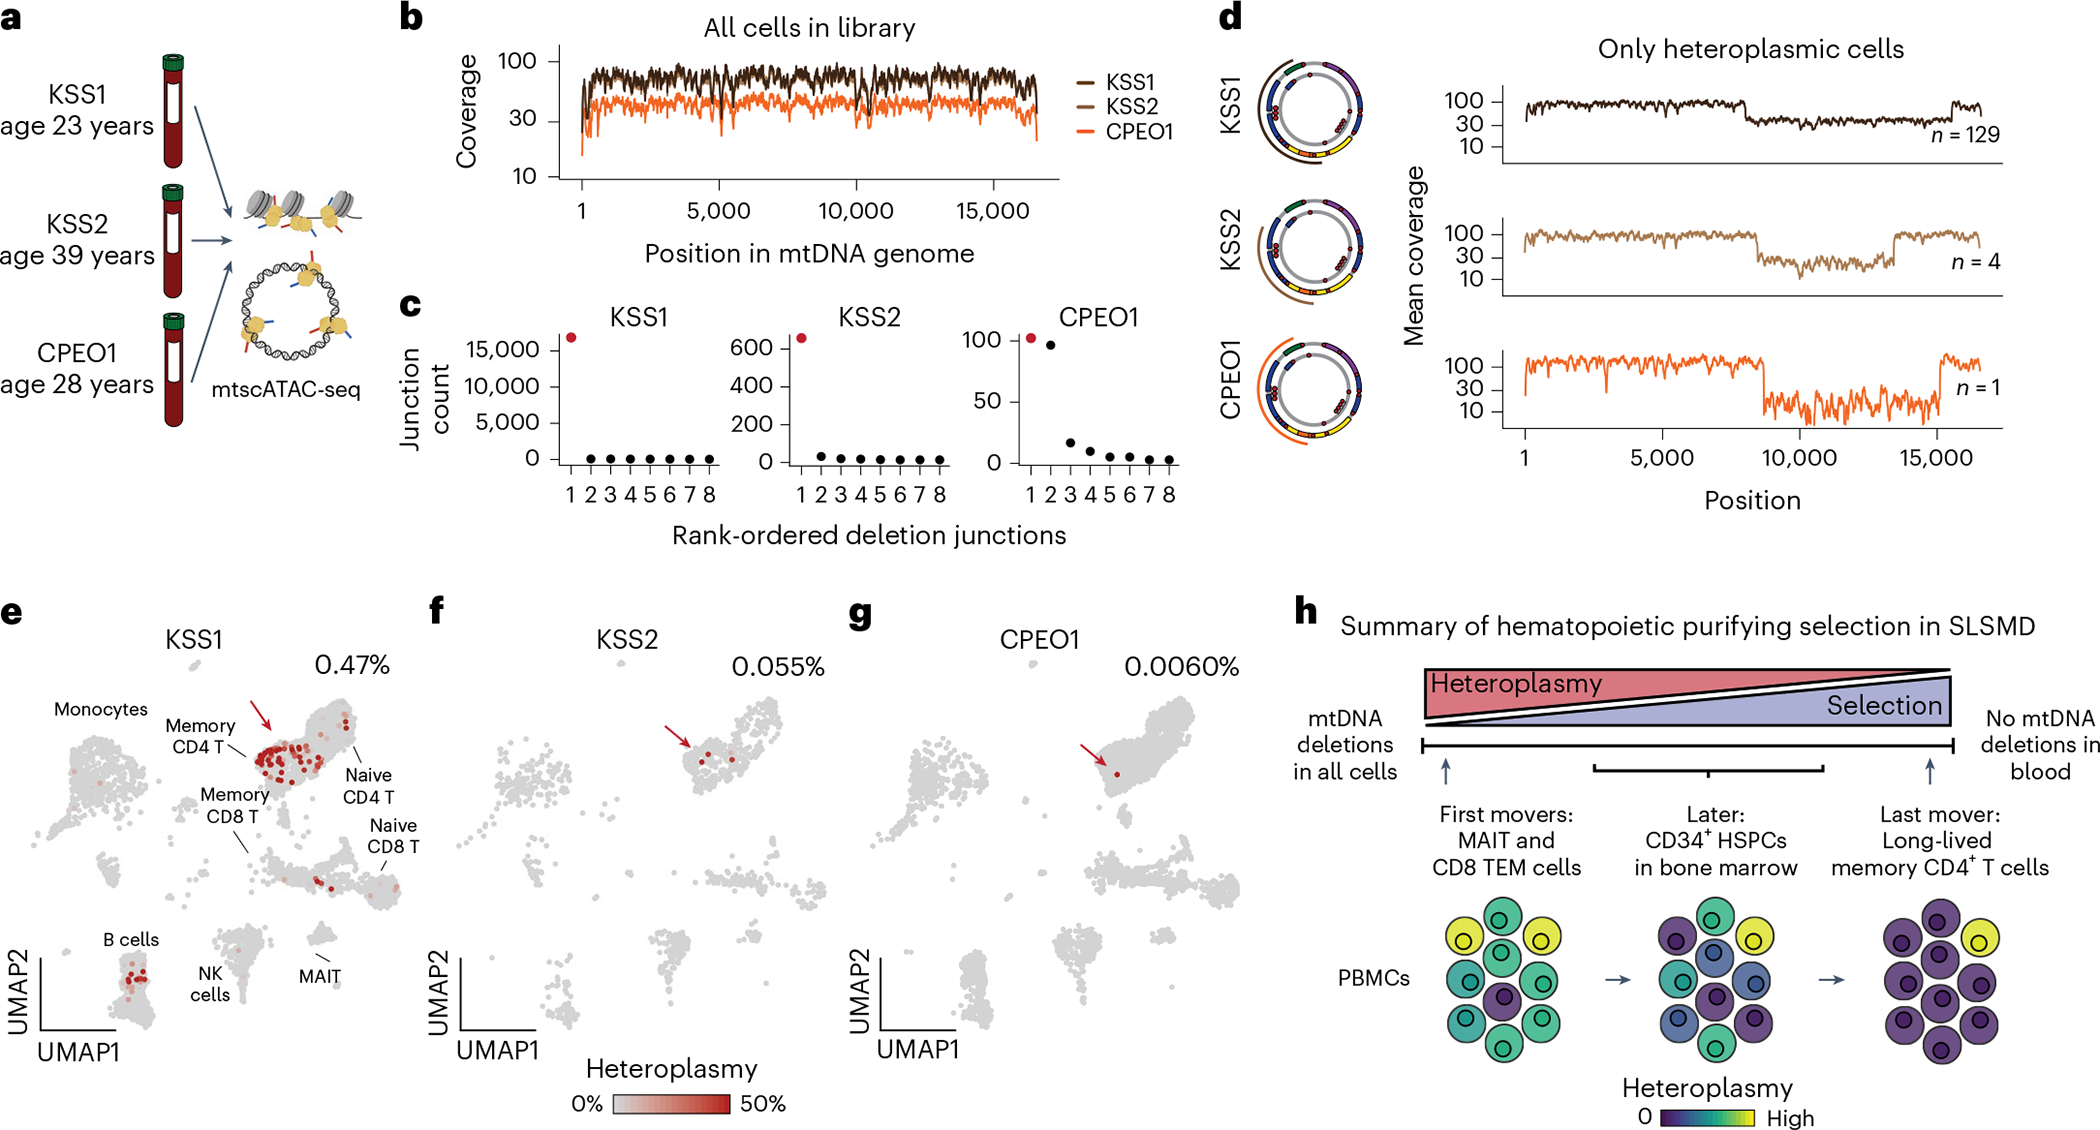
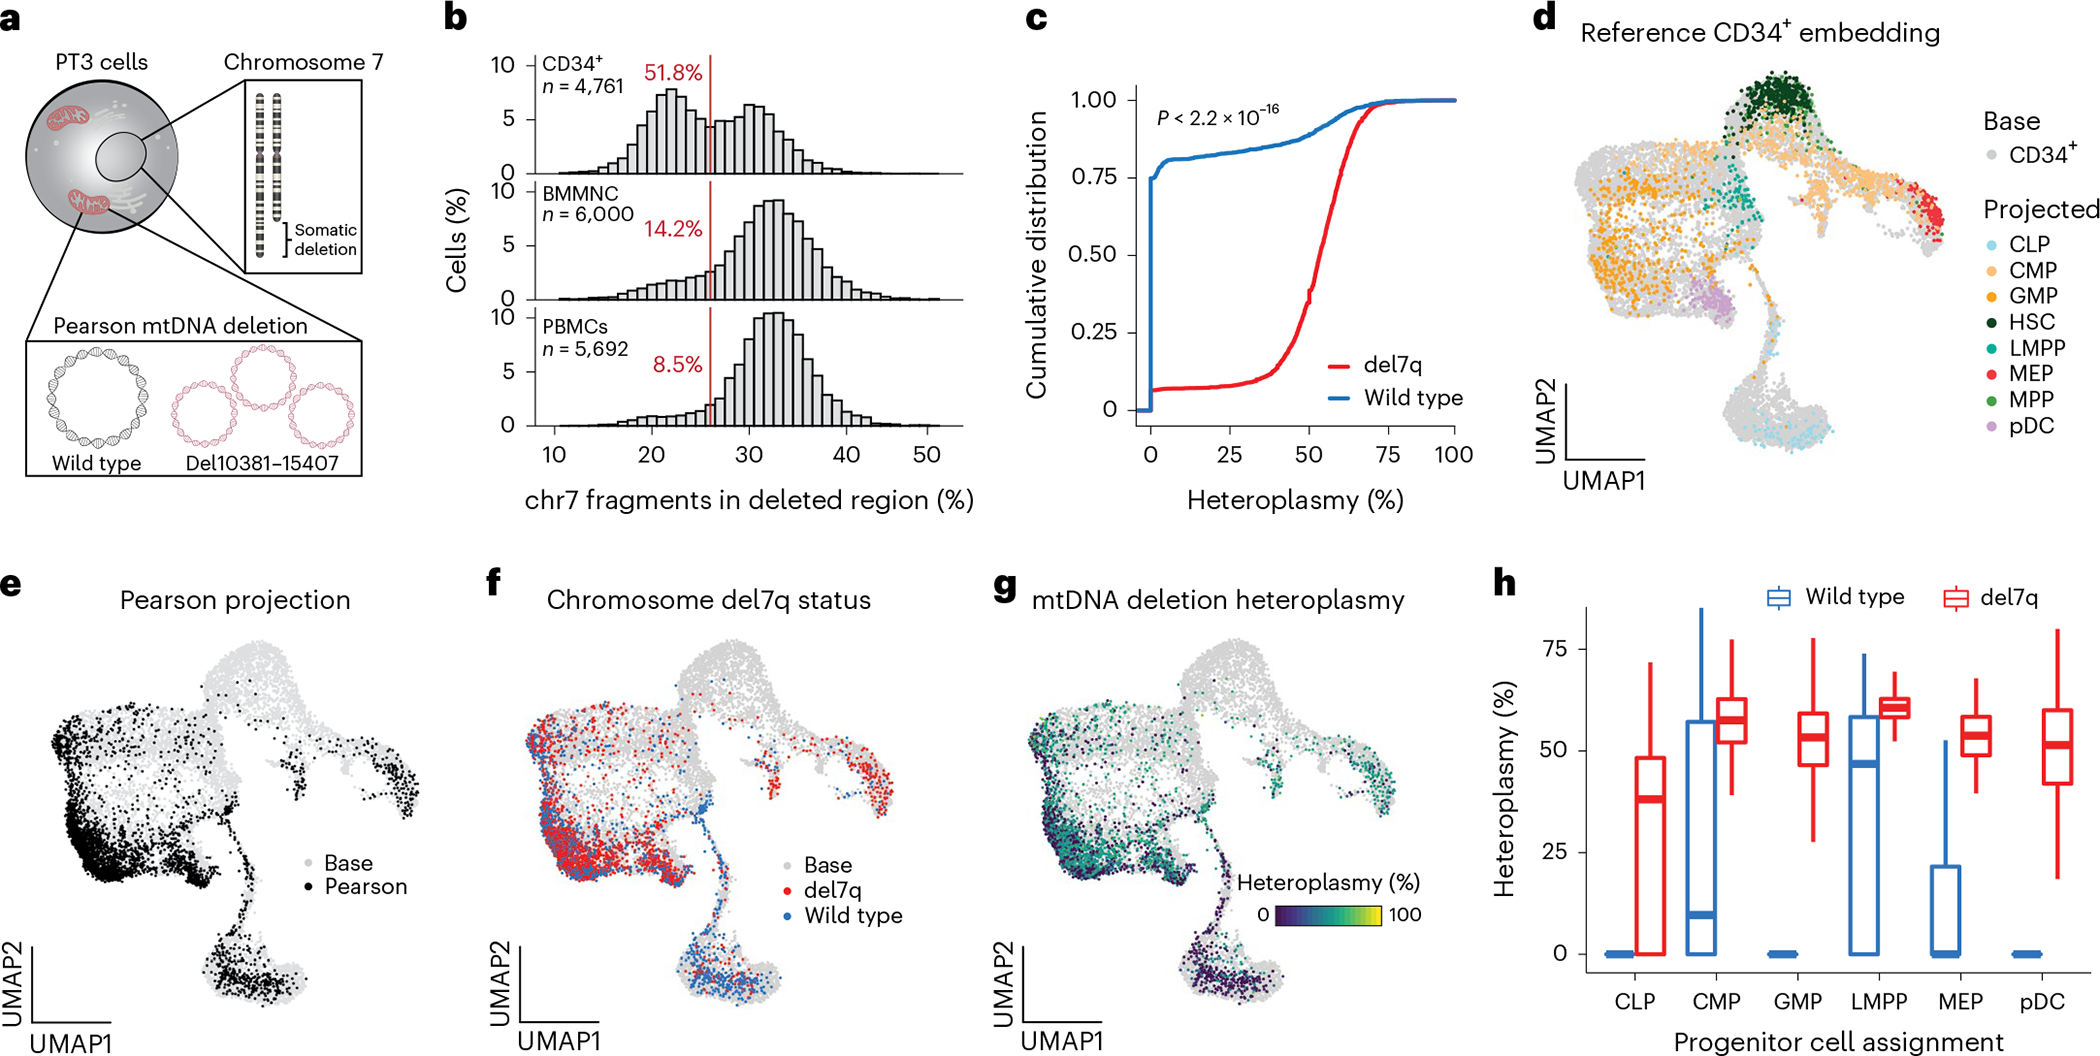
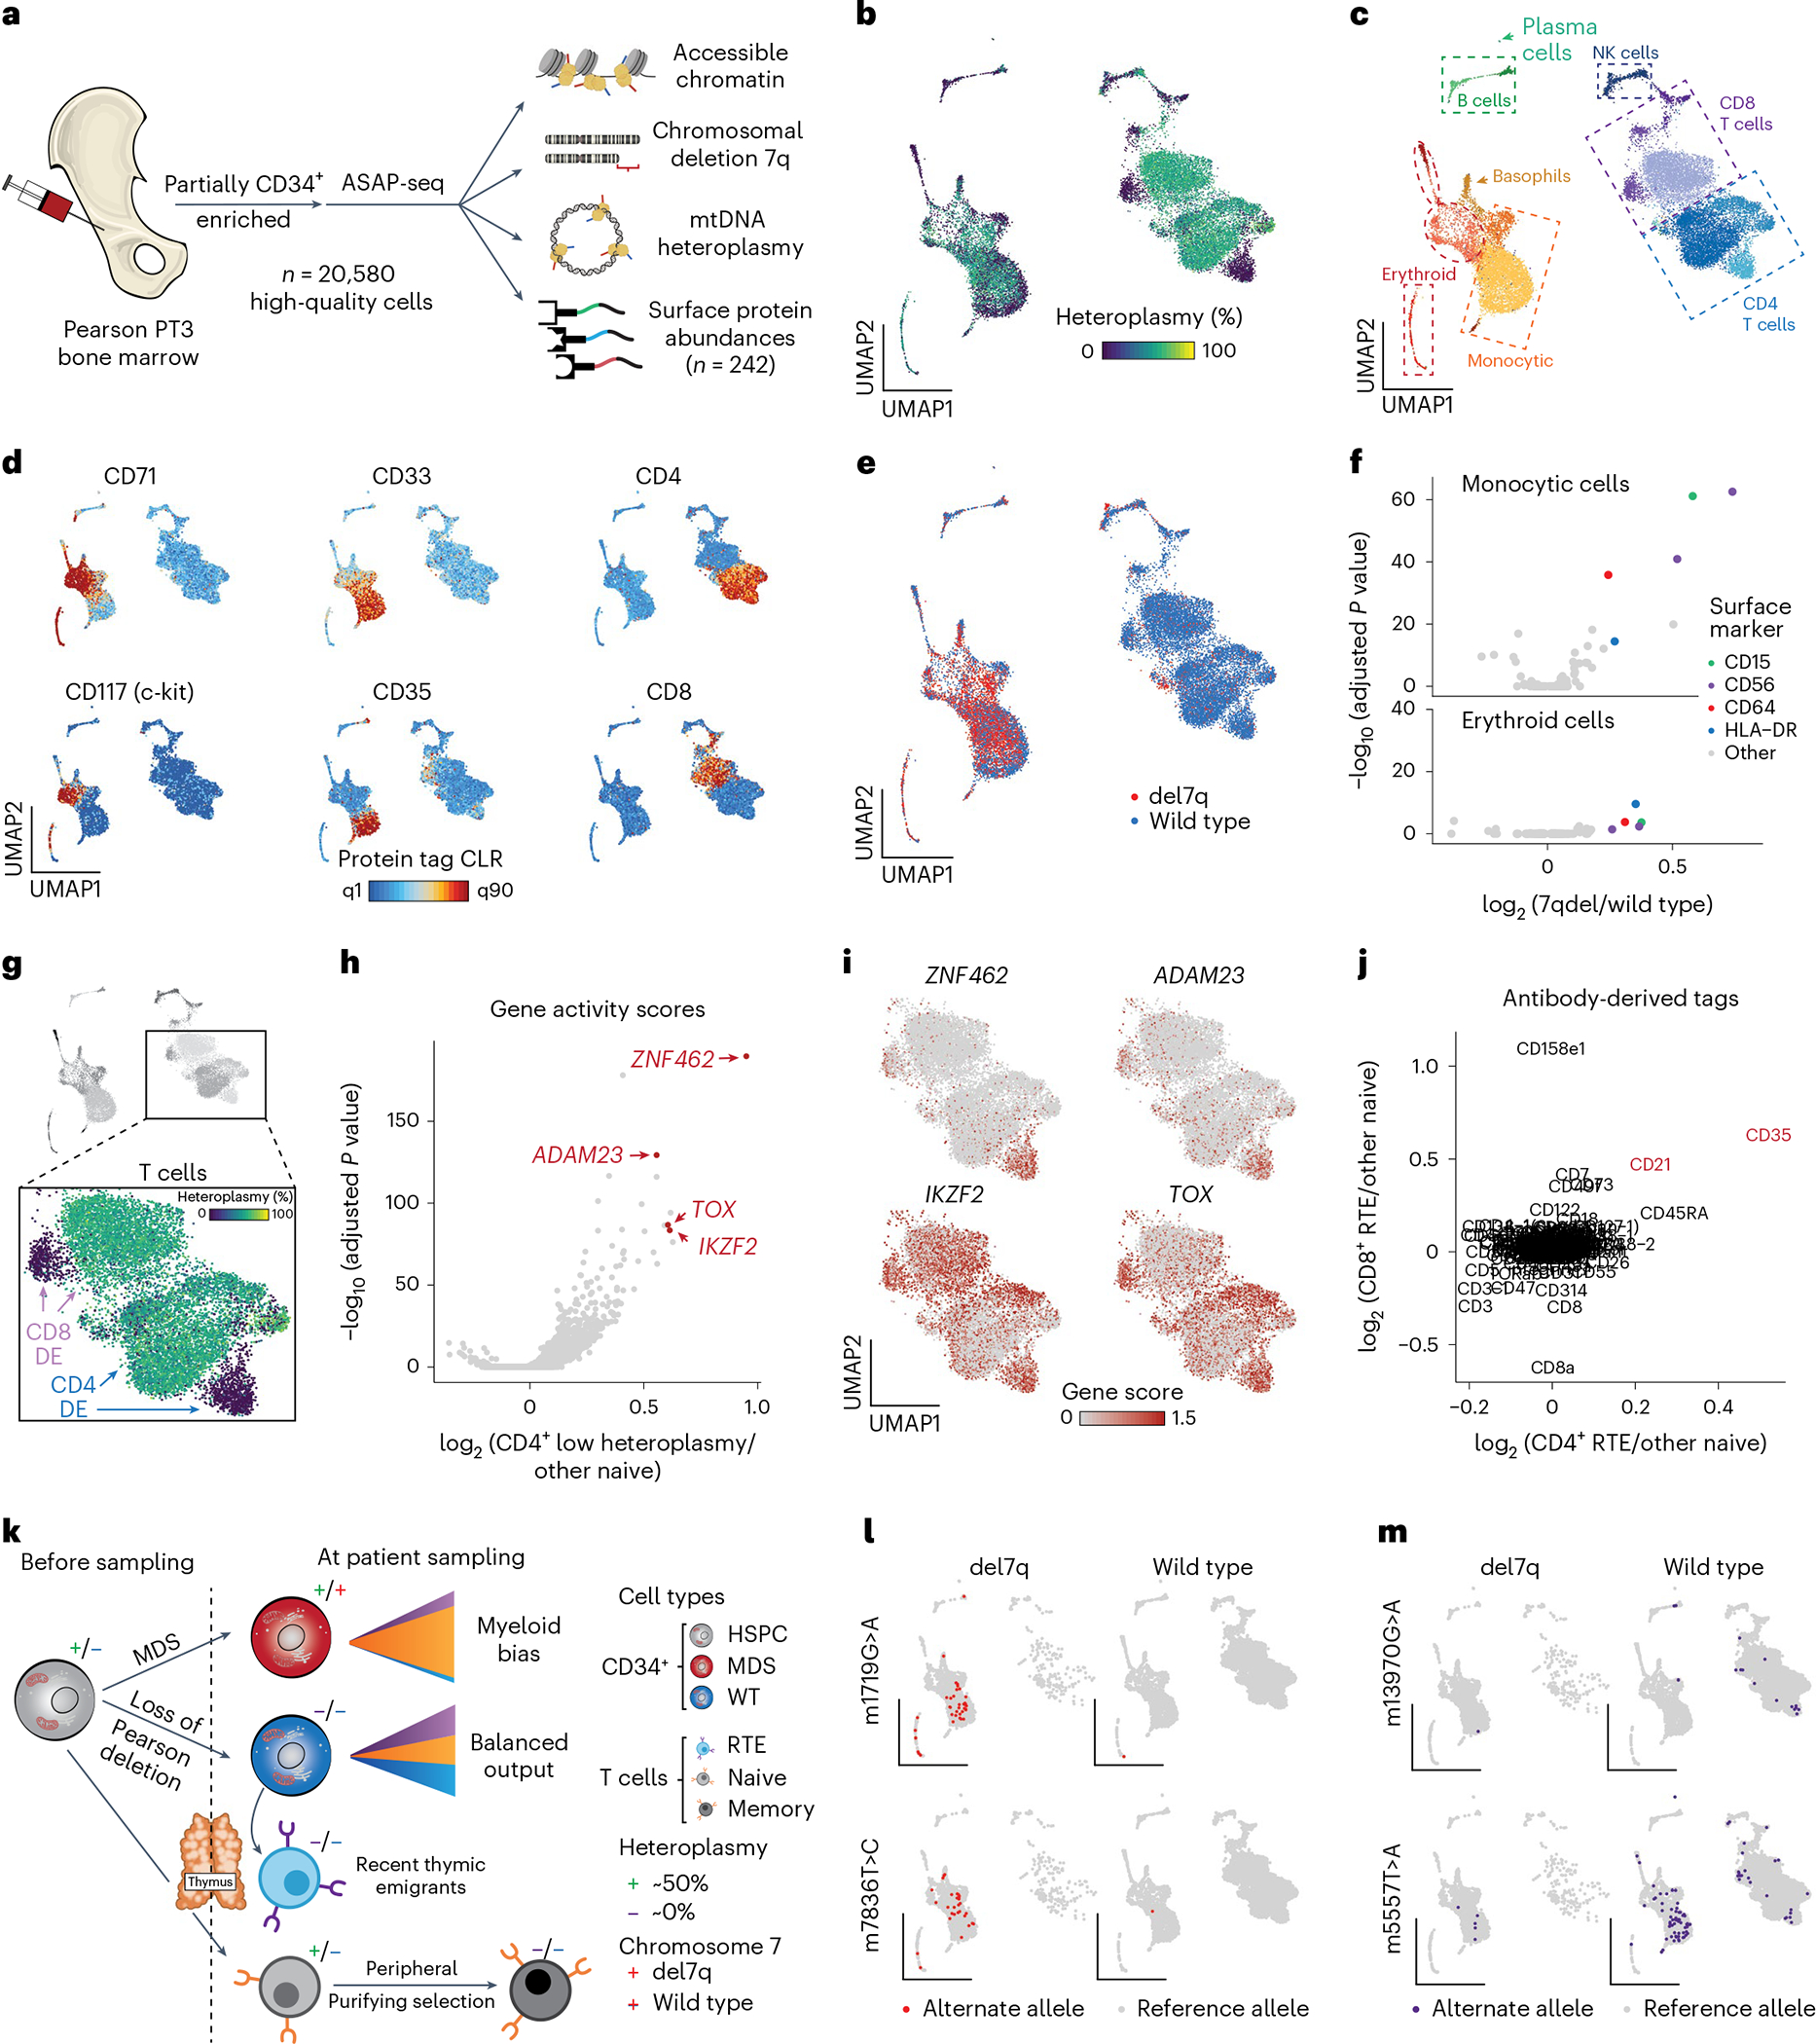
Pathogenic mutations in mitochondrial DNA (mtDNA) compromise cellular metabolism, contributing to cellular heterogeneity and disease. Diverse mutations are associated with diverse clinical phenotypes, suggesting distinct organ- and cell-type-specific metabolic vulnerabilities. Here we establish a multi-omics approach to quantify deletions in mtDNA alongside cell state features in single cells derived from six patients across the phenotypic spectrum of single large-scale mtDNA deletions (SLSMDs). By profiling 206,663 cells, we reveal the dynamics of pathogenic mtDNA deletion heteroplasmy consistent with purifying selection and distinct metabolic vulnerabilities across T-cell states in vivo and validate these observations in vitro. By extending analyses to hematopoietic and erythroid progenitors, we reveal mtDNA dynamics and cell-type-specific gene regulatory adaptations, demonstrating the context-dependence of perturbing mitochondrial genomic integrity. Collectively, we report pathogenic mtDNA heteroplasmy dynamics of individual blood and immune cells across lineages, demonstrating the power of single-cell multi-omics for revealing fundamental properties of mitochondrial genetics.


Conflict of interest statement

Competing interests

The Broad Institute has filed for a patent relating to the use of the technology described in this paper where C.A.L., L.S.L., C.M., A.R. and V.G.S. are named inventors (US provisional patent application 62/683,502). C.A.L. and L.S.L. are consultants to Cartography Biosciences. ATS is a founder of Immunai and Cartography Biosciences and receives research funding from Allogene Therapeutics and Merck Research Laboratories. A.R. is a founder and equity holder of Celsius Therapeutics, an equity holder in Immunitas Therapeutics, and until August 31, 2020, was an SAB member of Syros Pharmaceuticals, Neogene Therapeutics, Asimov and ThermoFisher Scientific. Since August 1, 2020, A.R. has been an employee of Genentech. V.G.S. serves as an advisor to and/or has equity in Branch Biosciences, Novartis, Forma, Cellarity and Ensoma. S.A.V. is an advisor to Immunai and has provided consulting services to Koch Disruptive Technologies and ADC Therapeutics. The remaining authors declare no competing interests.

Figures

Extended Data Fig. 1 |
Extended Data Fig. 1 |. Deletion and heteroplasmy estimation using mgatk-del.
(a) Schematic of mgatk-del pipeline, which utilizes the outputs of CellRanger-ATAC. Two critical steps of base-resolution deletion calling (‘find’) and estimation of single-cell heteroplasmy (‘quantify’) are illustrated. (b) Output of mgatk-del ‘find’ for Pearson syndrome deletion 1 (PS1). The red vertical lines represent the called deletion breakpoints where the regions were joined (blue arc) via a secondary alignment (‘SA’ tag in.bam file). (c) Schematic of the simulation framework. Synthetic cells with known heteroplasmy were generated via mixtures of reference and PS mtDNA for all previously reported deletions. (d) Summary of results from a 50% mix showing the heteroplasmy as estimated from the ratio of clipped to unclipped reads. Parameters ‘innerparam’ and ‘outer-param’ define the number of bases that are discarded on the read when estimating the overall heteroplasmy per cell. (e) Results of exhaustive simulation for three mtDNA deletions used in the cell mixing experiment. The minimum value of the root mean squared error (RMSE) of the estimated and true heteroplasmy is noted with an asterisk over the grid search. (f) Difference in mean estimated heteroplasmy (RMSE) in optimal and default parameters across a variety of settings indicating the stability. (g) Decomposition of variance using a permuted model. Black shows the observed variance whereas green shows the spread under a permuted (null) model. The percent of the variance explained by this null model is shown. (h) Single-cell correlation of clipped (Fig. 1d) versus coverage-based (Fig. 1e) heteroplasmy estimates for valid deletions per indicated deletion/donor. The Pearson correlation for the three deletions is indicated. (i) % of cells with non-zero heteroplasmy for different deletions at different coverages using indicated methods. The left panel assesses sensitivity where the true proportion of cells with the deletion is 100%. The right panel assesses specificity where the true proportion of cells with the deletion is 0%. For both plots, detection of the deletion requires ≥1% heteroplasmy. ( j) The mean absolute error in heteroplasmy at 50x coverage is indicated by the value shown on the graph for two methods of heteroplasmy estimation, as in (i).
Extended Data Fig. 2 |
Extended Data Fig. 2 |. Supporting information for PS PBMC mtscATAC-seq analyses.
(a) Result of mgatk-del hyperparameter optimization via a simulation framework. The minimum value of the root mean squared error (RMSE) of the estimated and true heteroplasmy is noted with an asterisk over the grid search. (b) Summary of % of cells with 0% heteroplasmy across all hematopoietic cells for the three PS donors. (c) Violin plots of each respective mtDNA deletion for all three patients in selected T cell populations. Black indicates the observed data. Gray represents heteroplasmy under a null model of one mean and the variation attributed to differences in coverage per cell. CD8.TEM and MAIT cells have a bimodal distribution (indicating purifying selection) whereas CD8+ naive cells have a distribution that is more consistent with a single mode of heteroplasmy. The percentage of cells with 0% heteroplasmy under observed and null settings are noted for each population below the violins. (d) UMAP visualization of MELAS bridge reference projection across three donors previously reported. (e) Summary of % of cells with 0% heteroplasmy across all hematopoietic cells for the three MELAS donors with refined cell type annotations from the bridge reference projection.
Extended Data Fig. 3 |
Extended Data Fig. 3 |. Supporting analyses for primary PS T cell cultures.
(a) Representative flow cytometry plot of CD4+ and CD8+ T cells. Cells from the four donors (columns) were assessed for CD45RA and CD45RO expression. The box indicates the proportion of CD45RAhi/CD45RO cells summarized in Fig. 3d. (b) Summary of flow cytometry data from independent T cell culture comparing cells from a healthy pediatric donor to an adult donor. T cells were derived from both bone marrow mononuclear cells (BMMNCs) and peripheral blood mononuclear cells (PBMCs) for the pediatric donor. (c) Embedding of day 14T cells colored by antibody derived tags (ADTs) for CCR4 and IL2RA. (d) Dynamics of heteroplasmy for 76 heteroplasmic single nucleotide variants (SNVs) during T cell culture. m.12631T > C and m.4225A > G are highlighted. (e) Single-cell heteroplasmy of m.12631T > C and m.4225A > G, variants expanding during T cell culture, annotated in the day 14 embedding. Blue arrow indicates the subpopulation positive for the m.4225A > G variant. (f) Single-cell heteroplasmy of the PS deletion annotated on day 21 derived T cells profiled via mtscATAC-seq. (g) Single-cell heteroplasmy of m.12631T > C and m.4225A > G, variants expanding during T cell culture, annotated in the day 21 cell embedding. Blue arrow indicates the subpopulation positive for the m.4225A > G variant. (h) Day 21 embedding clustering, annotations, and per-cluster heteroplasmy quantified via a cumulative distribution function. (i) Independent validation of in vitro CD8+ T cell relative expansion (left) and overall T cell proliferation (right) defects from PT1 PBMCs. ( j) Summary of cell clusters, heteroplasmy, and marker gene scores for PT1 T cells following culture. (k) Day 14 PT1 per-cluster heteroplasmy quantified via a cumulative distribution function for PT1 T cells after culture.
Extended Data Fig. 4 |
Extended Data Fig. 4 |. Supporting information for del7q calling and CD34+ mtscATAC-seq analyses.
(a) Flow cytometry gating strategy for the sorting of live CD66bCD34+ bone marrow mononuclear cells. (b) Summary of 7q fragment abundances in healthy CD34+ and PBMC mtscATAC-seq samples; compare to Fig. 4b with the same cutoff. (c) Result of Gaussian mixture model applied to indicated samples. The red trace indicates the first mixture component estimated (lower mean) whereas the blue trace represents the second component with a higher mean. The healthy PBMC sample does not contain a chromosome alteration. (d) Graphical density of cells from mixture model (y-axis) and from crude fragment abundance (x-axis; see Fig. 4b). The dotted line indicates the cutoff for wild type and del7q annotations. (e) Histograms of mtDNA deletion heteroplasmy proportions (%) stratified on del7q status. (f) Projection of a healthy control CD34+ mtscATAC-seq sample onto the reference embedding as shown in Fig. 5d. (g) Stacked bar plots of cell type proportions for projected cell types from PT3 with PS/MDS stratified by del7q status (MDS for positive and wild type for negative) and a healthy control donor. (h) Annotation of del7q status in PBMCs, which is primarily identified in myeloid, NK, and B-cell populations; see Fig. 2d for cluster annotations.
Extended Data Fig. 5 |
Extended Data Fig. 5 |. Supporting analyses for PT3 bone marrow mononuclear cell ASAP-seq dataset.
(a) Projection of select protein-derived antibody tag abundances for indicated proteins. Select arrows indicate populations positive for the respective marker. UMAP coordinates same as Fig. 6c. (b) Projection of protein surface markers CD56 (NK cells and MDS-associated cells) and CD335 (only NK cells) with arrows indicating the two cell populations. (c) UMAP of ASAP-seq processed bone marrow mononuclear cells from a PS (top) and a healthy control (bottom) with hematopoietic stem and progenitor cells (‘progenitors’) indicated in the red boxes. (d) Projection of protein tags within the boxed progenitor populations as in (c), contrasting the presence of only CD71+ cells among CD34+/c-Kit+ cells in PS as compared to the healthy control. (e) Volcano plot showing differential gene activity scores for CD8 recent thymic emigrants (RTEs) compared to other CD8 naive T cells. Annotated genes in red represent known marker genes for RTEs. (f) Zoom (top) and mtDNA deletion heteroplasmy (bottom) in differentiated CD8 T and NK cells from the BMMNC populations. (g) Volcano plot illustrating the association between protein levels and mtDNA deletion heteroplasmy in single cells. P-values were computed from the default two-sided Seurat Wilcoxon test with Bonferroni p-value adjustment. (h) Projection of cell state surface markers (CD3, CD8) and top antibody tags (CD16, CD195) as determined in (g). (i,j) Reclustering and UMAP depiction of PT3 PBMC mtscATAC-seq data identify (i) low heteroplasmy and ( j) recent thymic emigrants (RTEs). Cell type annotations as indicated. (k) Landscape of 69 heteroplasmic somatic mtDNA mutations identified in BMMNC. Statistical test: two-sided Fisher’s exact test. (l) Substitution rate of mgatk identified heteroplasmic mutations (y-axis) in each class of mononucleotide and trinucleotide change resolved by the heavy (H) and light (L) strands of the mitochondrial genome. (m) Scatter plot of 69 somatic mtDNA variants identified in panel (l) stratified based on cells annotated as del7q (x-axis) and wild type for chr7 (y-axis). (n) Projection of wild type (diploid chr7)-enriched somatic mtDNA mutations m.14476G > A (50%) and m.12242A > G (25%).
Extended Data Fig. 6 |
Extended Data Fig. 6 |. Supporting information for in vitro erythroid differentiation experiments.
(a) Reference embedding of bone marrow mononuclear cell CITE-seq reference dataset (left) with gene module scores for selected pathways annotated on the UMAP embedding. (b) Flow cytometry gating scheme used for sorting of in vitro differentiated healthy control and PS cells, related to Fig. 7. (c) Flow cytometry plots showing the distribution of CD71 and CD235a surface marker expression of in vitro differentiated healthy control and PS cells at indicated days of culture. (d) MayGrunwald Giemsa stained cytospins of in vitro differentiated healthy control and PS cells at day 8 of culture at 63x magnification. (e) UMAP of scRNA-seq data colored by predicted cell cycle state. Cluster annotations as in Fig. 7e–g. (f) Comparison of differential gene expression between PT3 donor cells with MDS (x-axis) and without MDS (y-axis) related to healthy control. The Pearson correlation between all genes is annotated (0.82). Genes from relevant pathways or genomic annotations are highlighted in specific colors. (g-i) Projection of gene expression of selected differentially expressed genes between PS and healthy control erythroblasts, including (g) PHGDH, (h) CPOX, and (i) HEBP2. Gene expression coloring is scaled for all plots between the first and 99th quantile per gene.
Fig. 1 |
Fig. 1 |. Identification and quantification of heteroplasmic pathogenic mtDNA deletions in single cells.
a, Schematic of mtDNA in humans with PS-related deletions relevant for the cell lines examined in b. OH and OL represent the heavy and light chain origins of replication, respectively. PS1, PS2 and PS3 represent three different mtDNA deletions identified in three independent donors from which the cell lines were derived. Size and location of deletions are indicated. b, Summary of cell line mixing experiment and demultiplexing using mtDNA haplotype-derived SNVs in single cells. Heatmap depicts homoplasmic SNVs that facilitate the separation of cells from distinct donors. c, Mean coverage plots per cell across the mitochondrial genome for the demultiplexed donor cell identities. Drops in the coverage are indicative of large mtDNA deletions. d,e, Estimates of single-cell heteroplasmy using (d) clipped-read enumeration and (e) coverage-based approaches. Red dots represent false-positive heteroplasmy assessments from the deletion/donor pair (‘discordant’). Each dot represents estimated heteroplasmy from a single cell for each respective deletion. C1, C2 = Control 1 and Control 2 as in b and c.
Fig. 2 |
Fig. 2 |. Purifying selection against pathogenic mtDNA deletions in peripheral blood MAIT and CD8 T cells in PS.
a, Schematic of single-cell genomics data generation. PBMCs from three patients (PT1, PT2 and PT3) with PS were collected and processed via scRNA-seq and mtscATAC-seq. b, Depiction of mtDNA deletions from three investigated patients with PS as determined by mgatkdel. Location and size of deletions are indicated. c, Violin plots of single-cell heteroplasmy across indicated patients and respective mtDNA deletions are indicated in b. Median heteroplasmy (%) and profiled cell numbers are indicated for each patient. d, Reduced dimensionality projection and joint clustering of PBMCs from three patients with PS and one healthy control are shown. Major cell types and clusters are annotated in the same color. e, Reduced dimensionality projection as in d split by patient with PS and colored by respective mtDNA deletion heteroplasmy. f–h, Cumulative distribution plots of heteroplasmy stratified by T-cell subset derived from PT1, PT2 and PT3. Each comparison is a two-sided binomial test for the proportion of 0% cells comparing CD4.TCM to CD4 naive, CD8.TEM to CD8 naive and MAIT to other T-cell subsets. i,j, Purifying selection of the m.3243A>G allele in individuals with MELAS as previously reported. The cell annotations and statistical tests are the same as in f–h but for the m.3243A>G allele. k, A refined model of purifying selection in T cells with the relative ordering of cells based on the proportion and frequency of 0% heteroplasmic cells observed in these donors between the two disease cohorts. DC, dendritic cells; pDCs, plasmacytoid dendritic cells; NK, natural killer cells.
Fig. 3 |
Fig. 3 |. Altered CD8+ T cell expansion and purifying selection of pathogenic mtDNA deletions in vitro.
a, Schematic of experimental design. PBMC-derived T cells were cultured and activated via α-CD3 and α-CD28 for ~3 weeks. ASAP-seq and flow cytometry measures were collected longitudinally. b, Fold expansion for all cells in culture for the healthy donors (blue) compared to the Pearson donor (red). c, Dynamics of CD8+ to CD4+ T-cell ratios in culture over time, implicating deficient CD8+ expansion of PS cells. d, Percentage of CD45RAhi/CD45RO among CD4+ (left) and CD8+ (right) cells from the four donors over 12 d. e, Per-sample distribution of heteroplasmy of T cells from PBMCs, after 14 d in culture, and after 21 d in culture demonstrating most selection to have occurred by day 14 of culture relative to PBMCs. f, Day 14 ASAP-seq embedding annotated by heteroplasmy (%). g, The same embedding in f but colored by ADTs for CD45RA, CD8 and CD4, allowing for annotation of cluster-specific cell states. h, Cell state clusters of the day 14 ASAP-seq embedding. Per-cluster heteroplasmy is depicted via a continuous distribution plot. i, Schematic of in vitro culture experiment with and without 1 mM pyruvate and 200 nM uridine (P&U) supplementation. j, Cell trace violet plots showing cell division traces of a healthy donor and three donors with PS stratified by CD4+ or CD8+ T cells. k, All comparisons between none and P&U were not significantly different at an α value of 0.05 using a Student’s paired t-test.
Fig. 4 |
Fig. 4 |. Purifying selection and retention of pathogenic mtDNA heteroplasmy across the peripheral blood in adults with SLSMD.
a, Three donors with either KSS or CPEO were profiled using mtscATAC-seq. b, Pseudobulk coverage of three donors across the mtDNA genome. c, Results of deletion calling from mgatk-del find. Each dot represents a pair of junctions. The junction pair marked in red represents the pathogenic deletion. d, Validation of deletions in cells from pseudobulk coverage estimates in cells with nonzero heteroplasmy. The coordinates of the deletions are noted in the miniature diagrams of the mtDNA deletions. eg, Reference projection of cell states from mtscATAC-seq (as in Fig. 2d) with heteroplasmy annotated for the indicated mtDNA deletions. The red arrow points to the memory CD4+ T-cell compartment. Only a single cell harbored the deletion for the patient with CPEO (heteroplasmy = 68.8%; 11 reads supporting the deletion; 5 reads supporting wild-type mtDNA). h, Schematic of the lifetime dynamics of purifying selection against pathogenic mtDNA across PS (as in Fig. 2k) and other SLSMDs.
Fig. 5 |
Fig. 5 |. Myelodysplastic cells resolved by a chromosomal 7q deletion in CD34+ HSPCs in a case of PS.
a, Schematic depicting the del7q and mtDNA deletion of PT3 in the same cell. b, Histograms showing the percentage of fragments on chromosome 7 mapping to the somatically deleted region. A consistent cutoff of 26% with the percentage of cells below this threshold is indicated in red. n, cells assayed for each indicated population of CD34+, BMMNC and PBMCs. c, Cumulative distribution curves of mtDNA heteroplasmy stratified by the del7q status per cell. Statistical test—two-sided Kolmogorov–Smirnov test. d, UMAP of a reference CD34+-based embedding (base; gray) with sorted cell populations projected (color coded) onto the reference. All cells were derived from healthy donors. CLP, common lymphoid progenitor; CMP, common myeloid progenitor; GMP, granulocyte–monocyte progenitors; HSC, hematopoietic stem cell; LMPP, lymphoid primed multipotent progenitor; MEP, megakaryocyte erythroid progenitor; MPP, multipotent progenitor; pDC, plasmacytoid dendritic cell. e, Projection of PS CD34+ cells onto the same base embedding as in d. f, Annotation of del7q status for each PS CD34+ cell, indicating diploid (blue) and del7q (red) status. g, Annotation of single-cell mtDNA deletion heteroplasmy per PS CD34+ cell. h, Heteroplasmy (%) stratified based on annotated CD34+ progenitor cell state and by del7q ploidy status. Data from one biologically independent sample and experiment. Boxplots—center line, median; box limits, first and third quartiles; whiskers, 1.5× interquartile range.
Fig. 6 |
Fig. 6 |. Multimodal characterization of PS BMMNCs with ASAP-seq.
a, Schematic of ASAP-seq experiment from PS BMMNCs derived from PT3 with MDS. b, Dimensionality reduction and embedding for high-quality BMMNCs with heteroplasmy colored. c, The same embedding as in b is annotated by major cell type clusters. d, Selected lineage-defining surface protein markers are shown on the reduced dimension space as in b and c. e, Projection of annotated del7q status onto the UMAP space as in b and c. f, Volcano plots of differentially expressed protein surface markers inferred from antibody barcodes for del7q versus wild-type cells annotated as erythroid or monocytic from c. Markers with distinct colors were significantly upregulated in both comparisons (logFC > 0.1 and Wilcoxon test with Bonferroni correction P < 0.01). g, Schematic illustrating CD4+ and CD8+ T-cell clusters used for differential gene score expression (DE) analyses to identify markers distinguishing low-heteroplasmy cell populations. h, Volcano plot showing differential gene activity scores for comparison of CD4+ T-cell clusters as illustrated in g. Genes in red (ZNF462, ADAM23, IKZF2 and TOX) indicate marker genes for RTEs. i, Projected gene scores for indicated marker genes onto UMAP space as highlighted in g. j, Differentially expressed proteins for the comparisons of CD4+ and CD8+ T-cell populations as illustrated in g. CD21 and CD35, shown in red, are known surface markers for RTEs. A total of three markers (CD21, CD35 and CD45RA) were significantly upregulated in both CD4+ and CD8 T+ RTEs (logFC > 0.1 and Wilcoxon test with Bonferroni correction P < 0.01). k, Schematic of multifaceted clonal output and purifying selection in PT3 with PS and MDS. Major cell transitions are depicted as a function of 7qel status and mtDNA deletion heteroplasmy. l, Projection of somatic mtDNA mutations m.1719G>A and m.7836T>C enriched in cells carrying the del7q. m, Projection of somatic mtDNA mutations m.13970G>A and m.5557T>A enriched in wild-type cells (diploid for chr 7), including in RTEs.
Fig. 7 |
Fig. 7 |. Altered erythroid differentiation and selection in PS.
a, Erythroid pseudotime trajectory of in vivo ASAP-seq data. The color bar represents the annotated pseudotime for 1,511 cells, with the arrow orienting the inferred trajectory for the embedding in Fig. 6c. b, Summary of cell state features along erythroid pseudotime axis. c, Abundance of del7q cells along erythroid pseudotime axis. The mean of each pseudotime bin is noted ±s.e.m. d, Distribution of heteroplasmy across erythroid pseudotime bins. Each cell is plotted in color matching (a) with the per-bin median noted in black. e, Schematic of experimental design. BMMNCs were derived from PT3 with PS/MDS and healthy controls and differentiated toward erythroblasts in vitro. Patient and healthy cells were harvested on day 6 and day 12 and jointly processed via mtscATAC-seq or scRNA-seq. f, Stacked bar graph of cells annotated as wildtype or del7q across indicated cell populations, including at day 6 and day 12 of in vitro culture. g, Same as f but showing the proportion of cells with exactly 0% and >0% heteroplasmy of the mtDNA deletion as determined by mgatk-del. h, Cumulative distribution graphs of mtDNA deletion heteroplasmy across the indicated four cell populations. ik, UMAP embedding of 28,783 high-quality cells profiled via scRNA-seq annotated by (i) day of culture collected, (j) healthy or disease state and (k) annotated cell state/cluster. l, Rank-sorted differentially expressed genes across erythroid populations. Selected top genes overexpressed and downregulated in PS are annotated. Black dots (n = 6,577) represent statistically significant genes at a Bonferroni-adjusted significance threshold of <0.01. m, Volcano plot of pathway enrichment analysis results via erythroid differential gene expression comparisons of the PS to healthy control cells. Selected top pathways are annotated. The dotted line represents the threshold for consideration at an FDR < 0.1. n, Schematic overview of altered (metabolic) genes and pathways in PS relative to the healthy status. Genes and pathways upregulated in PS are shown in red and when downregulated shown in blue. Note—not all biochemical steps necessarily take place in mitochondria and the schematic has been simplified for illustrative purposes.

Comment in

References

    1. Stewart JB & Chinnery PF Extreme heterogeneity of human mitochondrial DNA from organelles to populations. Nat. Rev. Genet. 22, 106–118 (2021). - PubMed
    1. Stewart JB & Chinnery PF The dynamics of mitochondrial DNA heteroplasmy: implications for human health and disease. Nat. Rev. Genet. 16, 530–542 (2015). - PubMed
    1. Wallace DC & Chalkia D Mitochondrial DNA genetics and the heteroplasmy conundrum in evolution and disease. Cold Spring Harb. Perspect. Biol. 5, a021220 (2013). - PMC - PubMed
    1. Gorelick G AN et al. Respiratory complex and tissue lineage drive recurrent mutations in tumour mtDNA. Nat Metab. 3, 558–570 (2021). - PMC - PubMed
    1. Smith ALM et al. Age-associated mitochondrial DNA mutations cause metabolic remodeling that contributes to accelerated intestinal tumorigenesis. Nat. Cancer 1, 976–989 (2020). - PMC - PubMed

Publication types

Substances