. 2023 Jul;55(7):1149-1163.
doi: 10.1038/s41588-023-01424-9. Epub 2023 Jun 29.

Noncoding variants alter GATA2 expression in rhombomere 4 motor neurons and cause dominant hereditary congenital facial paresis

Alan P Tenney #  1   2 Silvio Alessandro Di Gioia #  1   2   3 Bryn D Webb #  4   5 Wai-Man Chan  1   2   6 Elke de Boer  7   8 Sarah J Garnai  1   9 Brenda J Barry  1   2   6 Tammy Ray  1 Michael Kosicki  10 Caroline D Robson  11 Zhongyang Zhang  5 Thomas E Collins  1 Alon Gelber  1 Brandon M Pratt  1 Yuko Fujiwara  12 Arushi Varshney  13 Monkol Lek  14 Peter E Warburton  5   15 Carol Van Ryzin  16 Tanya J Lehky  17 Christopher Zalewski  18 Kelly A King  18 Carmen C Brewer  18 Audrey Thurm  19 Joseph Snow  20 Flavia M Facio  21   22 Narisu Narisu  21 Lori L Bonnycastle  21 Amy Swift  21 Peter S Chines  21 Jessica L Bell  23 Suresh Mohan  24 Mary C Whitman  2   23 Sandra E Staffieri  25   26 James E Elder  26 Joseph L Demer  27 Alcy Torres  1   28 Elza Rachid  29 Christiane Al-Haddad  29 Rose-Mary Boustany  30 David A Mackey  31 Angela F Brady  32 María Fenollar-Cortés  33 Melanie Fradin  34 Tjitske Kleefstra  7   8   35 George W Padberg  36 Salmo Raskin  37 Mario Teruo Sato  38 Stuart H Orkin  6   12 Stephen C J Parker  13 Tessa A Hadlock  24 Lisenka E L M Vissers  7   8 Hans van Bokhoven  7   8 Ethylin Wang Jabs  5   39   40 Francis S Collins  21 Len A Pennacchio  10 Irini Manoli  16 Elizabeth C Engle  41   42   43   44
Affiliations

Noncoding variants alter GATA2 expression in rhombomere 4 motor neurons and cause dominant hereditary congenital facial paresis

Alan P Tenney et al. Nat Genet. 2023 Jul.

Abstract

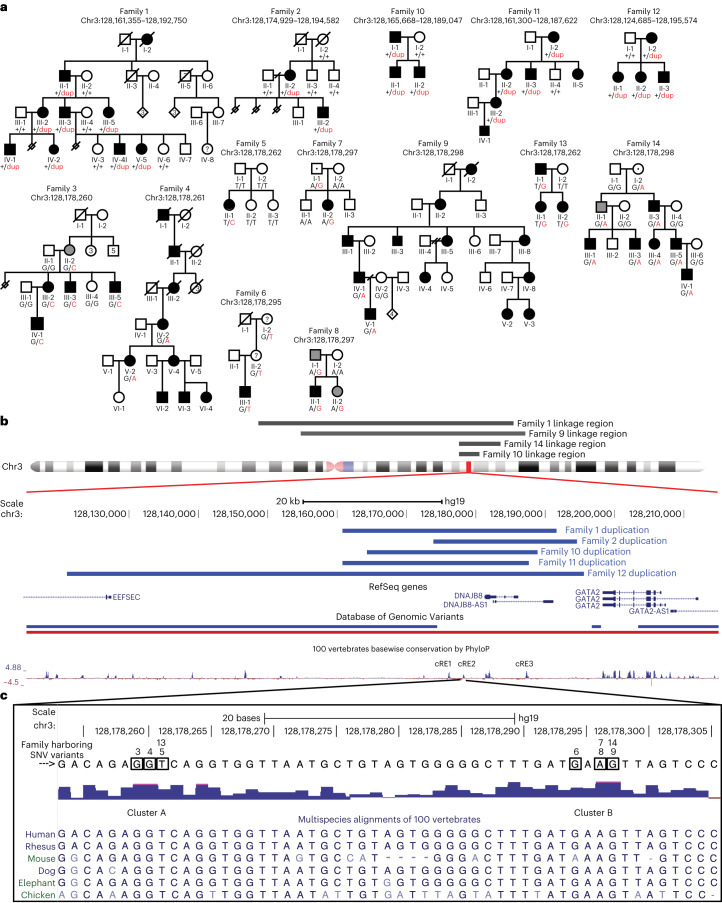
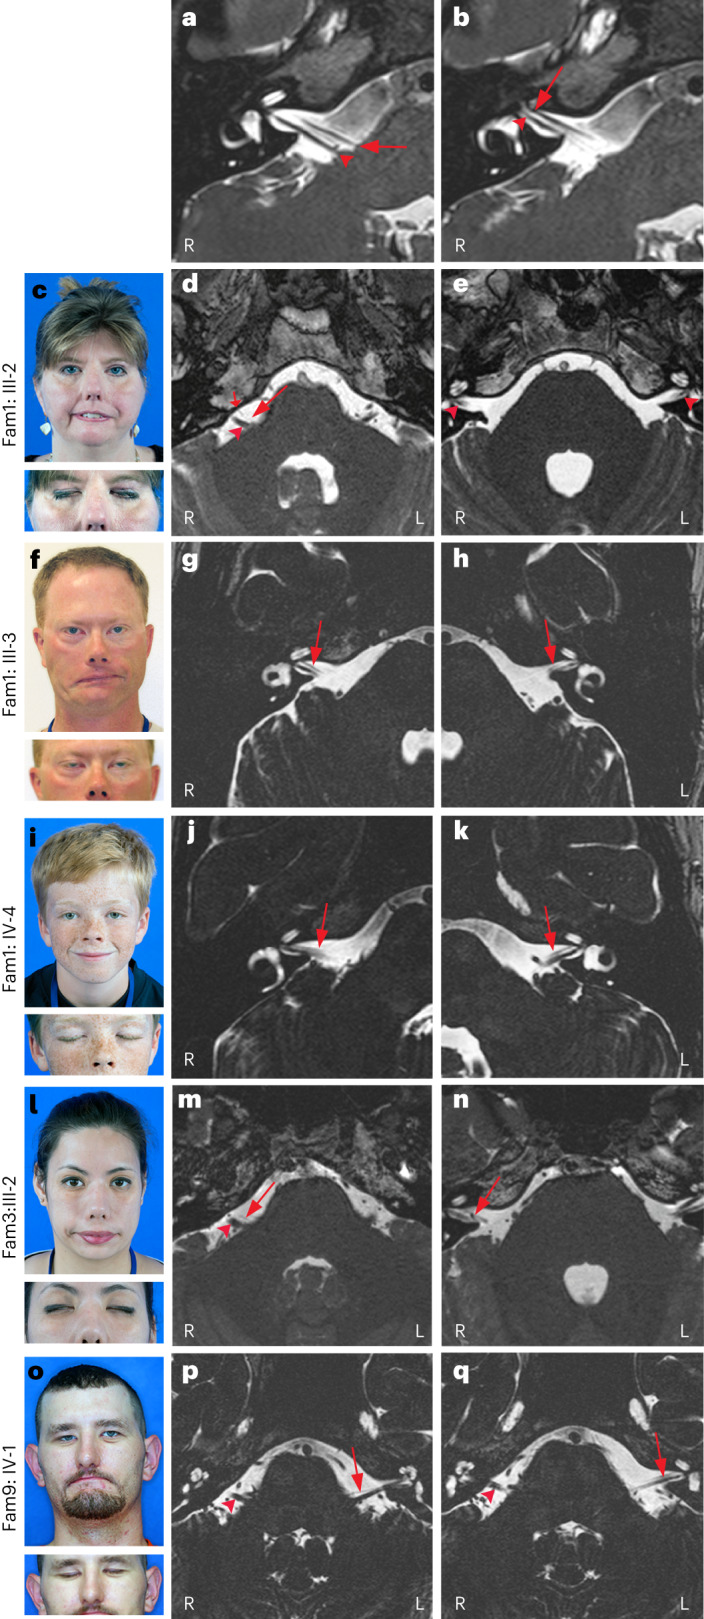
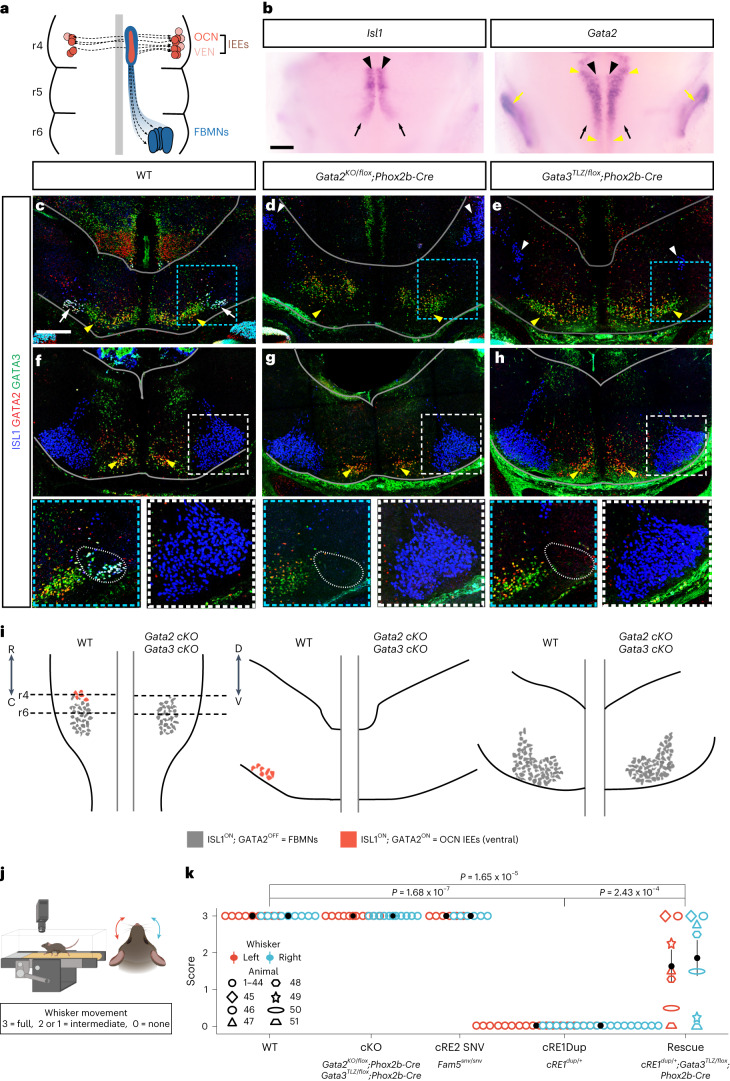
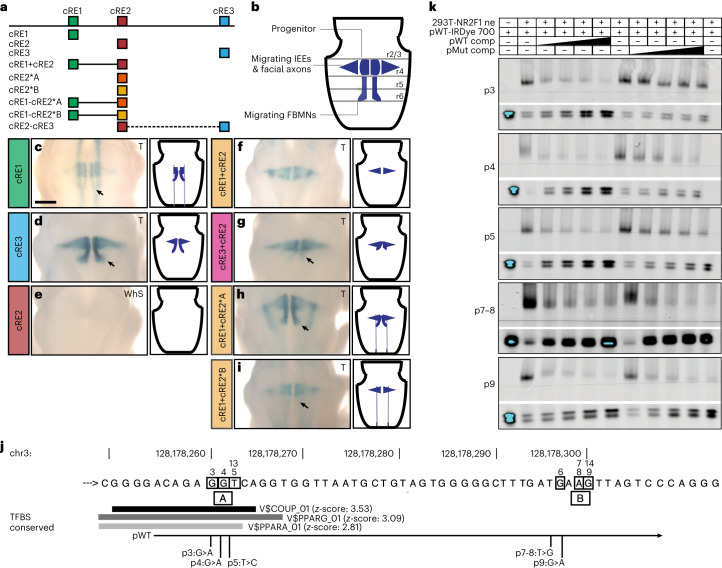
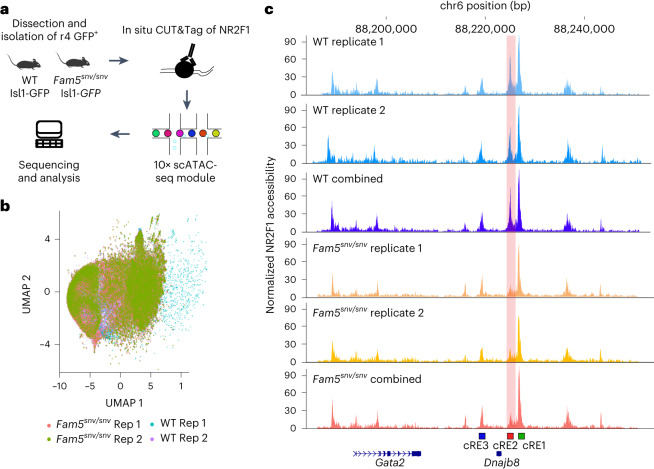
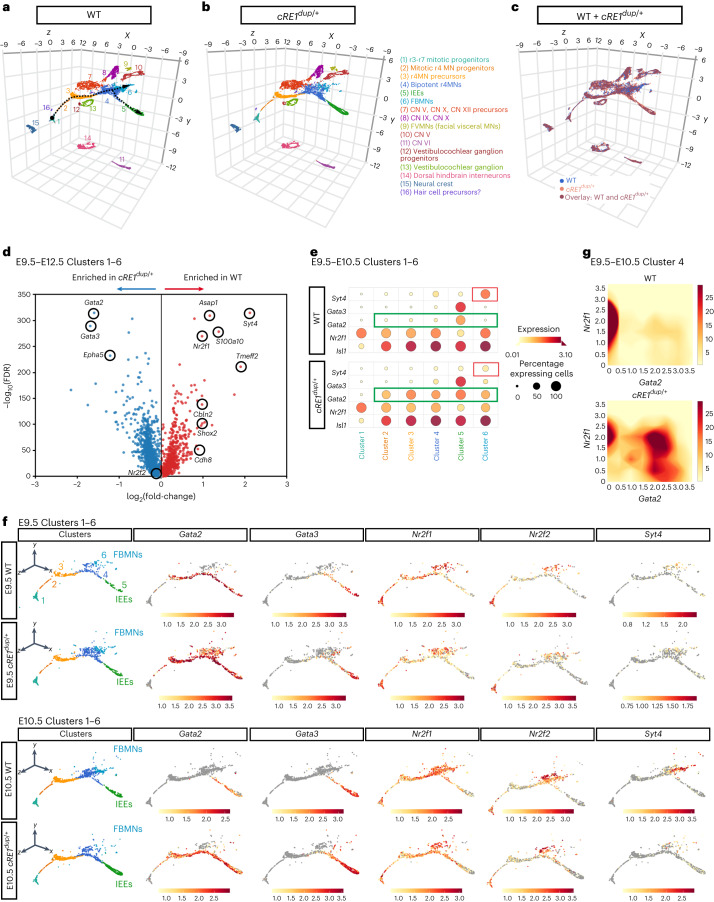
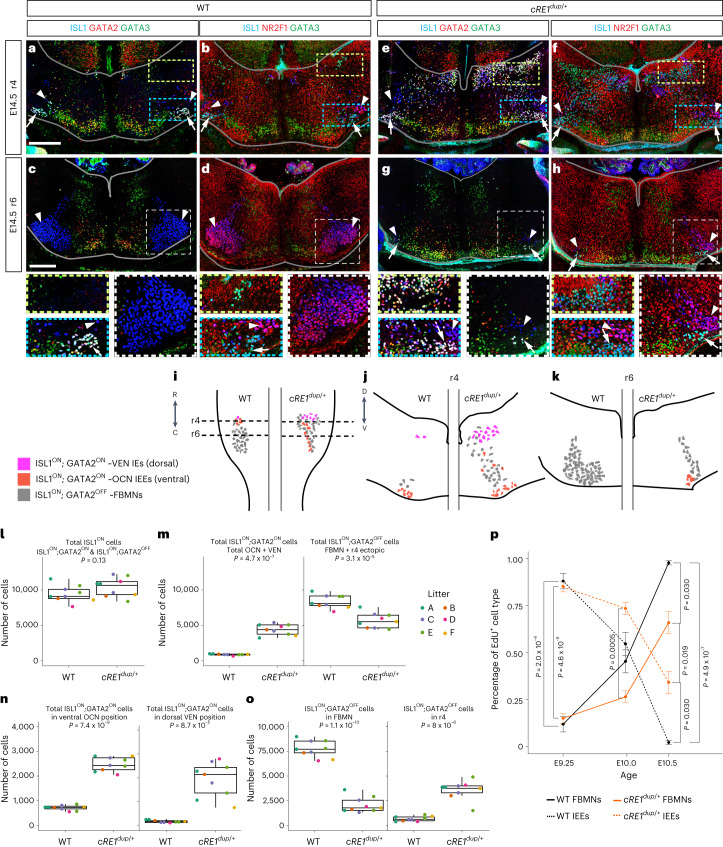
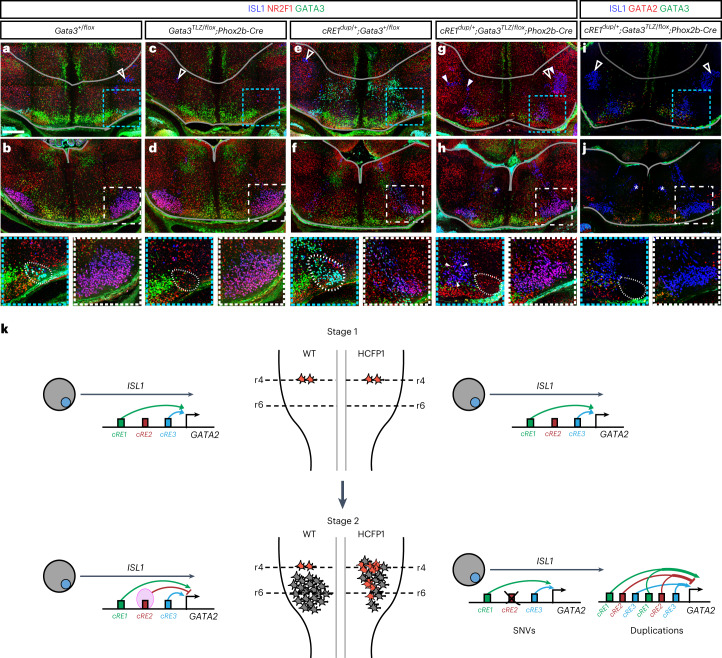
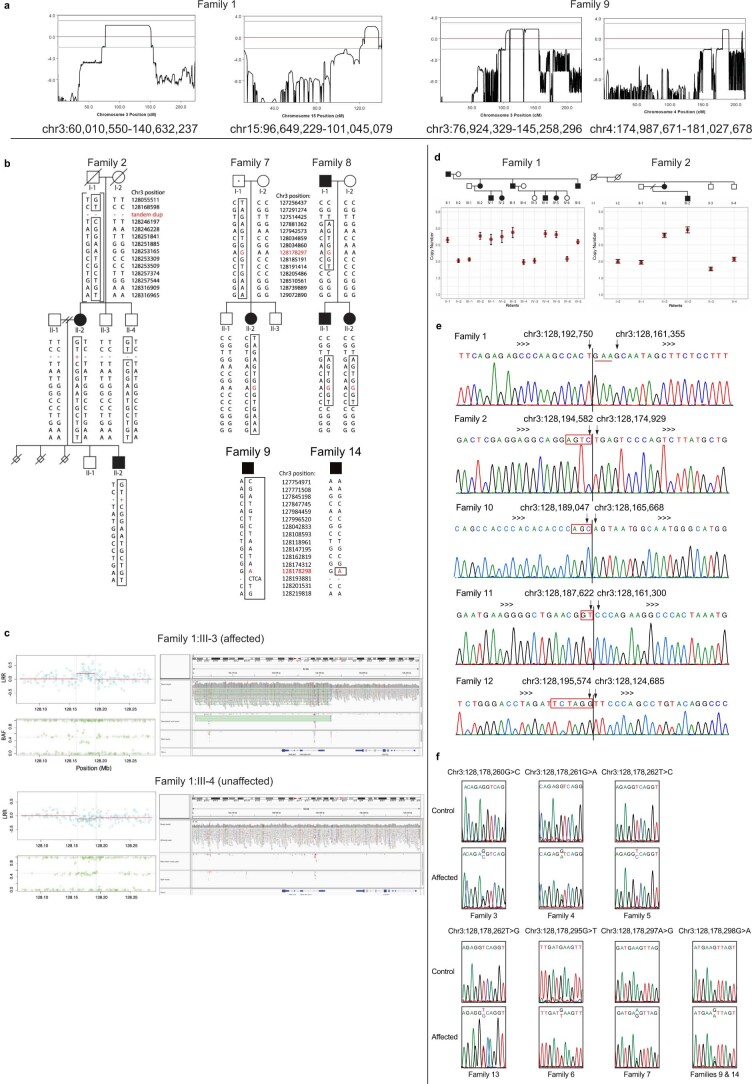
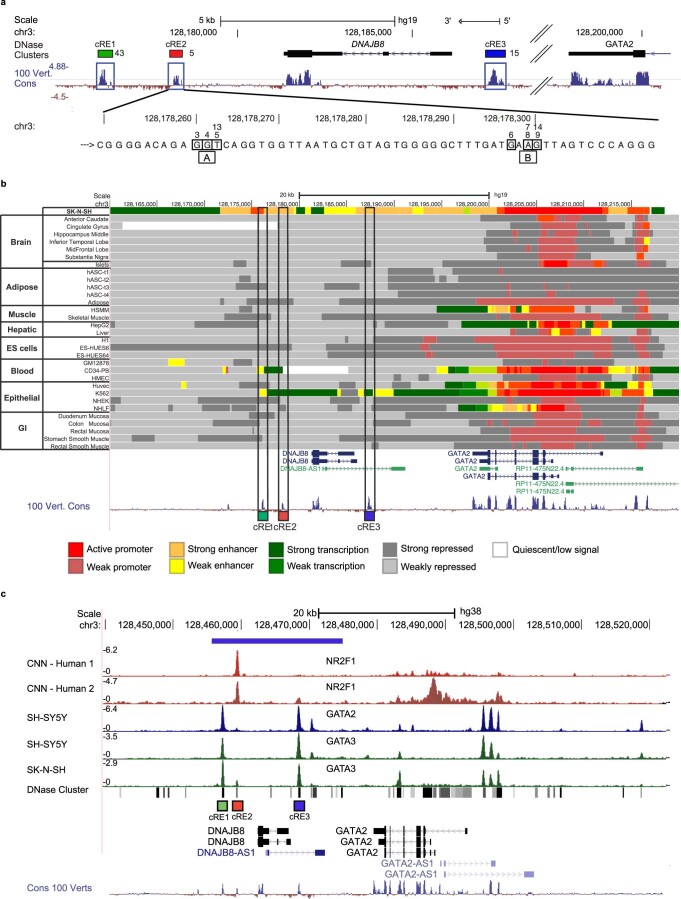
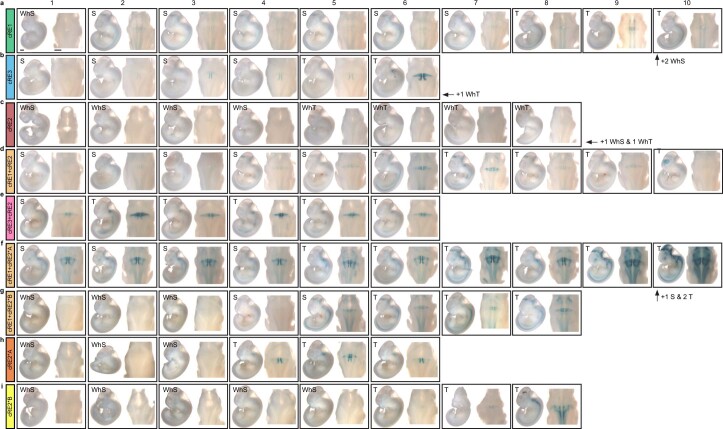
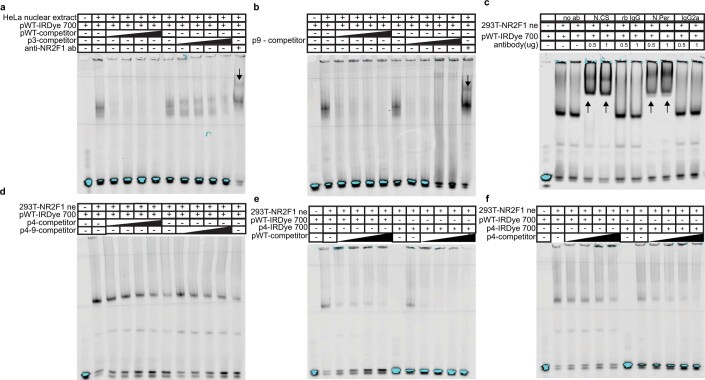
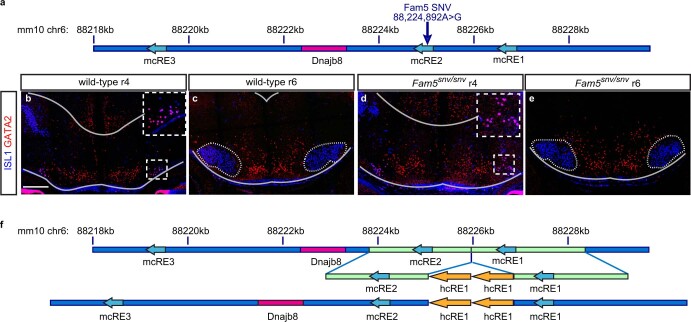
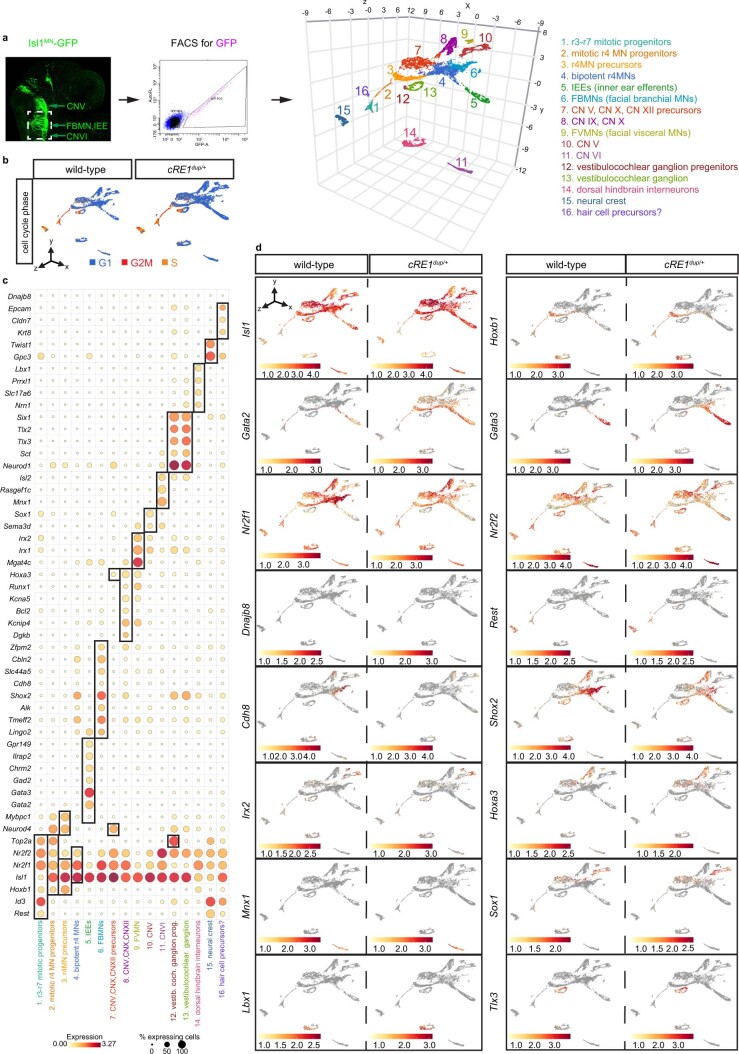
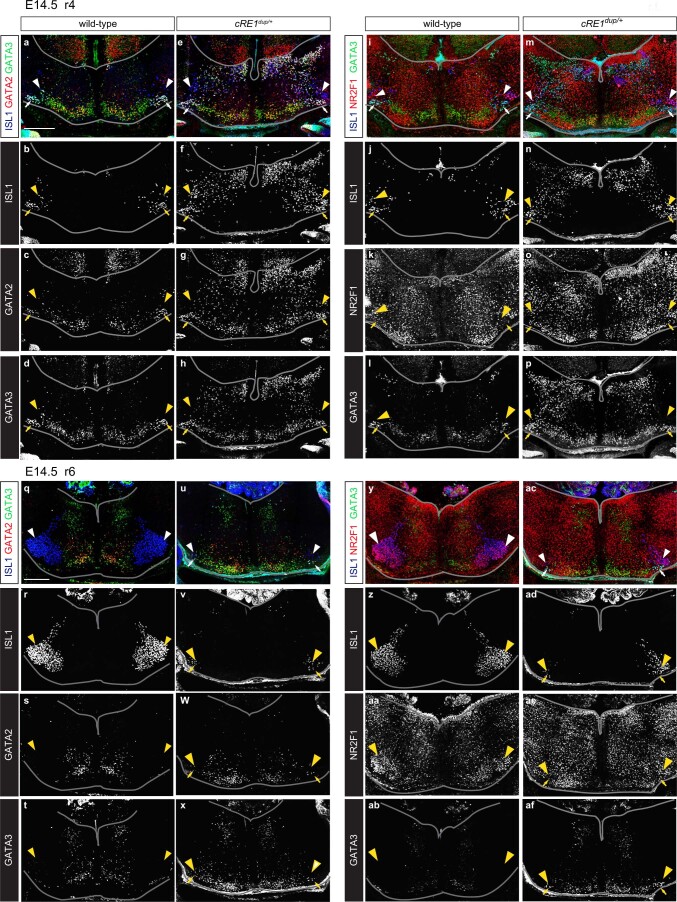
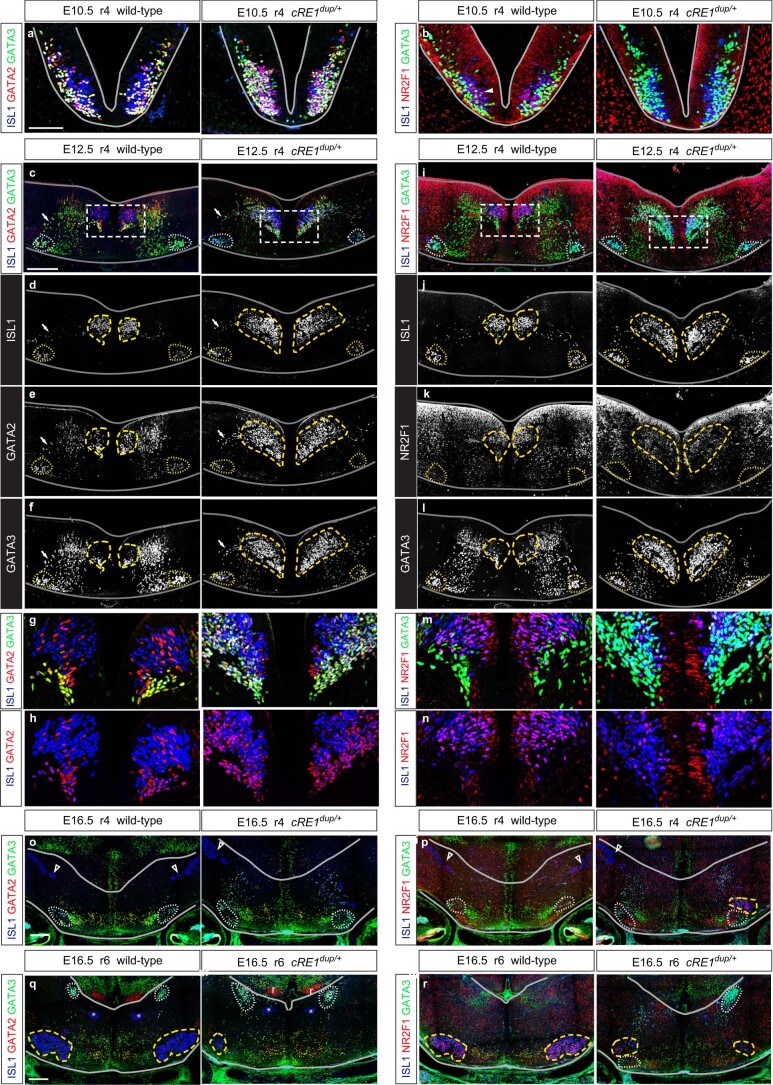
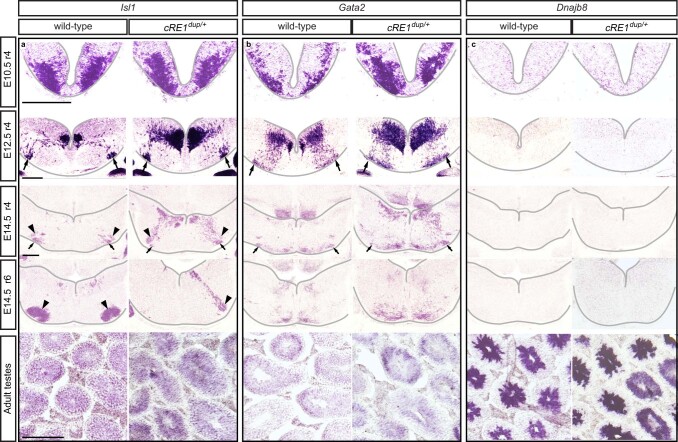
Hereditary congenital facial paresis type 1 (HCFP1) is an autosomal dominant disorder of absent or limited facial movement that maps to chromosome 3q21-q22 and is hypothesized to result from facial branchial motor neuron (FBMN) maldevelopment. In the present study, we report that HCFP1 results from heterozygous duplications within a neuron-specific GATA2 regulatory region that includes two enhancers and one silencer, and from noncoding single-nucleotide variants (SNVs) within the silencer. Some SNVs impair binding of NR2F1 to the silencer in vitro and in vivo and attenuate in vivo enhancer reporter expression in FBMNs. Gata2 and its effector Gata3 are essential for inner-ear efferent neuron (IEE) but not FBMN development. A humanized HCFP1 mouse model extends Gata2 expression, favors the formation of IEEs over FBMNs and is rescued by conditional loss of Gata3. These findings highlight the importance of temporal gene regulation in development and of noncoding variation in rare mendelian disease.


Conflict of interest statement

S.A.D.G. is a Regeneron Pharmaceuticals employee and stockholder.

Figures

Fig. 1
Fig. 1. Tandem duplications and noncoding heterozygous variants segregate with HCFP1.
a, Pedigrees of families 1–14. Above each pedigree is the chromosomal location of its CFP-causing variant. Below each individual is the pedigree position and, for participating individuals, the genotype for the variant allele (abbreviated pedigree is shown for Fam10, see ref. , and for Fam14, see ref. ). For Fam1, -2 and -10 to -12, the WT allele is denoted by a black ‘+’ and the duplication allele by a red ‘dup’. For Fam3–9, -13 and -14, the WT and variant nucleotides are denoted by black and red letters, respectively. Squares show males, circles females; black fill shows affected and gray fill shows self-reported, unaffected but mild facial weakness on examination; and dotted square or circle shows nonpenetrant phenotype. b, Schematic genomic representation based on UCSC (University of California, Santa Cruz) Genome Browser output. Gray horizontal bars above chr3 ideogram denote previously reported HCFP1 linkage regions (chr3:127,454,048–130,530,963, all human coordinates are from GRCh37/hg19) (refs. ,) for Fam10 and Fam14, and regions consistent with linkage for Fam1 and Fam9 (63 Mb minimum overlap chr3:76,924,329–140,632,237). Under the ideogram are: GRCh37/hg19 nucleotide positions; thick blue horizontal bars denoting Fam1, -2 and -10 to -12 overlapping duplications; genes in the region; structural variants in the DGV (blue duplications, red deletions); and conservation based on the PhyloP score. Hg19 genomic coordinates are: GATA2 (chr3:128,198,270–128,212,044), cRE1 (chr3:128,176,017–128,176,396), cRE2 (chr3:128,178,158–128,178,397) and cRE3 (chr3:128,187,090–128,187,620). c, Magnification of the sequence and multispecies alignment of the cRE2-conserved region harboring all seven SNVs. The WT nucleotide of each SNV is boxed with the family ID harboring an SNV indicated above the box. The two clusters of variants lie 32 bp apart and are labeled ‘Cluster A’ and ‘Cluster B’. Multispecies alignment reveals, in mice, a 4-bp deletion between Cluster A and Cluster B, and lack of conservation of the Fam6 variant. See also Extended Data Figs. 1 and 2.
Fig. 2
Fig. 2. HCFP1 phenotype and facial nerve MRI.
c,f,i,l,o, Photos of affected individuals attempting to smile (top) and close eyes (bottom) highlighting facial weakness (FW), lagophthalmos, absent forehead wrinkles and nasolabial folds, asymmetrical smile, upturned nasal tip and slit-like nares. a,b,d,e,g,h,j,k,m,n,p,q, MR images of facial nerve (VII, arrows) and vestibulocochlear nerve (VIII, arrowheads) in normal and HCFP1 individuals. R, right side; L, left side. a,b, Normal VII anatomy at the level of the right internal auditory canal (IAC) demonstrates origin and cisternal segments of right VII coursing parallel and ventral to VIII (a) and, more laterally, the right VII coursing through the IAC ventral to the superior vestibular branch of VIII (b). ce, Fam1: III-2, L > R: FW, mild left lagophthalmos (c); markedly hypoplastic right and absent left VII (short arrow: anterior inferior cerebellar artery) (d); and VII not visualized within the IACs (e). fh, Fam1: III-3, R > L: FW, bilateral lagophthalmos despite gold weight insertions (f); mild right VII hypoplasia (g); and left IAC narrowed, left VII markedly hypoplastic (h). ik, Fam1: IV-4: asymmetrical R > L FW with good eyelid closure (i); and bilateral R > L VII hypoplasia (j,k). ln, Fam3: III-2: bilateral L > R FW, R > L lagophthalmos (l); markedly hypoplastic right VII cisternal segment (m); mildly hypoplastic right VII IAC segment (n); and absent left VII cisternal segment (m,n). oq, Fam9: IV-1: L > R FW, minimal lagophthalmos (o); right VII cisternal segment not visible; hypoplastic left VII cisternal and IAC segments (p,q).
Fig. 3
Fig. 3. Conditional loss of Gata2 or Gata3 prevents IEE development but does not impede FBMN development.
a, Migration schema of OCN (orange) and VEN (pink) IEEs and FBMNs (blue). b, E11.5 whole-mount Isl1 and Gata2 in situ hybridization: r4MN progenitor zone (black arrowheads), caudally migrating FBMNs (black arrows), parasagittal interneuron column (yellow arrowheads), developing inner ear (yellow arrows) (n = 3 WT, 10 cRE1dup/+ embryos). Scale bar, 200 μm. ch, ISL1 (blue), GATA2 (red) and GATA3 (green) immunofluorescence on E14.5 WT (c,f), conditional Gata2KO/flox;Phox2b-Cre+ (d,g) and Gata3tlz/flox;Phox2b-Cre+ (e,h) KO hindbrains at r4 (ce) and r6 (fh). White arrows show OCN IEEs, yellow arrowheads show interneurons and the white arrowhead shows the trigeminal motor nucleus. Blue (r4) and white (r6) boxed regions are magnified below with a dotted oval denoting OCN IEE location (n = 3 (c,f), 6 (d,g) and 3 (e,h)). The borders of the hindbrain are outlined in gray. Scale bar, 200 μm (c) and applies to ch. i, Schematics of E14.5 hindbrain cytoarchitecture based on ch as viewed ventrally (left) and in cross-section at the level of r4 (middle) and r6 (right) in WT (left side of each schema) and Gata2 or Gata3 cKOs (right side of each schema). ISL1ON;GATA2ON IEEs (orange neurons) were absent from cKOs whereas ISL1ON;GATA2OFF FBMNs (gray) appeared normal. j, Whisking assay schematic. k, Whisker movement assessment. Both left and right whiskers scored 3 for all WT (n = 5 male (M), 4 female (F), Gata2KO/flox;Phox2b-Cre+ (n = 2 M, 3 F), Gata3tlz/flox;Phoxb2-Cre+ (n = 2 M, 4 F) and cRE2 Fam5snv/snv (n = 2 M, 4 F) mice). Both left and right whiskers scored 0 for all cRE1dup/+ mice (n = 8 M, 10 F). Of the cRE1dup/+;Gata3tlz/flox;Phox2b-Cre+ rescue mice (n = 1 M, 6 F), 2 had full (3) and 1 had no (0) whisker movement bilaterally, whereas the remaining 4 had intermediate movement (0 < x < 3). Pairwise, two-sided Bonferroni’s corrected Wilcoxon’s test (P values as shown). The filled circle shows mean and the error bar the s.e.m. Schemas in j were created with BioRender.com.
Fig. 4
Fig. 4. Cluster A SNVs impair cRE2-mediated silencing in a reporter expression assay in vivo and reduce NR2F1 binding in vitro.
a,b, Schematics for in vivo lacZ reporter assay constructs (a) and hindbrain β-galactosidase expression viewed dorsally through the fourth ventricle (b). In b, midline ovals denote IEE/FBMN progenitors, triangles denote migrating IEEs and leg-like columns denote migrating FBMNs that are highlighted by black arrows in c, d and gi. ci, Selected images of ectopic β-galactosidase in transfected embryos (left) and schema (right): cRE1 alone (c, n = 13), cRE3 alone (d, n = 6) cRE2 alone (e, n = 8), cRE1 with cRE2 (f, n = 10), cRE3 with cRE2 (g, n = 7), cRE1 with cRE2 carrying Cluster A variants (h, n = 13) and cRE1 with cRE2 carrying Cluster B variants (i, n = 8). The asterisk denotes a mutant cluster. Scale bar (c), 500 μm and applies to ci. Additional images are shown in Extended Data Fig. 3. j, Partial cRE2 sequence, as per Fig. 1. Gray horizontal bars denote overlap with in silico, conserved, transcription-binding consensus sequences from TRANSFAC (indicated by $). The shade of gray correlates with a prediction z-score. WT (pWT) and mutant (pMut) EMSA probes are aligned below. TFBS, TF-binding sites. k, EMSA results showing the effect of SNVs on NR2F1-binding activity from transfected nuclear extract (293T-NR2F1 ne) in the presence of increasing molar excess (25× to 50× to 100× to 200× as denoted by black slope) of pWT or pMut competitor ‘cold’ probes compared with conjugated ‘hot’ probe (pWT-IRDye 700). For each SNV: NR2F1 binding (upper gel); free probe (bottom gel, lower and upper bands reflect unannealed and annealed probe, respectively). In all five experiments, pWT shows decreasing NR2F1 binding and increasing free probes. Cluster A variant competitor probes (p3, p4 and p5) compete less well than pWT for NR2F1 binding (more NR2F1 shifted and less free probe available). Cluster B variants (p7–8 and p9), where no NR2F1 binding is expected, show no substantial effect. The same trend was observed in replicate experiments: WT = 11; p3 = 5; p4 = 8; p5 = 4; p7-8 = 3; and p9 = 7. Full gels are given in Source data. Source data
Fig. 5
Fig. 5. NR2F1 binds cRE2 in E10.5 r4MNs and binding is reduced by Fam5 SNV.
a, Schematic representation of single-cell CUT&Tag of E10.5 WT and Fam5snv r4 Isl1+ neurons targeting NR2F1. scATAC-seq, single-cell assay for transposase-accessible chromatin with high-throughput sequencing. b, UMAP embedding of NR2F1 single-cell CUT&Tag experiment for two Fam5SNV/SNV (replicate (Rep) 1 = 2,274 cells, Rep 2 = 2,740 cells) and two WT (Rep 1 = 2,572 cells, Rep 2 = 1,377) age-matched biological replicates. c, Pseudobulk single-cell CUT&Tag profile of NR2F1 around the Gata2 regulatory region shown as individual and combined replicates (WT in blue and Fam5SNV/SNV in red–yellow). Location of the cREs relative to mouse Gata2 and Dnajb8 is shown. Note the reduction in the height of the cRE2 peaks (vertical pink shading) in the Fam5SNV/SNV replicates.
Fig. 6
Fig. 6. Single-cell transcriptomic analysis of WT and cRE1dup/+ r4 motor neurons.
a,b, Three-dimensional (3D) UMAP plot of WT (a) and cRE1dup/+ (b) components of a E9.5–E12.5 scRNA-seq object comprising Isl1+ and/or Hoxb1+ FAC-sorted Isl1MN-GFP cranial motor neurons (MNs) (with GFP cells spiked in) spanning r3–r7. Seurat clusters are numbered and annotated according to proposed cellular identity at the right. CN, cranial nucleus. The black dotted arrows trace the proposed pseudotime developmental trajectory of r4MNs from mitotic progenitors of r3–r7 neurons (Cluster 1), r4MN mitotic progenitors (Cluster 2) and r4MN precursors (Cluster 3), ‘bipotent r4MNs’ (Cluster 4), which gave rise to separate populations of IEEs (Cluster 5) defined by Gata2 and Gata3 expression,, and FBMNs (Cluster 6) defined by Syt4, Shox2 and Cdh8 expression and enriched for Nr2f1 (refs. ,,,) (Extended Data Fig. 6c,d). c, Overlapping feature plots of WT (blue, bottom layer) and cRE1dup/+ (peach, top layer) 3D UMAPs shown in a and b. Sixty percent opacity of cRE1dup/+ data points reveals WT data and highlights overlap of the genotypes (burgundy). d, Volcano plot of differential expression analysis between WT and cRE1dup/+ r4MN trajectories across the E9.5–E12.5 timepoints. Circled genes display log(fold-change) > 1 and −log10(FDR) > 200 or are additional genes of interest (where FDR is false recovery rate). e, Dotplot comparison of FBMN and IEE marker expression in E9.5–E10.5 Cluster 1–6 r4MN developmental trajectories in WT (upper) and cRE1dup/+ (lower) embryos. Red and green outlines highlight differences in Syt4 and Gata2 expression, respectively, between WT and cRE1dup/+ samples. Scales indicate the mean expression level and percentage expressing cells within each cluster. f, Feature plots of WT and cRE1dup/+ r4MN trajectory determinants and markers at E9.5 (upper two rows) and E10.5 (lower two rows). At E9.5 in both WT and cRE1dup/+ embryos, r4MN precursors, a subset of IEE-directed bipotent r4MNs and IEEs (Clusters 3–5), expressed Gata2, with additional ectopic expression seen in cRE1dup/+ FBMNs (Cluster 6). By E10.5, WT embryos expressed Gata2 only in Cluster 5 IEEs, but cRE1dup/+ embryos maintained Gata2 expression in Clusters 3–5. g, Density plots for Nr2f1 and Gata2 expression in E9.5–E10.5 WT and cRE1dup/+ r4MNs. See also Extended Data Fig. 6.
Fig. 7
Fig. 7. GATA2 expression and IEE birth epoch are expanded in developing cRE1dup/+ hindbrain.
ah, E14.5 WT (ad) and cRE1dup/+ (eh) hindbrain sections at r4 (a,b,e,f) and r6 (c,d,g,h) axial levels showing immunofluorescence with ISL1 (blue) and GATA3 (green) (ah) together with GATA2 (red: a,c,e,g) or NR2F1 (red: b,d,f,h). Ectopic dorsal r4MNs are present in e and f compared with a and b. Dotted yellow and blue rectangles (a,b,e,f) surround IEE VEN and OCN regions, respectively, and are magnified below. Dashed white squares (c,d,g,h) surround facial nuclei and are magnified below. White arrows show OCNs and white arrowheads FBMNs. The borders of the hindbrain are outlined in gray. Scale bars, 200 μm (a,c) apply to a, b, e and f, and c, d, g and h, respectively (n = 3 (a,c), 3 (b,d), 8 (e,g) and 7 (f,h) embryos). ik, Schematics of E14.5 hindbrain cytoarchitecture based on ah as viewed ventrally (i) and in cross-section at the level of r4 (j) and r6 (k) in WT (left side) and cRE1dup/+ (right side) of hindbrains. lo, Quantification of E14.5 r4MN transcriptional and positional identity in cRE1dup/+ and WT littermates detected in confocal z stacks. Unilateral counts are presented; each point represents an individual embryo and each color a litter (color coded A–F) (n = 9 cRE1dup/+ and nine WT littermate pairs from six litters). On average per side, WT versus cRE1dup/+ embryos had: 9,470 versus 10,422 r4-born MNs (l); 903 versus 4,405 IEEs (m); 8,408 versus 5,691 FBMNs (m); 719 versus 2,478 OCNs (n); 184 versus 1,927 VENs (n); and 7,721 versus 2,098 FBMNs completing migration into ventral r6 (o). In the box plot, the center line is the median, the box limits represent 50% of the values and the whiskers represent 98% of the values. p, The r4MN birthdating in the 18-mouse cohort in lo using in utero labeling of mitotic cells with thymidine homolog EdU in IEE (OCN + VEN) and FBMN (FBMN + r4 ectopic); definitions as per m. Point is the mean. For lp, all indicated P values are calculated using two-sided, pairwise Student’s t-test without correcting for multiple testing; the error bar = ± s.e.m. See also Extended Data Figs. 8 and 9.
Fig. 8
Fig. 8. Combining cRE1dup with Gata3 conditional inactivation partially rescues the HCFP1 phenotypes.
ah, ISL1 (blue), NR2F1 (red) and GATA3 (green) immunofluorescent staining of hindbrain cross-sections at r4 (top row) and r6 (middle row) axial levels in E14.5 Gata3flox/+;Phox2b-Cre WT (a,b), Gata3tlz/flox;Phox2b-Cre+ conditional Gata3 knockout (c,d), cRE1dup/+;Gata3flox/+ duplication (e,f) and cRE1dup/+;Gata3tlz/flox;Phox2b-Cre+ rescue (g,h) embryos. i,j, A rescue embryo with ISL1 (blue), GATA2 (red) and GATA3 (green) immunofluorescence (for WT and cRE1dup/+ comparators, see Fig. 7a,c,e,g). Dotted blue squares surround IEE OCNs in a, c, e, g and i and are magnified (bottom row). Dotted white squares marking the right facial nucleus are boxed in b, d, f, h and j and magnified (bottom row). Rescue embryos lack OCNs (g,i) and form an FBMN nucleus (h,j) intermediate in cross-sectional area between WT (b) and cRE1dup/+ (f) embryos. White arrows in magnification of g highlight r4 ISL1ON;NR2F1ON FBMNs. White open arrowheads show trigeminal motor neurons and asterisks the abducens nucleus. Dorsal and ventral borders of the hindbrain are outlined in gray. Scale bar, 200 μm in a applies to aj (n = 3 (a,b), 3 (c,d), 4 (e,f), 3 (g,h) and 5 (i,j) embryos). k, Model depicting the effect of HCFP1 variants. Stage 1: in both WT (left side) and HCFP1 (right side) hindbrains, early born r4MN progenitors express Gata2, driven in part by cRE1 and cRE3 enhancers, and assume an IEE identity (red cells). Stage 2: in WT, NR2F1 (pink oval) binds to cRE2 in later-born r4MNs, silencing GATA2 and directing these cells to an FBMN identity (gray cells). In HCFP1, cRE2 SNVs disrupt NR2F1 binding (demarcated with X) and unimpeded cRE1 and cRE3 enhancers drive GATA2 expression in later-born r4MNs. Duplications of cRE1, cRE2 and cRE3 generate a net increase in GATA2 enhancer level, similarly expanding GATA2 expression. Either will increase IEEs at the expense of FBMNs, deplete the FBMN progenitor pool and result in CFP.
Extended Data Fig. 1
Extended Data Fig. 1. Genetic analysis of HCFP1 pedigrees.
(a) The HCFP1 locus linkage data in Fam1 (LOD 2.1) and Fam9 (LOD 1.8). (b) Fam2, Fam7-9, Fam14 haplotypes. hg19 position of each SNP on chromosome 3 provided; disease-causing variants are indicated in red. Fam2 duplication arose de novo in II-2 on an allele inherited from I-1 (Fam2:I-1 haplotypes assumed). Fam7 and Fam8 harbored the same HCFP1 SNV and shared a >310 kb haploidentical region (chr3:127,881,362-chr3:128,191,414), suggesting the SNV is derived from a common ancestor. Fam9 and Fam14 harbor the same SNV on different haplotypes, suggesting independent mutational events. (c) SNP array data (left) and genome sequence (right) encompassing the Fam1 duplication; affected Fam1:III-3 (top), unaffected Fam1:III-4 (bottom). For SNP arrays, the Log R Ratio (LRR) is displayed in blue (top) and the B Allele Frequency (BAF) in green (bottom). Boundaries of the duplication are indicated by vertical dashed lines. LRR value reflects total copy number with the mean value, indicated by red horizontal lines, higher in duplicated than in flanking regions. BAF value is the proportion of B allele among A and B alleles at each SNP; 0, 0.5, and 1 correspond to AA, AB, and BB genotypes. The deviation from 0.5 to 0.33 or 0.66 within Fam1:III-3 corresponds to unbalanced genotypes AAB or ABB, reflecting a duplication signal. (Right) Aligned reads near the breakpoints of each of the two duplications visualized with Integrative Genomics Viewer. Location of the chromosomal region along with read depth, all read pairs, discordant read pairs, and split reads is shown. Duplicated region is highlighted in green. (d) Copy number quantification using digital droplet PCR for Fam1 and Fam2 duplications. Copy number values are the average of three experiments. Error bars indicate standard error. (e) Sanger sequencing traces that define duplication breakpoints (vertical black line) for each pedigree. Arrows preceding and following the vertical line indicate the most distal and proximal nucleotide in the duplication, respectively. Fam1 has an insertion of nucleotides GAA at the breakpoint (underlined). Fam2, Fam10-Fam12 have microhomology identified at the breakpoint (red-boxed nucleotides). (f) Sanger sequencing traces for each SNV with representative results of an affected and control individual.
Extended Data Fig. 2
Extended Data Fig. 2. Detailed analysis of HCFP1 region.
(a) Magnification of the UCSC Genome Browser output from Fig. 1 with multispecies conservation and the three cREs boxed in blue. Green, red, and blue boxes above cREs denote DNAse clusters reported by ENCODE with the number of unique cell lines/tissue in which the cRE has been found open. (b) Chromatin state segmentation of the HCFP1 region in different human tissues and cell lines from CistromeDB, and ENCODE data. In SK-N-SH neuroblastoma cells (top track), there are uninterrupted stretch enhancer regions 14.8kb in length encompassing cRE3 and 3.4kb in length encompassing cRE1 and cRE2. The active promoter and active transcription chromatin states indicate an overall high regulatory activity of this region in SK-N-SH cells. The largely repressive chromatin state of the corresponding region in a wide range of other tissues and cells (remaining tracks) highlights how cell-type-specific epigenomic states could potentially influence cRE activity and GATA2 expression. DNAJB8, a molecular chaperone not known to be associated with human disease, is not widely transcribed. (c) ChIP-seq results for NR2F1 and GATA3 from published datasets. Blue horizontal bar above the ChIP-seq results indicates the minimal duplication region, and the green, red, and blue squares under the ChIP-seq results indicate the positions of cRE1, cRE2, and cRE3, respectively. NR2F1 shows specific binding to cRE2 in human iPSC-derived neural crest cells. By contrast, GATA2 and its effector transcription factor (TF) GATA3 bind specifically to cRE1 and cRE3, but not to cRE2 in neuroblastoma SK-N-SH and SH-SY5Y cells.
Extended Data Fig. 3
Extended Data Fig. 3. Summary of LacZ expression experiments.
(a-i) Replicate embryos from the lacZ reporter injections as indicated in schematic in Fig. 4a. (a) cRE1, (b) cRE3, (c) cRE2, (d) cRE1+cRE2, (e) cRE2+cRE3, (f) cRE1+cRE2*A, (g) cRE1+cRE2*B, (h) cRE2*A, (i) cRE2*B. Shown are all embryos up to a maximum of 10 per genotype, with text denoting embryos >10. ‘S’ and ‘T’ indicate embryos with single or tandem transgene insertion, respectively. Tandem insertions show stronger signals but less specificity than single insertions. White Single (WhS) and White Tandem (WhT) indicate embryos carrying single or tandem transgene insertion, respectively, that do not show β-galactosidase coloration. Embryos have an average crown-rump length of 6 mm. Scale bars in (a) = 500μm for the whole embryo (left) and dorsal hindbrain view through 4th ventricle (right) images and apply to (a-i) as approximate measurements.
Extended Data Fig. 4
Extended Data Fig. 4. Additional EMSA data.
Electrophoretic mobility shift assay (EMSA) to confirm the interaction of NR2F1 with cRE2 sequence and to test whether HCFP1 SNVs attenuated this interaction in vitro. Blots are unmodified. Oligonucleotide probes containing the Cluster A and B region conjugated to a IRDye 700 fluorophore and competed with WT or mutant non-conjugated probes were designed. As per Fig. 4, EMSA results showing the effect of SNVs on NR2F1 binding (293T-NR2F1 ne denotes nuclear extract from NR2F1 transfected 293T cells) in the presence of increasing molar excess (25x-50x-100x-200x as denoted by black slope) of WT (pWT) or mutant (pMut) competitor probe compared to hot probe (pWT-IRDye 700). (a-b) EMSA for Cluster A p3 (a) and Cluster B p9 (b) using HeLa nuclear extract (refer to Fig. 4j for probe maps) (n = 4). The shifted band in the second lane of each gel is abolished with the addition of small amounts of WT or Cluster B p9 competitor. The Cluster A p3 is a less efficient competitor, suggesting that the variant alters the binding of a TF to the DNA. The addition of an anti-NR2F1 antibody causes a supershift of the TF-conjugated probe complex, indicating that this interaction is mediated by NR2F1. (c) A stronger shift is obtained with nuclear extract from NR2F1-transfected 293T cells. Specific supershift is observed using two different commercial NR2F1 antibody preparations (N.CS: Cell Signaling; N.Per: Perseus) each at two concentrations (0.5 ug and 1 ug). No supershift was observed using two isotype-specific controls (rabbit IgG for the N.CS antibody and IgG2a for the N.Per antibody), (n = 4). (d) No additional effects on competition are observed combining a variant in Cluster A and a variant in Cluster B on a single competitor probe (p4-p9 probe compared to p4 only (n = 6)). (e) Unlabeled pWT competes with labeled p4 more effectively than with labeled pWT (n = 2). (f) Unlabeled p4 does not compete well with labeled pWT. Comparing unlabeled pWT and unlabeled p4, the former competes better with labeled p4 (n = 2).
Extended Data Fig. 5
Extended Data Fig. 5. Facial motor nucleus formation in SNV HCFP1 mice.
(a) Schematic of the orthologous Fam5snv variant introduced into mouse. (b-e) Immunofluorescent staining for ISL1 (blue) and GATA2 (red) on cross sections from WT (b,c) and Fam5snv/snv (d,e) E14.5 hindbrains at r4 (b,d) and r6 (c,e) levels. Development of ISL1ON;GATA2ON IEEs was similar in WT (dashed region in b; inset) and Fam5snv/snv (dashed region in d; inset) embryos, as was the formation of the facial motor nucleus (dotted regions in c,e). n = 4 (b,c), 4 (d,e) embryos. Scale bar = 200μm in (b) and applies to (b-e). (f) Generation of a humanized cRE1 duplication model. Tandem copies of human cRE1 (yellow arrows, (hg19 chr3:128,175,708-128,176,563) were inserted between the endogenous murine cRE1 and cRE2 loci.
Extended Data Fig. 6
Extended Data Fig. 6. cRE1dup-mediated transcriptomic changes in the context of the developing hindbrain.
(a) scRNAseq workflow. r3-r7 GFP-positive and surrounding GFP-negative tissues were microdissected from E9.5-12.5 Isl1MN-GFP control and cRE1dup/+;Isl1MN-GFP hindbrains, dissociated, pooled by age and genotype, and purified using FACS. In the FACS example shown, E11.5 WT Isl1MNGFP+ r4MNs comprised 2.0% of total cellular input. Non-linear dimension reduction (clustering) was performed on a composite WT and cRE1dup/+ scRNAseq dataset for timespoints E9.5-E12.5. Plotted expression data was limited to HoxB1+ and/or Isl1+ cells to capture r4 ventricular zone progenitors and MNs. Proposed cluster identities are listed on the right. FACS sequential gating/sorting strategies as per Extended Data Fig. 7. (b) Cell cycle phase UMAP plot of E9.5-E12.5 clusters showing WT cells (left) and cRE1dup/+ cells (right). Cluster 1 was entirely mitotic and the likely source of r4MN progenitors. (c) Dot plots for marker gene expression (Y axis) in the 16 Seurat clusters (X axis). (d) Feature plots for select markers of r4MNs and other clusters identified in the WT (left column) and cRE1dup/+ (right column) Hoxb1+ and/or Isl1+ scRNAseq object. A shared FVMN (facial visceral motor neuron), CN IX, CN X trajectory is defined in part by Hoxa3 expression (Clusters 7,8,9; see also Supplementary Table 3) and a motor CN V trajectory is marked by the expression of the previously unreported marker Sox1 (Clusters 7,10).
Extended Data Fig. 7
Extended Data Fig. 7. Representative fluorescence-activated cell sorting (FACS) gating strategy for E11.5 WT and cRE1dup/+ Isl1MNGFP+ r3-r7 cranial motor neurons.
Gating strategy for dissociated GFP-free limb buds collected from E11.5 WT;Isl1MN-GFP embryos (a-e) and r3-r7 hindbrains collected from E11.5 WT (f-j) and cRE1dup/+ (k-o) embryos. (a,f,k) P1 was drawn to include all cells and exclude debris and dead cells based on SSC-A (side scatter area) VS FSC-A (forward scatter area). (b,g,l) P2 was drawn for primary doublet removal using the ratio of FSC-H (forward scatter height) vs FSC-A to exclude doublets entering the point of interrogation vertically. (c,h,m) P3 was drawn as a secondary exclusion for horizontal doublets using the side scatter parameter of SSC-H (side scatter height) vs SSC-W (side scatter width). (d,i,n) GFP positive gate was drawn to include true GFP positive cells and exclude any possible autofluorescent signals from live or dead cells. GFP signal was plotted against autofluorescence (autoFl) detected as a second channel from the GFP laser and an emission filter of 575/40. (e,j,o) Gating summary, GFP+ cells comprised 0% of WT limb bud input, 2.0% of WT input hindbrain cells, and 2.3% of cRE1dup/+ input hindbrain cells.
Extended Data Fig. 8
Extended Data Fig. 8. Single channel images of Fig. 7 immunohistochemistry.
E14.5 r4 (a-p) and E14.5 r6 (q-af) Immunostaining from Fig. 7a–h presented as composite images (a,e,i,m,q,u,y,ac) with the corresponding single-channel images for each of the single antibodies shown below each composite image. Solid lines mark the approximate anatomic borders of the hindbrain, arrows indicate OCNs, and arrowheads mark FBMNs. 200μm scale bars in (a) and (q) apply to (a-p) and (q-af), respectively.
Extended Data Fig. 9
Extended Data Fig. 9. Transcriptional and positional r4MN identity is disrupted in the cRE1dup/+ embryonic hindbrain.
(a,b) Immunofluorescence of WT (left) and cRE1dup/+ (right) E10.5 r4 axial hindbrain cryosections stained in (a) for ISL1 (blue), GATA2 (red), GATA3 (green), and in (b) for IS1 (blue), NR2F1 (red), GATA3 (green). In WT, a medial population of r4MNs excludes GATA2 and GATA3 expression (a, left, blue cells); in cRE1dup/+, GATA2 and GATA3 expression overlaps extensively with ISL1 (a, right). A subset of medial r4MNs express NR2F1 in WT (b, left, arrowhead) but not in cRE1dup/+ hindbrains (b, right). (c-n) E12.5 r4 axial hindbrain cryosections stained in (c-h) as in (a), and in (i-n) as in (b) on WT (left) and cRE1dup/+ (right) sections. Compound (c,i) and single (d-f,j-l) channels. Arrows mark migrating IEEs (c-f). ISL1, GATA2, GATA3 midline r4MNs are expanded in number in cRE1dup/+ hindbrains. ISL1OFF;GATA2ON;GATA3ON interneurons form diffuse, bilateral columns overlapping r4MNs in WT and cRE1dup/+ hindbrains. Midline r4MN clusters in (c) are enlarged in (g,h), and (i) in (m,n). Ventral IEEs are delineated from dorsal FBMNs by GATA2 and GATA3 expression in WT (g,h, left), but not in cRE1dup/+ hindbrains (g,h right). GATA2ON; ISL1OFF cells in the FBMN compartment are likely interneurons (h, left, dorsal red cells). NR2F1 expression detected in WT FBMNs (m,n, left, purple cells) is decreased in cRE1dup/+ midline r4 MNs (m,n, right). (o-r) E16.5 r4 (o,p) and r6 (q,r) axial hindbrain cryosections with staining as per (a,b) on WT (o-r, left) and cRE1dup/+ (o-r, right) sections. GATA2 is downregulated in OCNs at this stage in both genotypes (o,q), and NR2F1 is detected in FBMNs but not IEEs (p,r). cRE1dup/+ but not WT embryos have scattered ectopic ISL1ON;GATA3ON r4 neurons (o,p right vs. left). The r6 VEN population is enlarged and FBMN nuclei smaller in cRE1dup/+ compared to WT (q, r right vs. left). Solid lines = anatomic borders of the hindbrain, dotted ovals encircle IEEs, dashed ovals encircle FBMNs. Open arrowheads = trigeminal motor neurons, asterisks in (q) = abducens nucleus. Scale bars = 200μm. Scale bar in (a) applies to (a,b); (c) applies to (c-f, i-l); (o) and (q) apply to (o,p) and (q,r), respectively. n = 3 (a-n) and 2 (o-r) embryos.
Extended Data Fig. 10
Extended Data Fig. 10. Isl1, Gata2, and Dnajb8 in situ hybridization.
((a-c) In situ hybridization staining for Isl1 (a), Gata2 (b), and Dnajb8 (c) expression in wild type (left column) and cRE1dup/+ (right column) embryos at the indicated ages and axial levels. In the cRE1dup/+ embryos, Isl1 and Gata2 expression was expanded in r4, and fewer Isl1+ FBMNs were detected in r6 at E14.5. Dnajb8 expression was not detected in the hindbrain region of developing r4, but the same probe did detect robust and specific expression in developing spermatids in adult WT and cRE1dup/+ testis. n = 2 (E10.5), 4 (E12.5), 2 (E14.5), 3 (adult testes) samples each for WT and cRE1dup/+. Arrows mark OCNs, arrowheads mark FBMNs. All scale bars = 200um and apply to all panels with the corresponding developmental age.

References

    1. ENCODE Project Consortium. An integrated encyclopedia of DNA elements in the human genome. Nature. 2012;489:57–74. doi: 10.1038/nature11247. - DOI - PMC - PubMed
    1. Kvon EZ, et al. Progressive loss of function in a limb enhancer during snake evolution. Cell. 2016;167:633–642.e11. doi: 10.1016/j.cell.2016.09.028. - DOI - PMC - PubMed
    1. Lee B-K, et al. Cell-type specific and combinatorial usage of diverse transcription factors revealed by genome-wide binding studies in multiple human cells. Genome Res. 2012;22:9–24. doi: 10.1101/gr.127597.111. - DOI - PMC - PubMed
    1. Zhang F, Lupski JR. Non-coding genetic variants in human disease. Hum. Mol. Genet. 2015;24:R102–R110. doi: 10.1093/hmg/ddv259. - DOI - PMC - PubMed
    1. Spielmann M, Mundlos S. Looking beyond the genes: the role of non-coding variants in human disease. Hum. Mol. Genet. 2016;25:R157–R165. doi: 10.1093/hmg/ddw205. - DOI - PubMed

Publication types

Substances