. 2023 Jun 30;11(1):145.
doi: 10.1186/s40168-023-01589-9.

Microbiome and tryptophan metabolomics analysis in adolescent depression: roles of the gut microbiota in the regulation of tryptophan-derived neurotransmitters and behaviors in human and mice

Affiliations

Microbiome and tryptophan metabolomics analysis in adolescent depression: roles of the gut microbiota in the regulation of tryptophan-derived neurotransmitters and behaviors in human and mice

Manfei Zhou et al. Microbiome. .

Abstract

Background: Adolescent depression is becoming one of the major public health concerns, because of its increased prevalence and risk of significant functional impairment and suicidality. Clinical depression commonly emerges in adolescence; therefore, the prevention and intervention of depression at this stage is crucial. Recent evidence supports the importance of the gut microbiota (GM) in the modulation of multiple functions associated with depression through the gut-brain axis (GBA). However, the underlying mechanisms remain poorly understood. Therefore, in the current study, we aimed to screen the microbiota out from healthy and depressive adolescents, delineate the association of the targeted microbiota and the adolescent depression, address the salutary effects of the targeted microbiota on anti-depressive behaviors in mice involving the metabolism of the tryptophan (Trp)-derived neurotransmitters along the GBA.

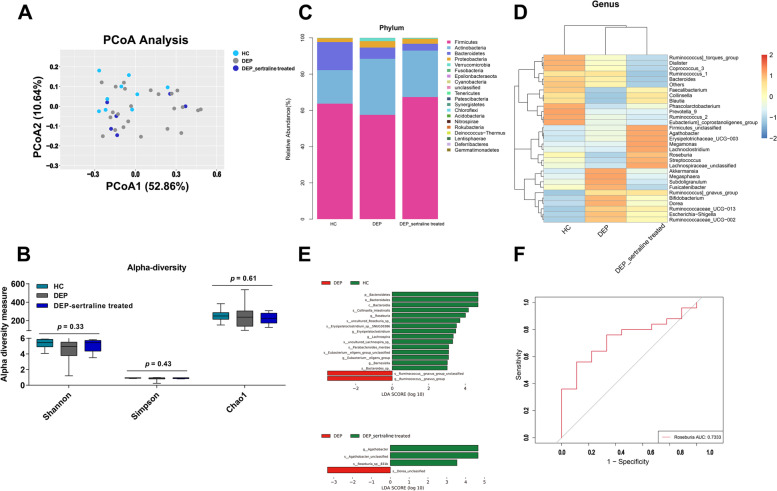
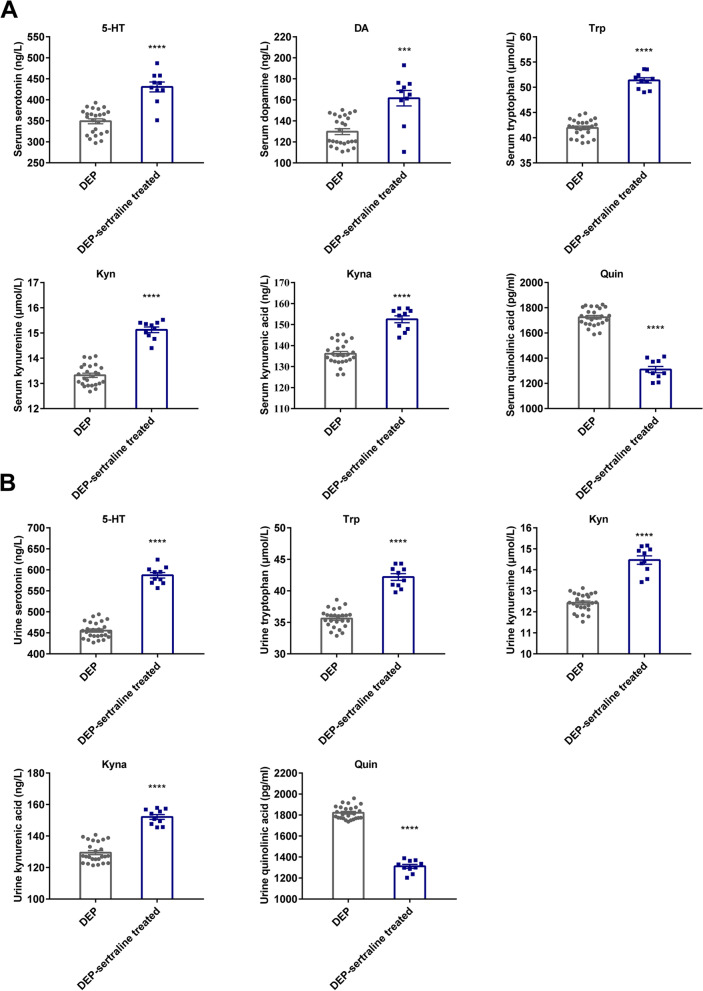
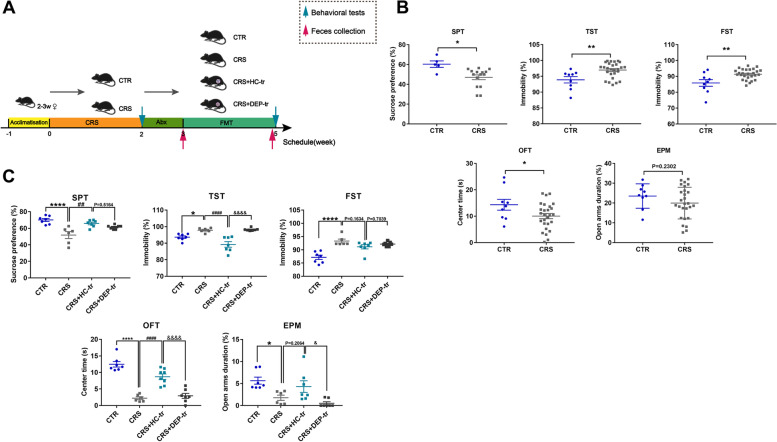
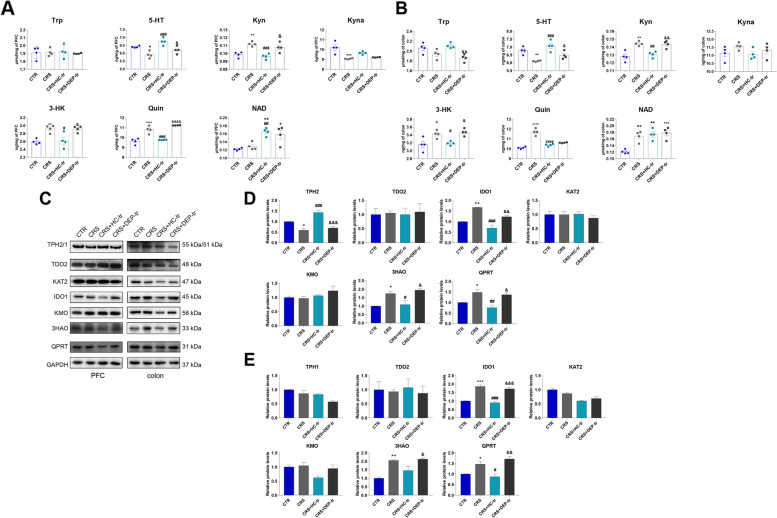
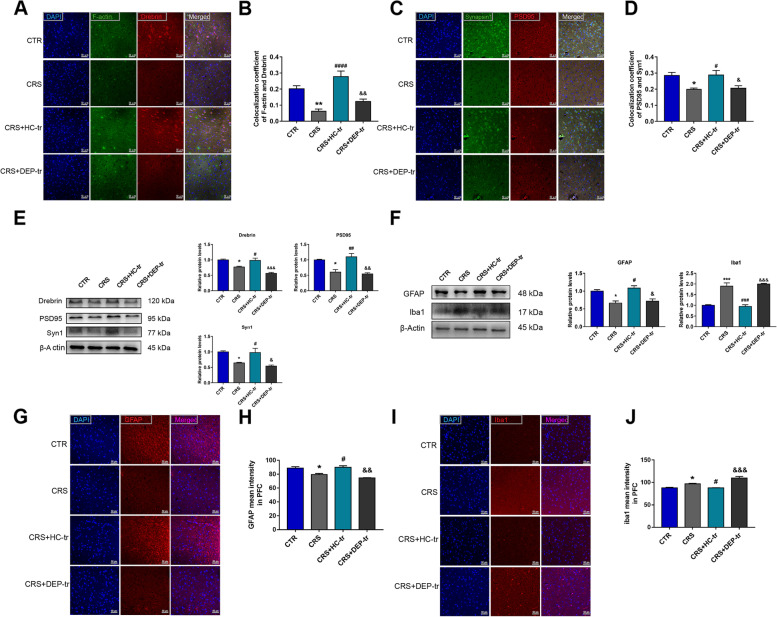
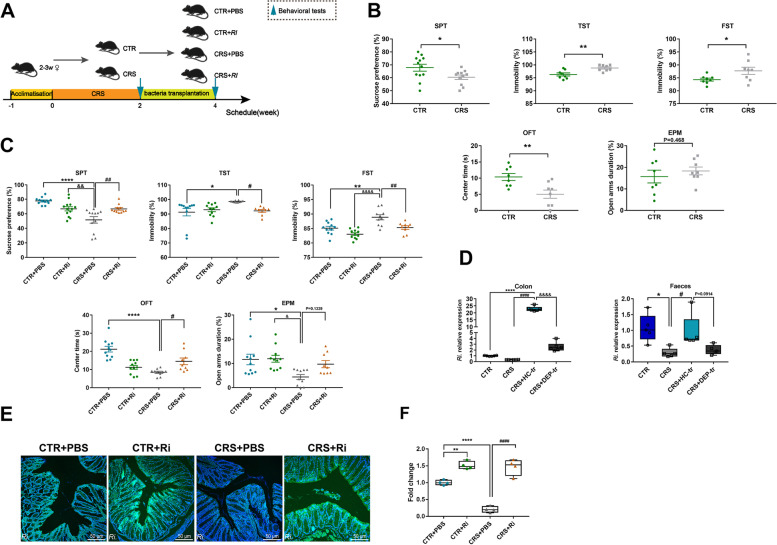
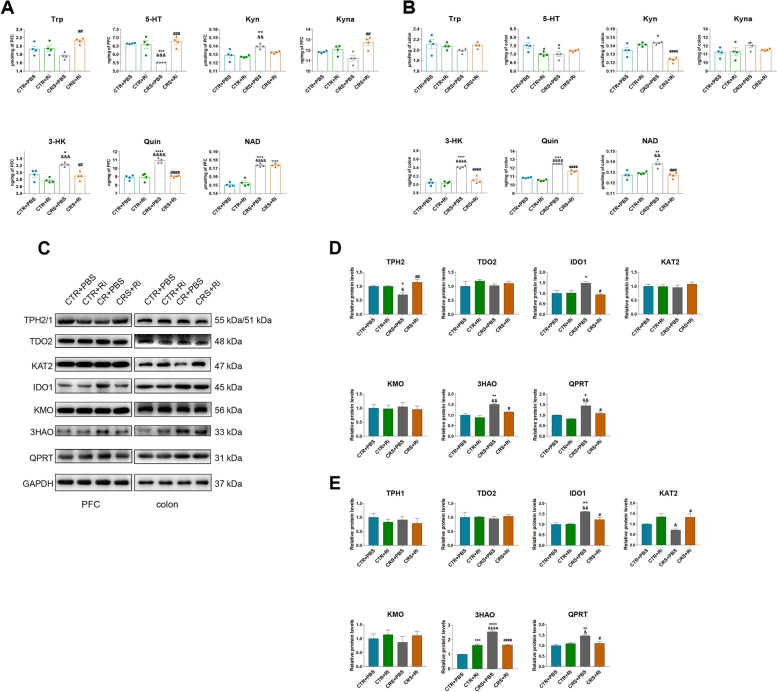
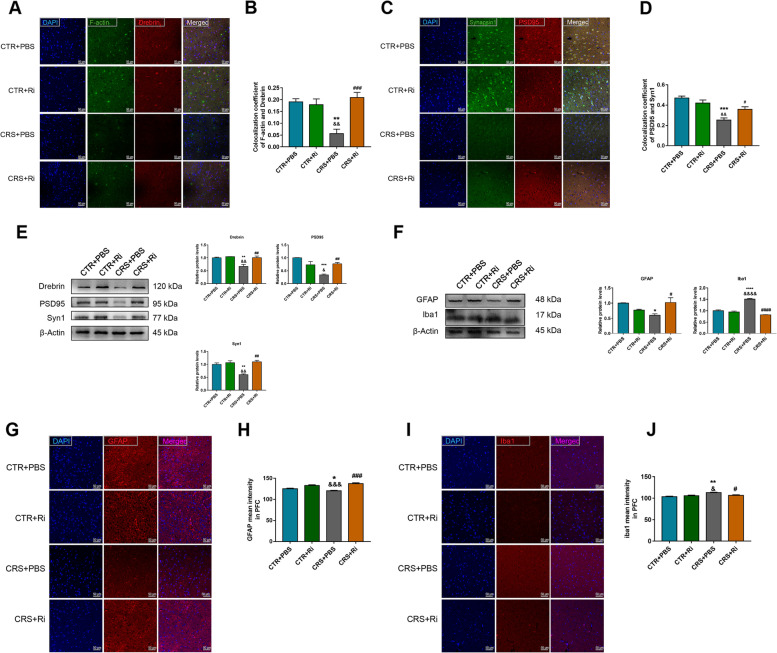
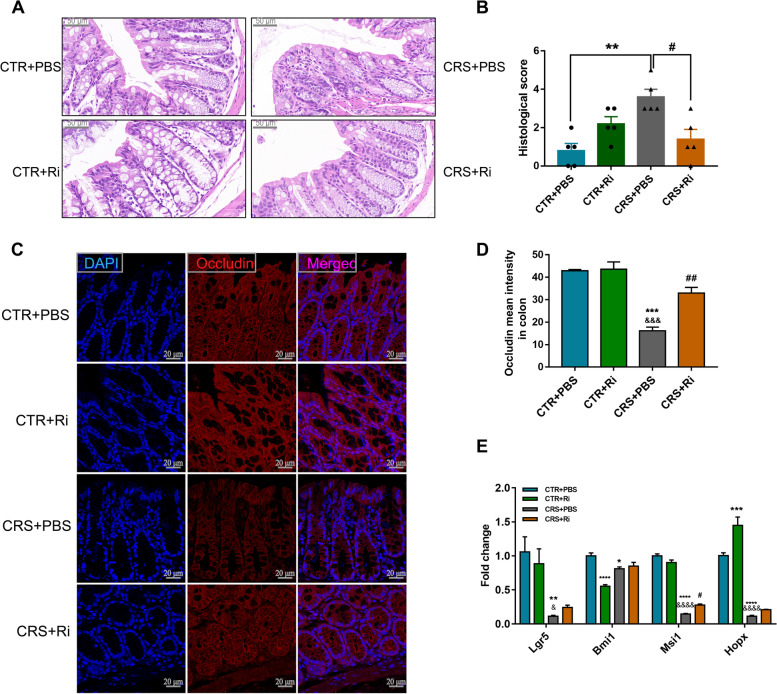
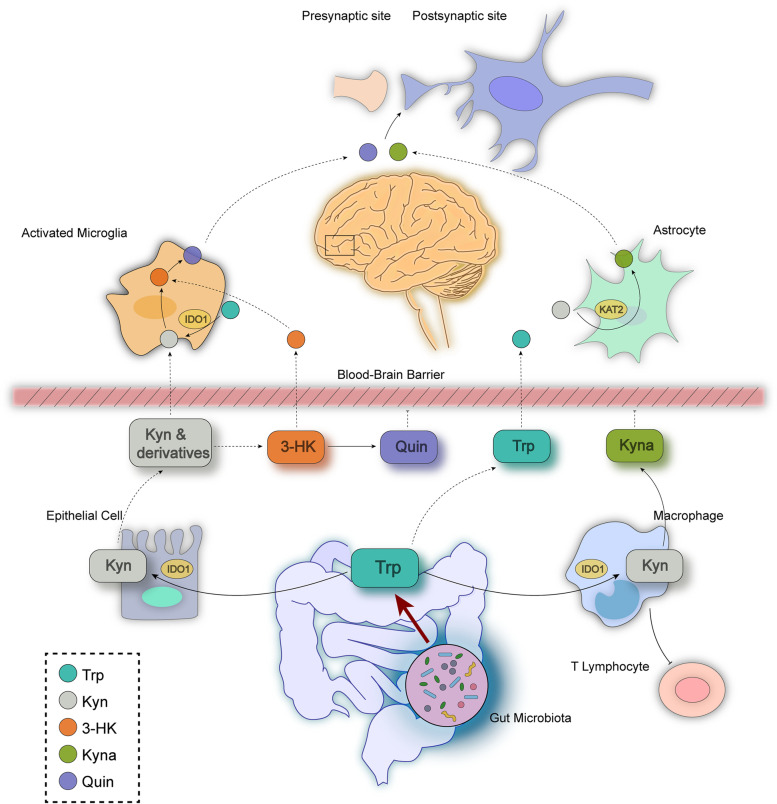
Results: Here, we found the gut microbiota from healthy adolescent volunteers, first diagnosis patients of adolescent depression, and sertraline interveners after first diagnosis displayed significant difference, the relative abundance of Faecalibacterium, Roseburia, Collinsella, Blautia, Phascolarctobacterium, Lachnospiraceae-unclassified decreased in adolescent depressive patients, while restored after sertraline treatment. Of note, the Roseburia abundance exhibited a high efficiency in predicting adolescent depression. Intriguingly, transplantation of the fecal microbiota from healthy adolescent volunteers to the chronic restraint stress (CRS)-induced adolescent depressed mice significantly ameliorated mouse depressive behaviors, in which the Roseburia exerted critical roles, since its effective colonization in the mouse colon resulted in remarkably increased 5-HT level and reciprocally decreased kynurenine (Kyn) toxic metabolites quinolinic acid (Quin) and 3-hydroxykynurenine (3-HK) levels in both the mouse brain and colon. The specific roles of the Roseburia were further validated by the target bacteria transplantation mouse model, Roseburia intestinalis (Ri.) was gavaged to mice and importantly, it dramatically ameliorated CRS-induced mouse depressive behaviors, increased 5-HT levels in the brain and colon via promoting tryptophan hydroxylase-2 (TPH2) or -1 (TPH1) expression. Reciprocally, Ri. markedly restrained the limit-step enzyme responsible for kynurenine (indoleamine2,3-dioxygenase 1, IDO1) and quinolinic acid (3-hydroxyanthranilic acid 3,4-dioxygenase, 3HAO) generation, thereby decreased Kyn and Quin levels. Additionally, Ri. administration exerted a pivotal role in the protection of CRS-induced synaptic loss, microglial activation, and astrocyte maintenance.

Conclusions: This study is the first to delineate the beneficial effects of Ri. on adolescent depression by balancing Trp-derived neurotransmitter metabolism and improving synaptogenesis and glial maintenance, which may yield novel insights into the microbial markers and therapeutic strategies of GBA in adolescent depression. Video Abstract.

Keywords: Adolescent depression; Gut microbiota; Kynurenine; Microbiota-gut-brain axis; Roseburia intestinalis; Tryptophan.


Conflict of interest statement

The authors declare that they have no competing interests.

Figures

Fig. 1
Fig. 1
Alteration of GM in depressive adolescents. A Principal coordinate analysis of β diversity based on weighted UniFrac distances in the HC, DEP, and DEP-sertraline-treated groups. B Shannon, Simpson, and Chao1 indices of α diversity. C Stacked chart of GM composition at the phylum level. D Heatmap of the relative abundances of the top 30 microbiota genera. E Linear discriminant analysis effect size (LEfSe) analysis between group HC and DEP/ group DEP and DEP-sertraline-treated. F ROC curve of Roseburia in predicting adolescent depression according to binary logistic regression model between relative abundance of genus Roseburia and their groups (HC or DEP). Data were displayed as Minimum to Maximum in B. Significant differences among the three groups were determined via Kruskal-Wallis test
Fig. 2
Fig. 2
Alterations of Trp-Kyn pathway-derived metabolites in both serum and urine samples after antidepressant treatment. A Levels of dopamine and partial Trp-Kyn pathway metabolites in serum samples from depressive adolescents before and after sertraline treatment. B Levels of 5-HT and Trp-Kyn pathway metabolites in urine samples from depressive adolescents before and after sertraline treatment. Data were displayed as mean ± SEM. Significant differences before and after sertraline treatment were determined using Student’s t tests for serum 5-HT, Quin, and urine Trp, while Mann-Whitney U tests employed for other components. ***p < 0.001, ****p < 0.0001 vs. the DEP group
Fig. 3
Fig. 3
Correlations between adolescent depression scale scores and Trp-Kyn pathway metabolites. A Correlations between RCADS-25 scores and metabolite levels in serum. Correlations between RCADS-25 and 5-HT and Quin levels in serum were shown as Pearson’s r values. Correlations between RCADS-25 scores and DA, Trp, Kyn, and Kyna levels in serum were shown as Spearman’s r values. B Correlations between RCADS-25 scores and metabolite levels in urine. Correlation between RCADS-25 scores and Trp levels in urine is shown as Pearson’s r value. Correlations between RCADS-25 scores and 5-HT, Kyn, Kyna, and Quin levels in urine were shown as Spearman’s r values
Fig. 4
Fig. 4
FMT from healthy volunteers ameliorated depression-like behaviors in mice. A Schematic illustration of the CRS and FMT procedures, with the respective groups labeled above the timeline. In brief, mice were randomly assigned to the CTR and CRS group after 1 week of acclimatization. The CRS modeling lasted for 2 weeks and was followed by the first behavioral tests (indicated by a blue arrow). Next, the mice in the FMT group (suffixed with -tr) were administered ABX, followed by feces collection (indicated by a red arrow) in order to verify the consumption of the native GM in the recipient mice. During FMT period (2 weeks), the mice in the CTR group were treated with 200 μL sterile PBS, while the CRS mice were further divided into 3 subgroups (CRS, CRS + HC-tr, and CRS + DEP-tr), with the CRS + HC-tr and CRS + DEP-tr mice receiving 200 μL of the feces microbiota suspension from the HC and DEP adolescents, respectively. At the end of the FMT, all mice were examined during the second round of behavioral tests (indicated by a blue arrow). B The first round of behavioral tests with measures including sucrose consumption (%) in the SPT, immobility (%) in the TST and FST, center duration (s) in the OFT, and open arms duration (%) in the EPM test. C The second round of behavioral tests in the four subgroups mice. Data were displayed as mean ± SEM. Significant differences were determined via Student’s t test or one-way ANOVA and Tukey’s multiple comparison procedure. *p < 0.05, **p < 0.01, ****p < 0.0001 vs. the CTR group; ##p < 0.01, ####p < 0.0001 vs. the CRS group; &p < 0.05, &&&&p < 0.0001 vs. the CRS + HC-tr group
Fig. 5
Fig. 5
FMT from healthy volunteers ameliorated the neurotransmitter perturbation by the Trp-Kyn pathway by affecting the rate-limiting enzymes in both the brain and colon. A Levels of Trp-Kyn metabolic pathway-derived neurotransmitters in the mice PFCs. B Levels of Trp-Kyn metabolic pathway-derived neurotransmitters in the mice colons. C Protein expression of the rate-limiting enzymes of the Trp-Kyn Pathway in the mice PFCs and colons. D Statistical plots of the mice PFCs. E Statistical plots of the mice colons. Data were displayed as mean ± SEM. Significant differences were determined via one-way ANOVA and Tukey’s multiple comparison procedure. *p < 0.05, **p < 0.01 vs. the CTR group; #p < 0.05, ##p < 0.01, ###p < 0.001 vs. the CRS group; &p < 0.05, &&p < 0.01, &&&p < 0.001 vs. the CRS + HC-tr group
Fig. 6
Fig. 6
FMT from healthy volunteers improved the synaptic plasticity and glial activities induced by CRS in mouse brains. A, B Colocalization of F-actin and Drebrin along with the respective coefficient analysis. C, D Colocalization of Synapsin1 and PSD95 along with the respective coefficient analysis. E Protein expression of Drebrin, PSD95, and Syn1 along with their statistical graphs. F Protein expression of GFAP and Iba1 along with their statistical graphs. G, H MFI of GFAP and their statistical graphs. I, J MFI of Iba1 and their statistical graphs. Scale bar 50 μm. Data were displayed as mean ± SEM. Significant differences were determined via one-way ANOVA and Tukey’s multiple comparison procedure. *p < 0.05, **p < 0.01, ***p < 0.001 vs. the CTR group; #p < 0.05, ##p < 0.01, ###p < 0.001, ####p < 0.0001 vs. the CRS group; &p < 0.05, &&p < 0.01, &&&p < 0.001 vs. the CRS + HC-tr group
Fig. 7
Fig. 7
FMT from healthy volunteers ameliorated colonic epithelium injuries induced by CRS. A H&E staining of the colons of differently treated mice. Scale bar 50 μm. B Histological score analysis of the differently treated mice. Data were displayed as mean ± SEM. Significant differences were determined via one-way ANOVA and Tukey’s multiple comparison procedure. ***p < 0.001, ****p < 0.0001 vs. the CTR group; #p < 0.05 vs. the CRS group; &&&&p < 0.0001 vs. the CRS + HC-tr group
Fig. 8
Fig. 8
Colonic Ri. colonization improved depression-like behaviors in mice. A Protocol diagram of the time courses of the Ri. transplantation and behavioral tests. The mice were exposed to CRS and then the behavioral tests were conducted. Half of the CTR and CRS mice were selected for Ri. gavaging, while the other mice were administered equal volumes of sterile PBS. The transplantation procedure lasted for 2 weeks. B Establishment of the CRS-induced depressive mice model as determined through SPT, TST, FST, OFT, and EPM test assays. C Effects of Ri. on CRS-induced depressive behaviors in mice. D Abundance of Ri.in the colon and feces of the FMT mice. E FISH-determined Ri. colonization. F Normalized fluorescence intensity analysis of Ri. colonization. Scale bar 50 μm. Data were displayed as mean ± SEM. Except for the one-way ANOVA used in D, other significant differences were determined via Student’s t test or two-way ANOVA and Tukey’s multiple comparison procedure. *p < 0.05, **p < 0.01, ****p < 0.0001 vs. the CTR + PBS group; &p < 0.05, &&p < 0.01, &&&&p < 0.0001 vs. the CTR + Ri group; #p < 0.05, ##p < 0.01, ####p < 0.0001 vs. the CRS + PBS group
Fig. 9
Fig. 9
Ri. treatment improved the perturbation of neurotransmitters from the Trp-Kyn metabolic pathway in mouse brains and colons. A Levels of 5-HT and KP metabolites in the PFCs of the mice. B Levels of 5-HT and KP metabolites in the colons of the mice. C Protein expression of the rate-limiting enzymes of KP metabolism in the mice PFCs and colons. D The statistical plots of the PFCs. E The statistical plots of the colon. Data were displayed as mean ± SEM. Significant differences were determined via two-way ANOVA and Tukey’s multiple comparison procedure. *p < 0.05, **p < 0.01, ***p < 0.001, ****p < 0.0001 vs. the CTR + PBS group; &p < 0.05, &&p < 0.01, &&&&p < 0.0001 vs. the CTR + Ri group; #p < 0.05, ##p < 0.01, ####p < 0.0001 vs. the CRS + PBS group
Fig. 10
Fig. 10
Ri. treatment improved synaptic plasticity and glial activities. A, B Colocalization of F-actin and Drebrin in the mice PFCs along with their statistical graphs. C, D Colocalization of Syn1 and PSD95 along with the coefficient analysis. E Relative protein expression of Drebrin, PSD95, and Syn1 along with their statistical graphs. F Protein expression of GFAP and Iba1 along with their statistical graphs. G, H MFI of GFAP and the statistical graph H. I, J MFI of Iba1 and the statistical graph J. Scale bar 50 μm. Data were displayed as mean ± SEM. Significant differences were determined via two-way ANOVA and Tukey’s multiple comparison procedure. *p < 0.05, **p < 0.01, ***p < 0.001, ****p < 0.0001 vs. the CTR + PBS group; &p < 0.05, &&p < 0.01, &&&p < 0.001, &&&&p < 0.0001 vs. the CTR + Ri group; #p < 0.05, ##p < 0.01, ###p < 0.001, ####p < 0.0001 vs. the CRS + PBS group
Fig. 11
Fig. 11
Ri. treatment reversed colon barrier impairment in CRS mice. A, B H&E staining of the mice colons (scale bar 50 μm) along with the histological score analysis. C, D IF images C and MFI analysis D of Occludin; scale bar 20 μm. E mRNA expression of ISC markers. Data were displayed as mean ± SEM. Significant differences were determined via two-way ANOVA and Tukey’s multiple comparison procedure. *p < 0.05, **p < 0.01, ***p < 0.001, ****p < 0.0001 vs. the CTR + PBS group; &p < 0.05, &&&p < 0.001, &&&&p < 0.0001 vs. the CTR + Ri group; #p < 0.05, ##p < 0.01 vs. the CRS + PBS group
Fig. 12
Fig. 12
A schematic depicting the roles of the gut microbiota in CRS-induced depression-like behavioral changes along the microbiota-gut-brain axis. The abundance of Ri.is rich in healthy adolescents, decreased in adolescents with depression, and reversed after sertraline treatment. The GM (from the feces of healthy adolescents and consisting of Ri.) exerts beneficial effects by ameliorating CRS-induced perturbation of the Trp-Kyn metabolic pathway. These effects are characterized by the increased conversion of Trp to 5-HT, and reciprocally, decreased toxic metabolite levels (Quin and 3-HK) that mechanistically unravel as the levels of TPH2/1 and KAT2 increase, along with decreased expression of IDO1 and 3HAO. The ameliorated colonic epithelial cell impairment combined with the improved KP metabolism driven by Ri. facilitated the pronounced protection of synaptic plasticity and improved glial activities, thus providing a novel therapeutic strategy for depression intervention

References

    1. Ye X, Wang D, Zhu H, Wang D, Li J, Tang Y, Wu J. Gut microbiota changes in patients with major depressive disorder treated with vortioxetine. Front Psychiatry. 2021;12:641491. doi: 10.3389/fpsyt.2021.641491. - DOI - PMC - PubMed
    1. Weersing VR, Shamseddeen W, Garber J, Hollon SD, Clarke GN, Beardslee WR, et al. Prevention of depression in at-risk adolescents: predictors and moderators of acute effects. J Am Acad Child Adolesc Psychiatry. 2016;55:219–226. doi: 10.1016/j.jaac.2015.12.015. - DOI - PMC - PubMed
    1. Weissman MM, Klerman GL. The chronic depressive in the community: unrecognized and poorly treated. Compr Psychiatry. 1977;18:523–532. doi: 10.1016/S0010-440X(97)90002-X. - DOI - PubMed
    1. Dwyer JB, Stringaris A, Brent DA, Bloch MH. Annual Research Review: Defining and treating pediatric treatment-resistant depression. J Child Psychol Psychiatry. 2020;61:312–332. doi: 10.1111/jcpp.13202. - DOI - PMC - PubMed
    1. Miller L, Campo JV. Depression in adolescents. N Engl J Med. 2021;385:445–449. doi: 10.1056/NEJMra2033475. - DOI - PubMed

Publication types