. 2023 Jun 30;20(3):036039.
doi: 10.1088/1741-2552/ace07e.

Chronic stability of a neuroprosthesis comprising multiple adjacent Utah arrays in monkeys

Affiliations

Chronic stability of a neuroprosthesis comprising multiple adjacent Utah arrays in monkeys

Xing Chen et al. J Neural Eng. .

Abstract

Objective. Electrical stimulation of visual cortex via a neuroprosthesis induces the perception of dots of light ('phosphenes'), potentially allowing recognition of simple shapes even after decades of blindness. However, restoration of functional vision requires large numbers of electrodes, and chronic, clinical implantation of intracortical electrodes in the visual cortex has only been achieved using devices of up to 96 channels. We evaluated the efficacy and stability of a 1024-channel neuroprosthesis system in non-human primates (NHPs) over more than 3 years to assess its suitability for long-term vision restoration.Approach.We implanted 16 microelectrode arrays (Utah arrays) consisting of 8 × 8 electrodes with iridium oxide tips in the primary visual cortex (V1) and visual area 4 (V4) of two sighted macaques. We monitored the animals' health and measured electrode impedances and neuronal signal quality by calculating signal-to-noise ratios of visually driven neuronal activity, peak-to-peak voltages of the waveforms of action potentials, and the number of channels with high-amplitude signals. We delivered cortical microstimulation and determined the minimum current that could be perceived, monitoring the number of channels that successfully yielded phosphenes. We also examined the influence of the implant on a visual task after 2-3 years of implantation and determined the integrity of the brain tissue with a histological analysis 3-3.5 years post-implantation.Main results. The monkeys remained healthy throughout the implantation period and the device retained its mechanical integrity and electrical conductivity. However, we observed decreasing signal quality with time, declining numbers of phosphene-evoking electrodes, decreases in electrode impedances, and impaired performance on a visual task at visual field locations corresponding to implanted cortical regions. Current thresholds increased with time in one of the two animals. The histological analysis revealed encapsulation of arrays and cortical degeneration. Scanning electron microscopy on one array revealed degradation of IrOxcoating and higher impedances for electrodes with broken tips.Significance. Long-term implantation of a high-channel-count device in NHP visual cortex was accompanied by deformation of cortical tissue and decreased stimulation efficacy and signal quality over time. We conclude that improvements in device biocompatibility and/or refinement of implantation techniques are needed before future clinical use is feasible.

Keywords: Utah arrays; V1; V4; blindness; microstimulation; neuroprosthesis; non-human primate.


Conflict of interest statement

Conflict of interest

P R and X C are co-founders and shareholders of a neurotechnology start-up, Phosphoenix BV (Netherlands) (https://phosphoenix.nl).

Figures

Figure 1
Figure 1. 1024-channel neuroprosthesis.
(a), Photograph of the implant, consisting of a 1024-channel cranial pedestal connected to 16 Utah arrays. (b), Locations of arrays in areas V1 and V4 of the visual cortex in the left hemisphere of monkey L. (c), Photograph of implanted arrays and wire bundles, taken during surgery in monkey L. Arrays are labelled in black. A: anterior; P: posterior; L: left; R: right.
Figure 2
Figure 2. Current thresholding task for phosphene perception.
(a), Illustration of the task used to determine the current thresholds. The monkey maintained fixation on a red dot at the centre of the screen. After an interval that ranged from 300 to 700 ms in duration, microstimulation at various current amplitudes was delivered to V1 via a single electrode, and the monkey made a saccade to the phosphene within 250 ms of stimulation onset to obtain a reward. During catch trials, no stimulation was delivered, and the animal was rewarded for maintaining fixation. (b), Left: mean current threshold across channels over time, relative to implantation date. Grey shaded areas show SD. Right: number of channels yielding phosphene perception at this date or later (green); cumulative number of ineffective channels (red). Current thresholds increased significantly with time in monkey L (t(26) = −5.1295, p < .001). (c), Current thresholds for a subset of electrodes shown at their corresponding location of implantation in the cortex, during an early (left) and late (right) epoch, which have been indicated by grey bars and arrows in panel (b). Green indicates phosphene perception; red indicates no perception. White indicates channels for which current thresholding was not attempted during the respective period. Note that the array positions on the cortex were less orderly than illustrated here (see figure 1(c)).
Figure 3
Figure 3. Performance on the visual detection task.
(a), Illustration of the task. The monkey initiated the trial by fixating on a red dot at the centre of the screen. After 200 ms, a small grey circle stimulus was presented and the monkey was rewarded for making a saccade to the stimulus within 200 ms of its onset. (b) and (c), Performance on the visual detection task, showing accuracy (b) and reaction time (c) at each stimulus location. The black line demarcates the region of the visual field corresponding to the retinotopy of the implanted cortex. Significant decreases in accuracy (monkey L: t(217) = 23.17, p < .001; monkey A: t(134) = 14.20, p < .001) and increases in reaction time (monkey L: t(217) = −20.07, p < .001; monkey A: t(134) = −10.61, p < .001) were observed.
Figure 4
Figure 4. Checkerboard stimulus used to assess signal quality.
(a), Illustration of the task. The monkey initiated a trial by fixating on a red dot at the centre of the screen. After 400 ms, a full-screen checkerboard stimulus was presented for 400 ms, and the monkey was rewarded for maintaining fixation. (B)–(D), Data from an example channel (channel 40 on array 11, marked by red circles in figures 5(a) and (c)) during early and late sessions (91 and 279 d post-implantation, respectively). (b), Raw data (band-pass filtered from 500 to 9000 Hz) on 5 example trials, showing visually evoked responses. Grey: stimulus presentation from 0 to 400 ms. (c), Mean visually evoked response across trials, used to calculate the SNR for each session (corresponding to data marked by red circles in figures 5(a) and (c)). Grey: stimulus presentation from 0 to 400 ms. (d), Snippets used to calculate peak-to-peak voltage of action potentials, and mean waveform and SD (black dotted line and grey shaded areas) across all snippets from the session.
Figure 5
Figure 5. Changes in signal quality and electrode impedance with time.
(a), SNR of the visually driven response elicited by a checkerboard stimulus in monkey L (upper row) and monkey A (lower row) relative to implantation date. Violin plots show data averaged across 6 time-bins. Blue line: best-fit line using linear regression. Red circles indicate the example channel shown in figures 4(b)–(d). SNR decreased significantly with time (monkey L: F(1,4094) = 1504, p < .001; monkey A: F(1,4094) = 1327, p < .001). (b), SNR values across all arrays during an example early (left) and late (right) session (indicated by the arrows in (a)). (c), Peak-to-peak voltages of action potentials relative to the implantation date. Red circles indicate the example channel shown in figures 4(b)–(d). The number of high-amplitude channels decreased significantly with time (monkey L: χ(1,1024) = 369.5, p < .001; monkey (a): χ(1,1024) = 172.4, p < .001). (d), Peak-to-peak voltage at each electrode during example early and late sessions. (e), Impedance values as a function of time after the implantation, for electrodes with an impedance of <2000 kOhms, measured at 1 kHz. Impedance on this subset of electrodes decreased significantly with time (monkey L: F(1,4009) = 36.6, p < .001; monkey A: F (1,4094) = 2633, p < .001). (f): Impedance values during example early and late sessions.
Figure 6
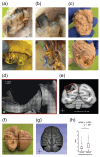
Figure 6. Tissue response and histology.
(a), Photos of the brain and implant in monkey (a). Top: encapsulated arrays and wire bundles. Bottom: rows of arrays after explantation. (b), Top: close-up of partially encapsulated arrays. Bottom: tissue glue on explanted array and wire bundle, indicated by green arrows. (c), Photographs showing the surface of the visual cortex in monkeys L (top) and (a) (bottom). (d), Histological slice in monkey L, revealing lesioned cortex at implantation location, spanning the entire depth of dorsal V1 and underlying white matter. White lines demarcate white- and grey-matter boundaries. In the macaque brain, V1 cortex is folded, with part of V1 at the surface of the brain and the folded part forming a second layer underneath. The implant caused a large lesion in V1 cortex, revealing the underlying folded V1 cortex (layers of cortex are labelled). (e), Coronal slice from the co-registered NMT v2 template shown in G), corresponding to the dotted line in (f) and plane in (g). The overlay shows the approximate location of the histological slice from (d). S: superior; I: inferior; L: left; R: right. F, Fixed and extracted partial brain from monkey L (including occipital and parietal lobes), with visible damage to the implanted left hemisphere. Dotted line indicates approximate location of slice made during histology. A: anterior; P: posterior. G, 3D rendering of NMT v2 MRI template, registered to anatomical T1-weighted brain scan for monkey L before electrode array implantation. H, SNR obtained on electrodes with exposed versus encapsulated tips, combined across 10 arrays (5 per monkey). SNR was significantly higher on electrodes with exposed tips t(638) = −9.330, p < .001).
Figure 7
Figure 7. Explanted arrays.
(a), Photograph of array 8, explanted from monkey L. (b), Close-up SEM image of array 8. (c), Scanning electron microscopy images of example electrodes on this array with missing or damaged IrOx layer, broken Si tip (middle), and pitting of Si surface (middle inset). (d), Photograph of arrays explanted from monkey (a).

References

    1. Teutsch SM, McCoy MA, Woodburyand RB, Welp A, editors. National Academies of Sciences, Engineering, and Medicine. Making Eye Health a Population Health Imperative: Vision for Tomorrow. National Academies Press; Washington, DC: 2016. - PubMed
    1. Roska B, Sahel J-A. Restoring vision. Nature. 2018;557:359–67. - PubMed
    1. Lewis PM, Rosenfeld JV. Electrical stimulation of the brain and the development of cortical visual prostheses: an historical perspective. Brain Res. 2016;1630:208–24. - PubMed
    1. Button J, Putnam T. Visual responses to cortical stimulation in the blind. J Iowa Med Soc. 1962;52:17–21.
    1. Brindley GS, Lewin WS. The sensations produced by electrical stimulation of the visual cortex. J Physiol. 1968;196:479–93. doi: 10.1113/jphysiol.1968.sp008519. - DOI - PMC - PubMed

Publication types

LinkOut - more resources