. 2023 Jun 30;39(39 Suppl 1):i413-i422.
doi: 10.1093/bioinformatics/btad271.

An intrinsically interpretable neural network architecture for sequence-to-function learning

Affiliations

An intrinsically interpretable neural network architecture for sequence-to-function learning

Ali Tuğrul Balcı et al. Bioinformatics. .

Abstract

Motivation: Sequence-based deep learning approaches have been shown to predict a multitude of functional genomic readouts, including regions of open chromatin and RNA expression of genes. However, a major limitation of current methods is that model interpretation relies on computationally demanding post hoc analyses, and even then, one can often not explain the internal mechanics of highly parameterized models. Here, we introduce a deep learning architecture called totally interpretable sequence-to-function model (tiSFM). tiSFM improves upon the performance of standard multilayer convolutional models while using fewer parameters. Additionally, while tiSFM is itself technically a multilayer neural network, internal model parameters are intrinsically interpretable in terms of relevant sequence motifs.

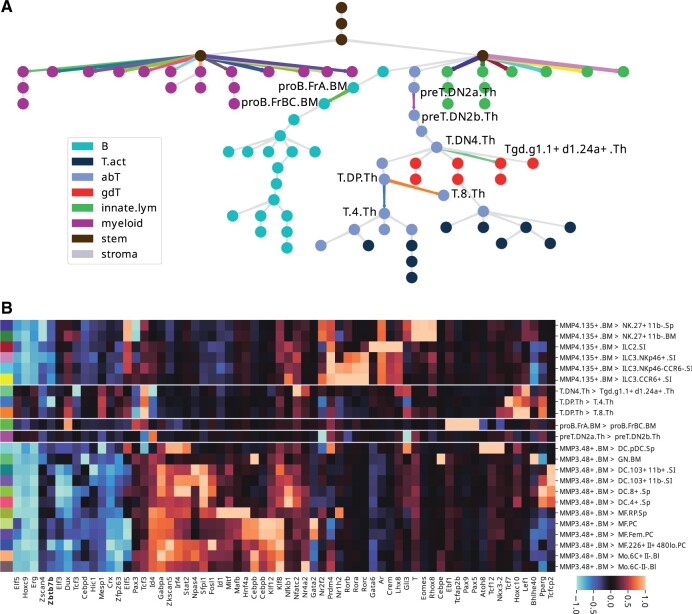
Results: We analyze published open chromatin measurements across hematopoietic lineage cell-types and demonstrate that tiSFM outperforms a state-of-the-art convolutional neural network model custom-tailored to this dataset. We also show that it correctly identifies context-specific activities of transcription factors with known roles in hematopoietic differentiation, including Pax5 and Ebf1 for B-cells, and Rorc for innate lymphoid cells. tiSFM's model parameters have biologically meaningful interpretations, and we show the utility of our approach on a complex task of predicting the change in epigenetic state as a function of developmental transition.

Availability and implementation: The source code, including scripts for the analysis of key findings, can be found at https://github.com/boooooogey/ATAConv, implemented in Python.


Conflict of interest statement

None declared.

Figures

Figure 1.
Figure 1.
tiSFM improves on prediction accuracy when compared to the current state-of-the-art. (A) A graphical display of the architecture of tiSFM. (B) The improvement of tiSFM, measured via the change in R2 on the full model; additionally, different iterations of tiSFM were tested with the inclusion/exclusion of certain model components in order to weigh their contribution to the overall performance. (C) similar to (B), but without kernel fine-tuning.
Figure 2.
Figure 2.
tiSFM consistently finds motifs that are relevant to immune cell differentiation. (A) The final layer of a single fully trained model, after the rows were normalized to [−1, 1], while preserving the sparsity. The five motifs with the highest absolute weight for each cell-type are shown. (B) Inclusion ratio was defined as the number of times a motif appeared among the top-10 motifs across the 10-folds in our 10-fold cross-validation procedure, with the highest weights in the final layer for each cell-type. The motifs included in more than 50% of the models are shown here.
Figure 3.
Figure 3.
(A) A scatter plot of pooling parameters versus the information content (IC) calculated from motif PWMs. The color annotation of the points corresponds to the final layer coefficients for B-cell, OCR activity prediction. The five motifs with the highest absolute weight for B cells are annotated (Ebf1, Pax5, Mef2a, Pou2f1, Bbx) along with some outliers to the pooling/IC trend (Pax4, Bcl6, Rela, Ctcf). (B) A scatter plot contrasting the coefficients in the final linear layer (pooled from absolute values of the cell-type prediction coefficients corresponding to the same TF, then the coefficients are normalized to [−1, 1], range preserving the sparsity) with total contribution to the Interaction layer. The two are notably different, only one TF influences the other TFs while contributing to the cell-type prediction significantly, as some TFs contribute far more to the interaction matrix but have near 0 linear coefficients.
Figure 4.
Figure 4.
Sparsity constraints improve the performance for the most cell-types and increase interpretability of the tiSFM. (A) MSE versus the MCP hyperparameter (the second hyperparameter is fixed at 3). The lines for every cell-type and the overall performance are assigned a color. The vertical line indicates the hyperparameter that resulted in the best performance for the corresponding cell-type. (B) Coefficients versus the MCP hyperparameter path plot. The best model in terms of MSE is marked by a dashed vertical line. Colored, are the top-9 motifs with the highest absolute coefficients from the best model, and the black lines are the motifs with 0 coefficient in the best model. (C) Median motif redundancy as a function of regularization. We observe that as expected increasing regularization decreases motif redundancy (see Section 2 for motif similarity calculation). Path plots for other cell-types are in Supplementary Fig. S3.
Figure 5.
Figure 5.
tiSFM predictions and TF contributions applied to the problem of predicting differentiation transitions. (A) The model predicts the output corresponding to each edge along the differentiation tree computed as the difference between child and parent. Edges are scaled according to R2 and those with a value of >0.05 are selected for TF contribution analysis depicted in the color matched heatmap (B). Highly predictable transitions in the lymphocyte lineage are highlighted on the lineage tree with cell-type identifiers. The heatmap includes motifs that are among top five with the highest absolute coefficients for at least one target.

Update of

References

    1. Alipanahi B, Delong A, Weirauch MT. et al. Predicting the sequence specificities of DNA- and RNA-binding proteins by deep learning. Nat Biotechnol 2015;33:831–8. - PubMed
    1. Avsec Ž, Agarwal V, Visentin D. et al. Effective gene expression prediction from sequence by integrating long-range interactions. Nat Methods 2021a;18:1196–203. - PMC - PubMed
    1. Avsec Ž, Weilert M, Shrikumar A. et al. Base-resolution models of transcription-factor binding reveal soft motif syntax. Nat Genet 2021b;53:354–66. - PMC - PubMed
    1. Banovich NE, Li YI, Raj A. et al. Impact of regulatory variation across human iPSCs and differentiated cells. Genome Res 2017;28:122–31. - PMC - PubMed
    1. Basu J, Reis BS, Peri S. et al. Essential role of a ThPOK autoregulatory loop in the maintenance of mature CD4+ T cell identity and function. Nat Immunol 2021;22:969–82. - PMC - PubMed

Publication types