

Bakdrive: identifying a minimum set of bacterial species driving interactions across multiple microbial communities
- PMID: 37387148
- PMCID: PMC10311314
- DOI: 10.1093/bioinformatics/btad236
Bakdrive: identifying a minimum set of bacterial species driving interactions across multiple microbial communities
Abstract
Motivation: Interactions among microbes within microbial communities have been shown to play crucial roles in human health. In spite of recent progress, low-level knowledge of bacteria driving microbial interactions within microbiomes remains unknown, limiting our ability to fully decipher and control microbial communities.
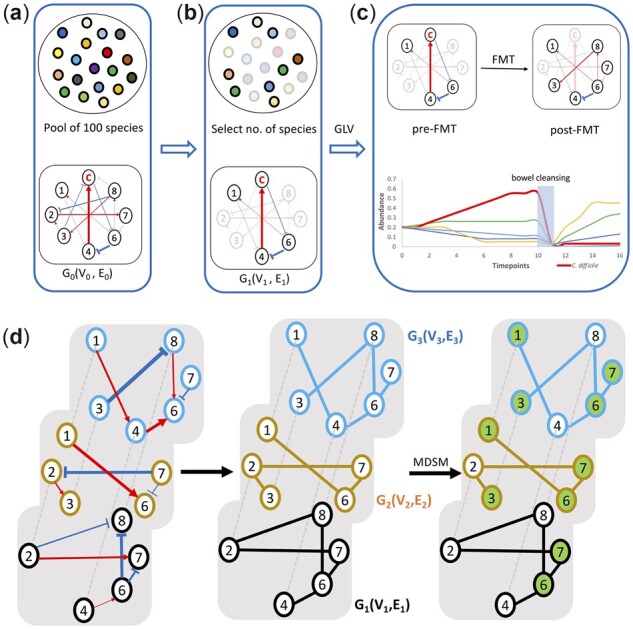
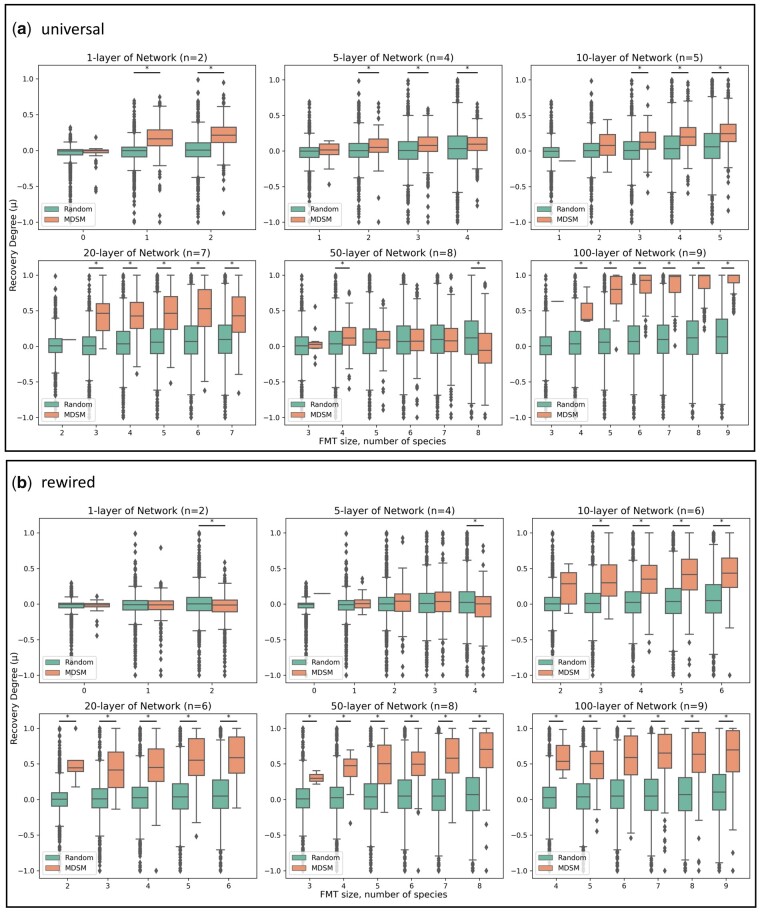
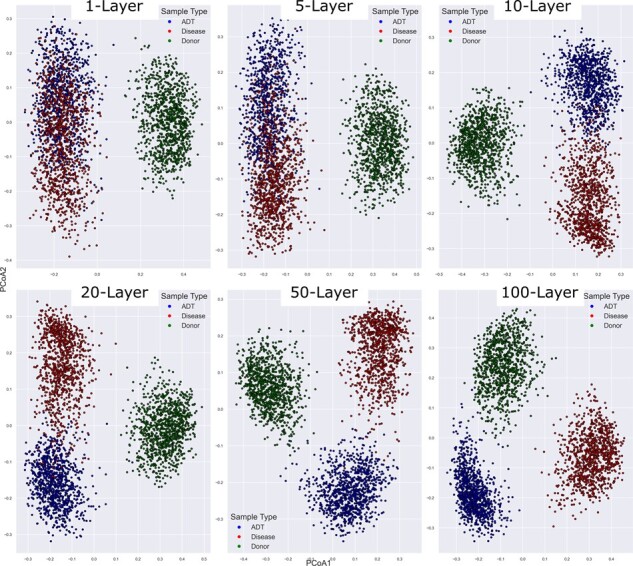
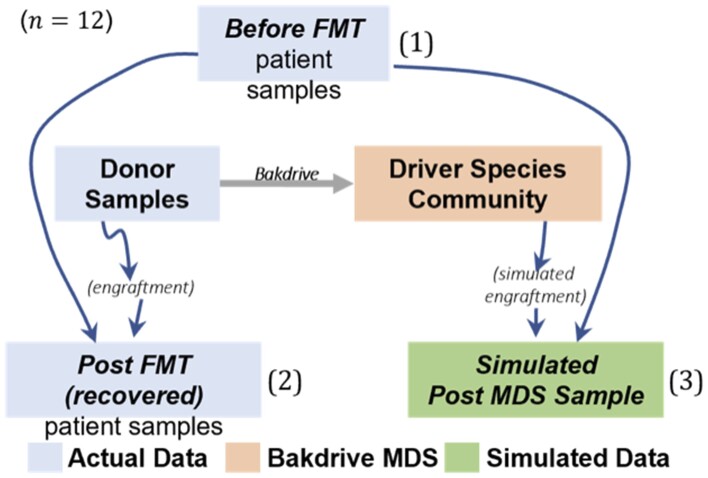
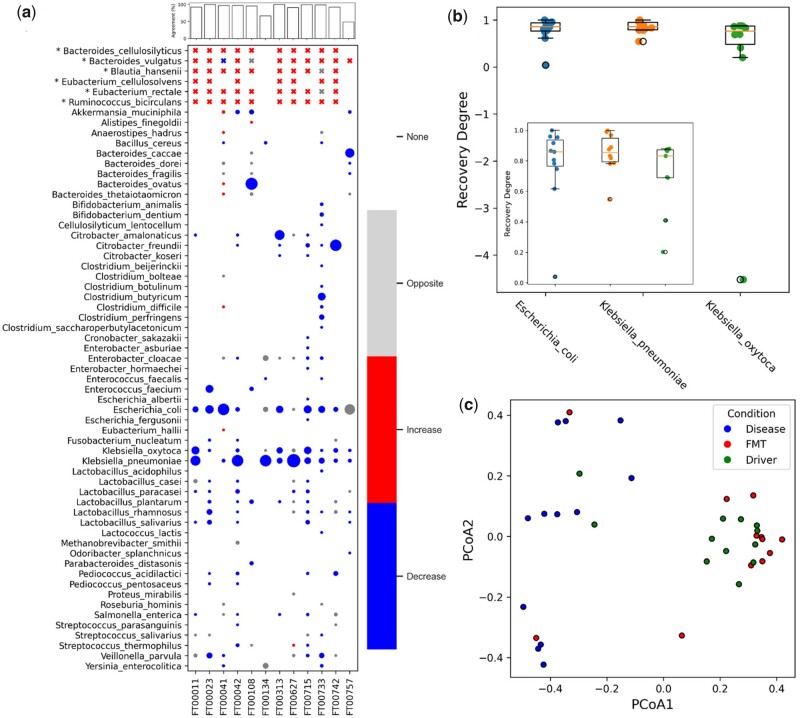
Results: We present a novel approach for identifying species driving interactions within microbiomes. Bakdrive infers ecological networks of given metagenomic sequencing samples and identifies minimum sets of driver species (MDS) using control theory. Bakdrive has three key innovations in this space: (i) it leverages inherent information from metagenomic sequencing samples to identify driver species, (ii) it explicitly takes host-specific variation into consideration, and (iii) it does not require a known ecological network. In extensive simulated data, we demonstrate identifying driver species identified from healthy donor samples and introducing them to the disease samples, we can restore the gut microbiome in recurrent Clostridioides difficile (rCDI) infection patients to a healthy state. We also applied Bakdrive to two real datasets, rCDI and Crohn's disease patients, uncovering driver species consistent with previous work. Bakdrive represents a novel approach for capturing microbial interactions.
Availability and implementation: Bakdrive is open-source and available at: https://gitlab.com/treangenlab/bakdrive.
© The Author(s) 2023. Published by Oxford University Press.
Conflict of interest statement
None declared.
Figures
Similar articles
-
A novel graph theoretical approach for modeling microbiomes and inferring microbial ecological relationships.BMC Genomics. 2019 Dec 20;20(Suppl 11):945. doi: 10.1186/s12864-019-6288-7. BMC Genomics. 2019. PMID: 31856723 Free PMC article.
-
Strain Structure and Dynamics Revealed by Targeted Deep Sequencing of the Honey Bee Gut Microbiome.mSphere. 2020 Aug 26;5(4):e00694-20. doi: 10.1128/mSphere.00694-20. mSphere. 2020. PMID: 32848005 Free PMC article.
-
Integrative multi-omics deciphers the spatial characteristics of host-gut microbiota interactions in Crohn's disease.Cell Rep Med. 2023 Jun 20;4(6):101050. doi: 10.1016/j.xcrm.2023.101050. Epub 2023 May 11. Cell Rep Med. 2023. PMID: 37172588 Free PMC article.
-
Data Analysis for Gut Microbiota and Health.Adv Exp Med Biol. 2017;1028:79-87. doi: 10.1007/978-981-10-6041-0_5. Adv Exp Med Biol. 2017. PMID: 29058217 Review.
-
Fecal microbiota transplantation for treatment of patients with recurrent Clostridioides difficile infection.Expert Rev Anti Infect Ther. 2020 Jul;18(7):669-676. doi: 10.1080/14787210.2020.1752192. Epub 2020 Apr 12. Expert Rev Anti Infect Ther. 2020. PMID: 32266848
Cited by
-
Gut Microbiome dysbiosis and immune activation correlate with somatic and neuropsychiatric symptoms in COVID-19 patients.J Transl Med. 2025 Mar 14;23(1):327. doi: 10.1186/s12967-025-06348-y. J Transl Med. 2025. PMID: 40087795 Free PMC article.
-
Inferring microbial interactions with their environment from genomic and metagenomic data.PLoS Comput Biol. 2023 Nov 13;19(11):e1011661. doi: 10.1371/journal.pcbi.1011661. eCollection 2023 Nov. PLoS Comput Biol. 2023. PMID: 37956203 Free PMC article.
-
A survey of computational approaches for characterizing microbial interactions in microbial mats.Genome Biol. 2025 Jun 16;26(1):168. doi: 10.1186/s13059-025-03634-2. Genome Biol. 2025. PMID: 40524188 Free PMC article. Review.
References
-
- Banerjee S, Schlaeppi K, van der Heijden MGA.. Keystone taxa as drivers of microbiome structure and functioning. Nat Rev Microbiol 2018;16:567–76. - PubMed
-
- Basile A, Campanaro S, Kovalovszki A. et al. Revealing metabolic mechanisms of interaction in the anaerobic digestion microbiome by flux balance analysis. Metab Eng 2020;62:138–49. - PubMed
Publication types
MeSH terms
Grants and funding
LinkOut - more resources
Full Text Sources
Medical
Research Materials
Miscellaneous
