Review
. 2023 Nov 1;43(6):531-538.
doi: 10.3343/alm.2023.43.6.531. Epub 2023 Jun 30.

Clot Waveform Analysis for Hemostatic Abnormalities

Affiliations
Review

Clot Waveform Analysis for Hemostatic Abnormalities

Hideo Wada et al. Ann Lab Med. .

Abstract

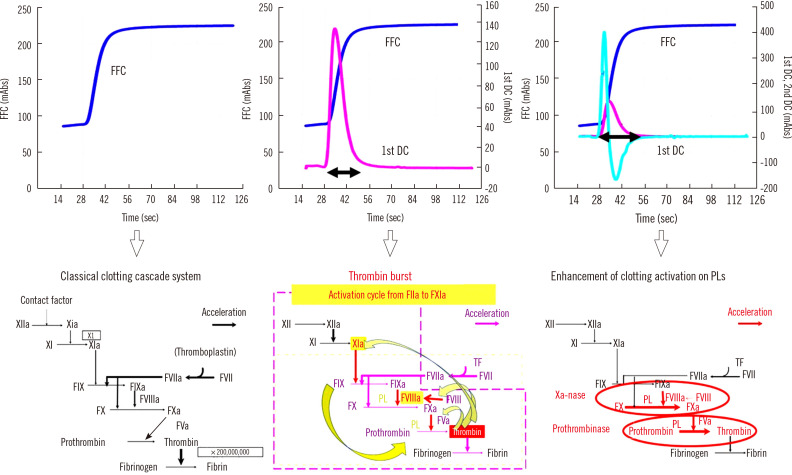
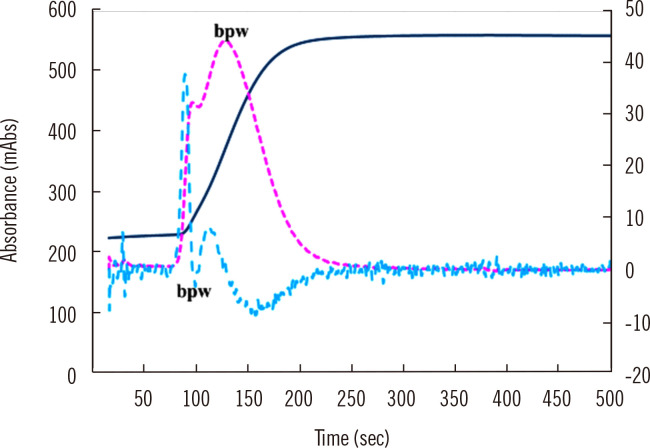
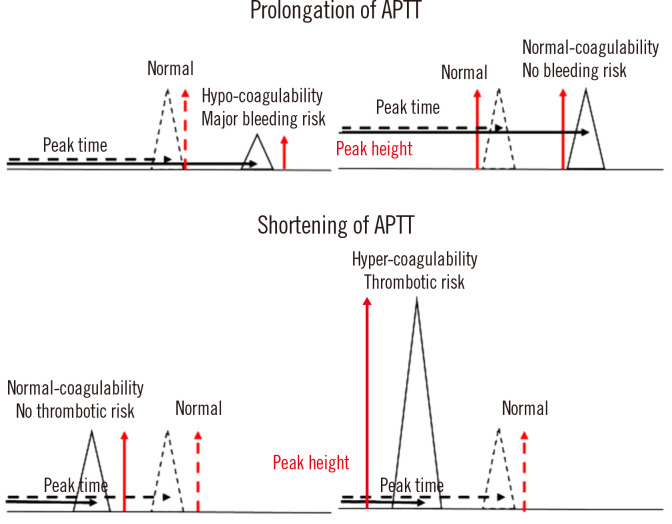
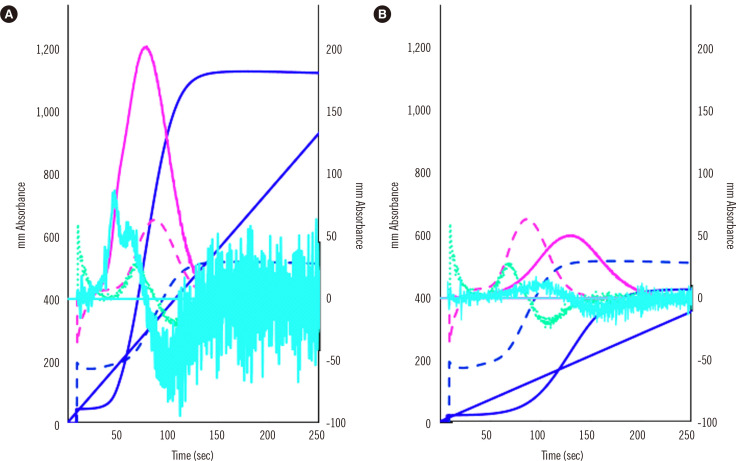
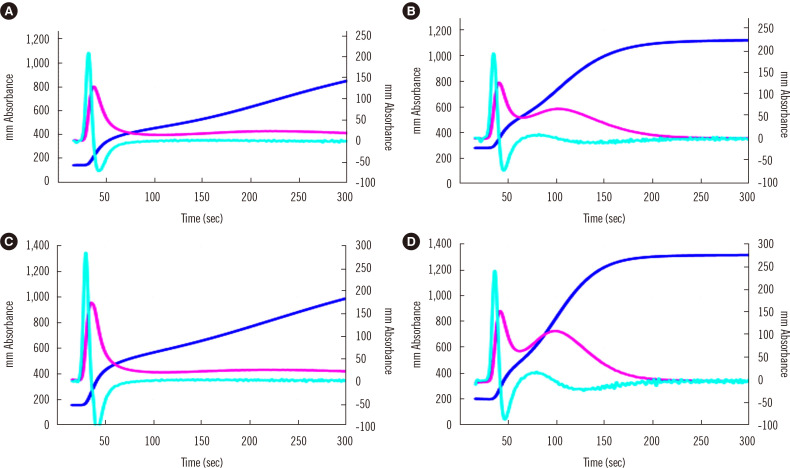
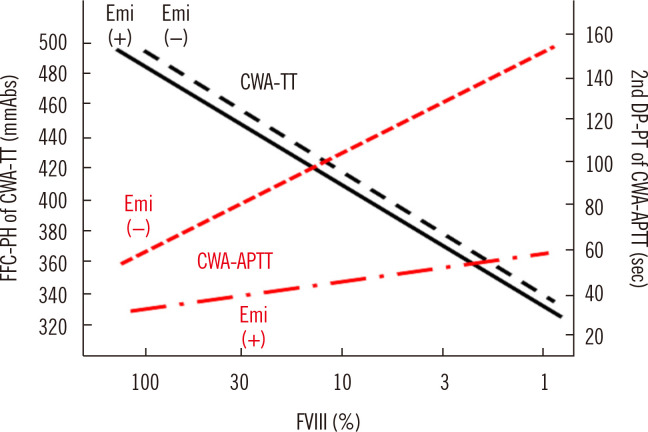
Clot waveform analysis (CWA) observes changes in transparency in a plasma sample based on clotting tests such as activated partial thromboplastin time (APTT), prothrombin time (PT), and thrombin time (TT). Evidence indicates that not only an abnormal waveform but also peak times and heights in derivative curves of CWA are useful for the evaluation of hemostatic abnormalities. Modified CWA, including the PT with APTT reagent, dilute PT (small amount of tissue factor [TF]-induced clotting factor IX [FIX] activation; sTF/FIXa), and dilute TT, has been proposed to evaluate physiological or pathological hemostasis. We review routine and modified CWA and their clinical applications. In CWA-sTF/FIXa, elevated peak heights indicate hypercoagulability in patients with cancer or thrombosis, whereas prolonged peak times indicate hypocoagulability in several conditions, including clotting factor deficiency and thrombocytopenia. CWA-dilute TT reflects the thrombin burst, whereas clot-fibrinolysis waveform analysis reflects both hemostasis and fibrinolysis. The relevance and usefulness of CWA-APTT and modified CWA should be further investigated in various diseases.

Keywords: Clot waveform analysis; Fibrinolysis; Hemostasis; Hemostatics; Indicators and reagents; Prothrombin time; Thrombin; Thrombocytopenia; Thrombophilia; Thrombosis.


Conflict of interest statement

CONFLICTS OF INTEREST

CWA measurements were partially supported by Instrumentation Laboratory Japan (Tokyo, Japan). Further, the authors declare no conflicts of interest.

Figures

Fig. 1
Fig. 1
Normal CWA-APTT with a FFC, 1st DC, and 2nd DC and three mechanisms of hemostasis. The horizontal double-headed arrow indicates peak width (period of thrombin burst). Abbreviations: FFC, fibrin formation curve; 1st DC, first derivative curve; 2nd DC, second derivative curve; TF, tissue factor; PLs, phospholipids; FXI, clotting factor XI; FXIa, activated FXI.
Fig. 2
Fig. 2
Abnormal waveform in CWA-APTT. The fibrin formation curve is indicated in blue, the 1st DC in red, and the 2nd DC in green. The 1st and 2nd DCs show a bpw. Abbreviations: CWA, clot waveform analysis; APTT, activated partial thromboplastin time; bpw, biphasic waveform; DC, derivative curve.
Fig. 3
Fig. 3
Abnormal APTT and peak height in CWA-APTT. The solid line represents a patient sample, and the dotted line represents a sample from a healthy volunteer. A decreased peak height indicates a major bleeding risk, whereas an increased peak height indicates hypercoagulability. Abbreviations: APTT, activated partial thromboplastin time; CWA, clot waveform analysis.
Fig. 4
Fig. 4
CWA-sTF/FIXa of a patient with a neoplasm and acute cerebral infarction (A) and a patient with thrombocytopenia due to aplastic anemia (B). The fibrin formation curve is indicated in dark blue, the 1st DC (velocity) in pink, and the 2nd DC (acceleration) in light blue. The solid line represents a patient sample, and the dotted line represents a sample from a healthy volunteer. The peak heights of the three curves were significantly higher for patient (A) than for the healthy volunteer and significantly lower for patient (B) than for the healthy volunteer. Abbreviations: CWA, clot waveform analysis; DC, derivative curve; sTF/FIXa, small amount of tissue factor-induced clotting factor IX activation.
Fig. 5
Fig. 5
CWA-TT using PPP (A and C) or PRP (B and D) from a healthy volunteer (A and B) and a patient with cancer (C and D). The fibrin formation curve is indicated in dark blue, the 1st DC (velocity) in pink, and the 2nd DC (acceleration) in light blue. The second peak of the 1st DC is significantly higher for PRP than for PPP and for the patient with cancer than for the healthy volunteer. Abbreviations: CWA, clot waveform analysis; DC, derivative curve; TT, thrombin time; PPP, platelet-poor plasma; PRP, platelet-rich plasma.
Fig. 6
Fig. 6
Standard curves for the FVIII assay by CWA-TT and CWA-APTT in the presence or absence of Emi. The standard curve for CWA-TT is similar between Emi (+) and Emi (–), whereas that for CWA-APTT differs between Emi (+) and Emi (–). Abbreviations: FFC, fibrin formation curve; PH, peak height; CWA, clot waveform analysis; TT, thrombin time; DC, derivative curve; PT, peak time; APTT, activated partial thromboplastin time; Emi, emicizumab.

References

    1. Wada H, Matsumoto T, Ohishi K, Shiraki K, Shimaoka M. Update on the clot waveform analysis. Clin Appl Thromb Hemost. 2020;26:1076029620912027. doi: 10.1177/1076029620912027. - DOI - PMC - PubMed
    1. Sevenet PO, Depasse F. Clot waveform analysis: where do we stand in 2017? Int J Lab Hematol. 2017;39:561–8. doi: 10.1111/ijlh.12724. - DOI - PubMed
    1. Nogami K. Clot waveform analysis for monitoring hemostasis. Semin Thromb Hemost. 2022 doi: 10.1055/s-0042-1756706. doi: 10.1055/s-0042-1756706 (Online ahead of print) - DOI - PubMed
    1. Arai S, Kamijo T, Hayashi F, Shinohara S, Arai N, Sugano M, et al. Screening method for congenital dysfibrinogenemia using clot waveform analysis with the Clauss method. Int J Lab Hematol. 2021;43:281–9. doi: 10.1111/ijlh.13358. - DOI - PubMed
    1. Wada H, Ichikawa Y, Ezaki M, Matsumoto T, Yamashita Y, Shiraki K, et al. The reevaluation of thrombin time using a clot waveform analysis. J Clin Med. 2021;10:4840. doi: 10.3390/jcm10214840. - DOI - PMC - PubMed