. 2023 Jun 14:14:1145481.
doi: 10.3389/fimmu.2023.1145481. eCollection 2023.

PTPRC promoted CD8+ T cell mediated tumor immunity and drug sensitivity in breast cancer: based on pan-cancer analysis and artificial intelligence modeling of immunogenic cell death-based drug sensitivity stratification

Affiliations

PTPRC promoted CD8+ T cell mediated tumor immunity and drug sensitivity in breast cancer: based on pan-cancer analysis and artificial intelligence modeling of immunogenic cell death-based drug sensitivity stratification

Pengping Li et al. Front Immunol. .

Abstract

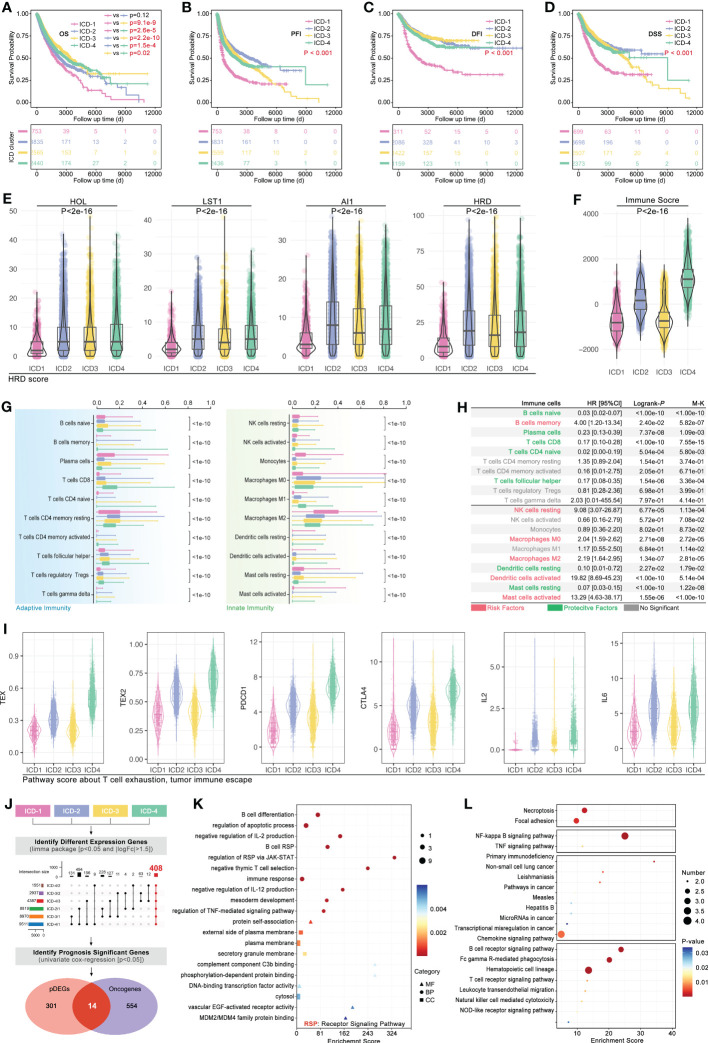
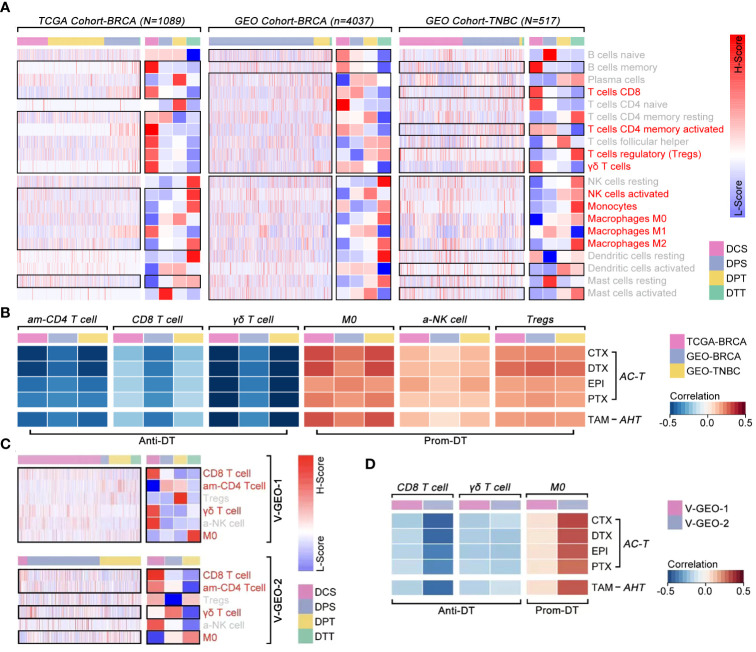
Background: Immunogenic cell death (ICD) is a result of immune cell infiltration (ICI)-mediated cell death, which is also a novel acknowledgment to regulate cellular stressor-mediated cell death, including drug therapy and radiotherapy.

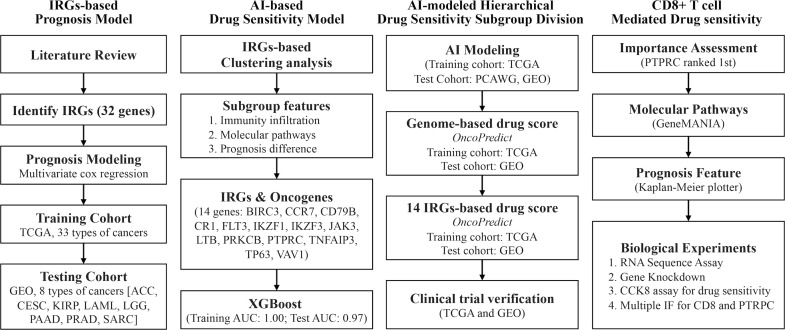
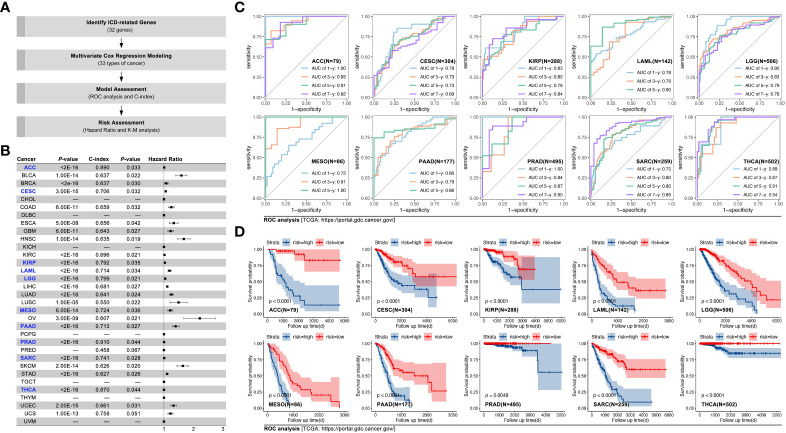
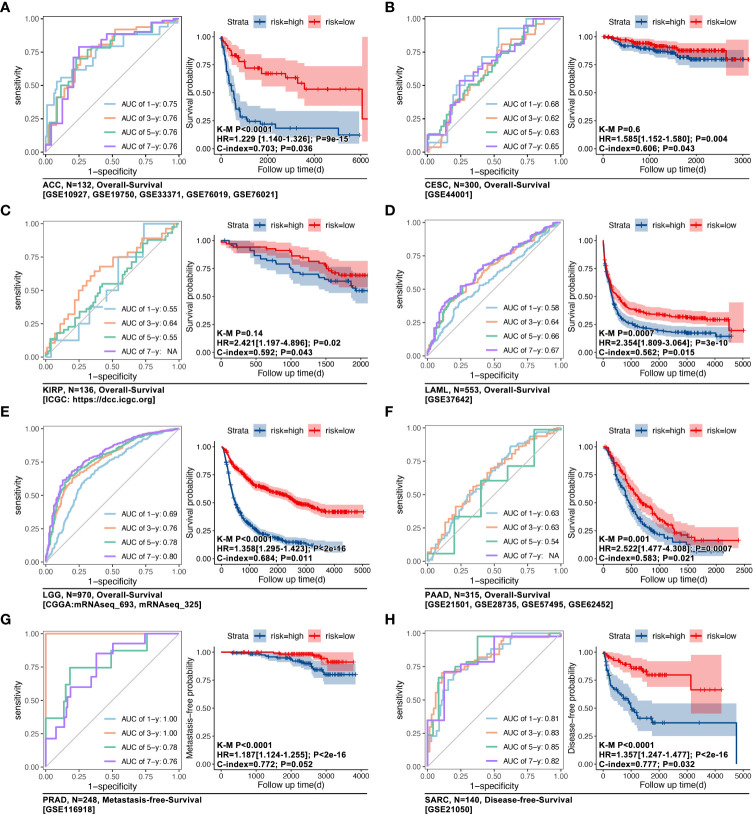
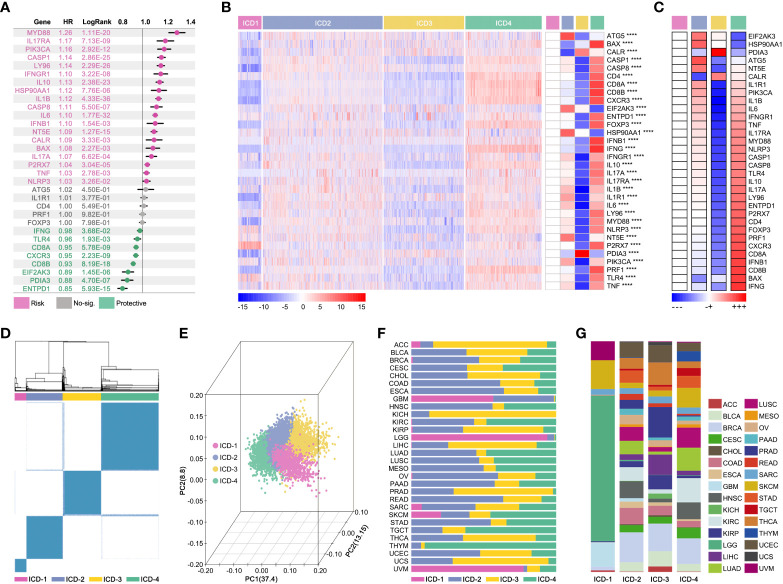
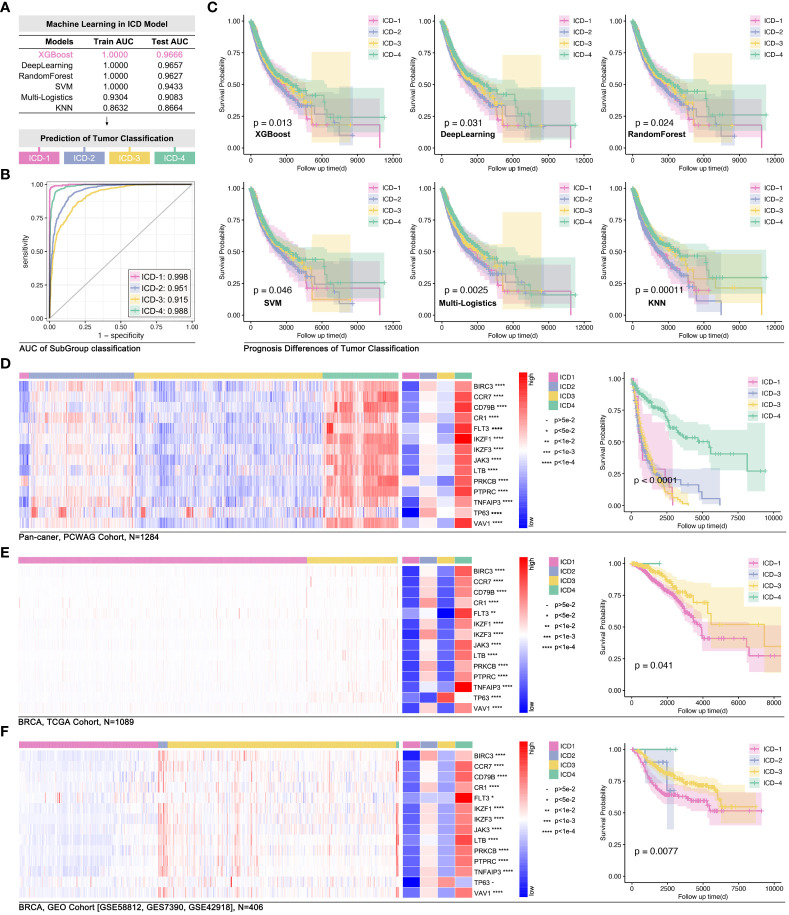
Methods: In this study, TCGA and GEO data cohorts were put into artificial intelligence (AI) to identify ICD subtypes, and in vitro experiments were performed.

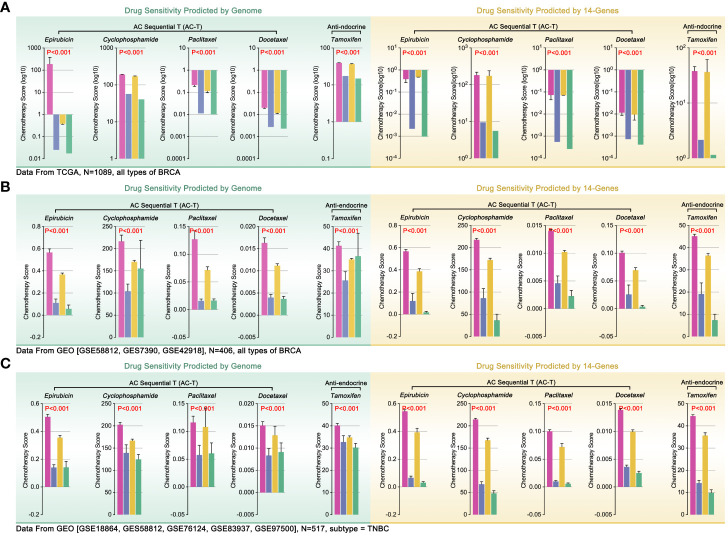
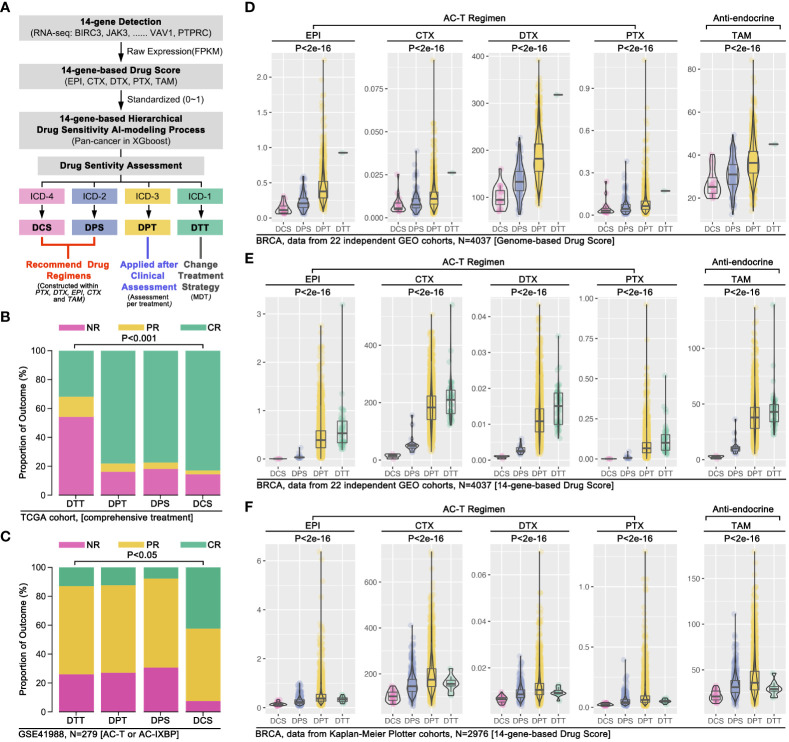
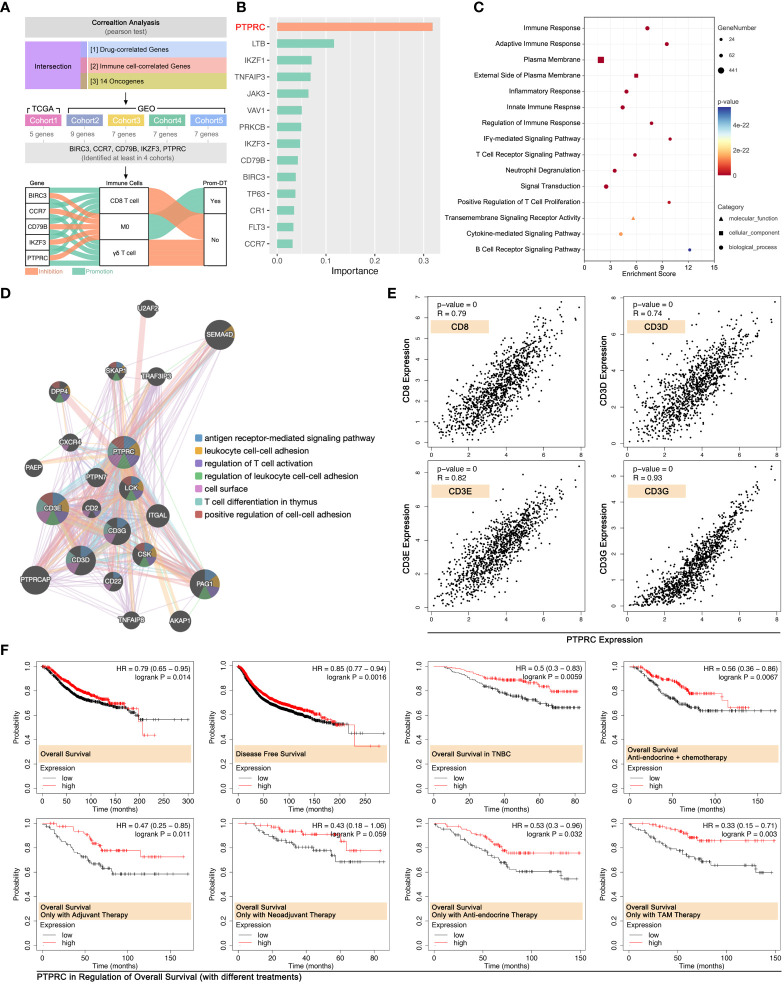
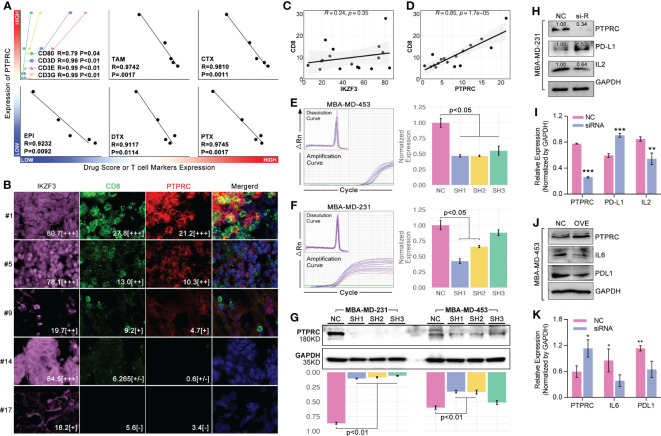
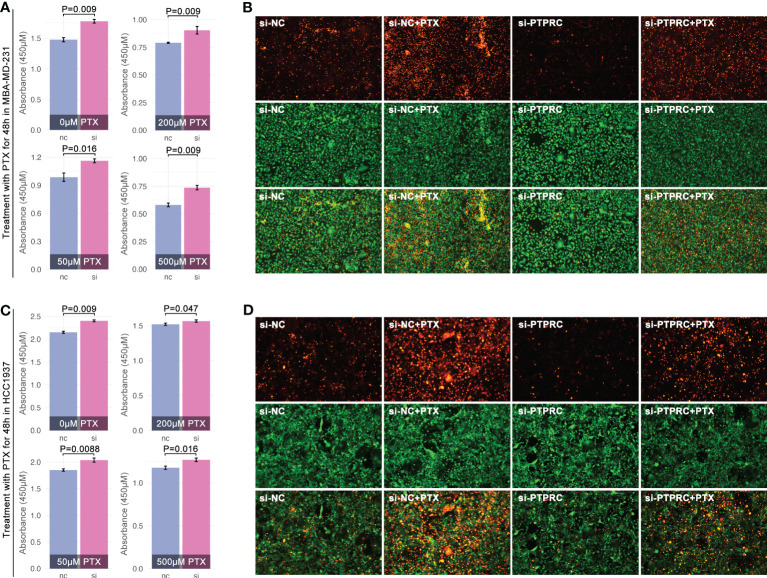
Results: Gene expression, prognosis, tumor immunity, and drug sensitivity showed significance among ICD subgroups, Besides, a 14-gene-based AI model was able to represent the genome-based drug sensitivity prediction, which was further verified in clinical trials. Network analysis revealed that PTPRC was the pivotal gene in regulating drug sensitivity by regulating CD8+ T cell infiltration. Through in vitro experiments, intracellular down-regulation of PTPRC enhanced paclitaxel tolerance in triple breast cancer (TNBC) cell lines. Meanwhile, the expression level of PTPRC was positively correlated with CD8+ T cell infiltration. Furthermore, the down-regulation of PTPRC increased the level of TNBC-derived PD-L1 and IL2.

Discussion: ICD-based subtype clustering of pan-cancer was helpful to evaluate chemotherapy sensitivity and immune cell infiltration, and PTPRC was a potential target to against drug resistance of breast cancer.

Keywords: CD8+ T cell; PTPRC; breast cancer; drug sensitivity; immunogenic cell death (ICD).


Conflict of interest statement

The authors declare that the research was conducted in the absence of any commercial or financial relationships that could be construed as a potential conflict of interest.

Figures

Figure 1
Figure 1
Technology roadmap of study. 32 ICD-associated genes were collected from previous studies and used to construct a prognosis model in the TCGA cohort and the GEO cohort; 14 IRGs-related TDGs were used to construct AI models based on IRGs-based clustering; 14 IRGs-TDGs-based and genome-based drug sensitivity prediction; The role of PTPRC in regulating CD8+ T cells infiltration-mediated chemotherapy sensitized.
Figure 2
Figure 2
IRGs-based prognosis training model in pan-cancer. (A) Technology roadmap of study; (B) Prognosis prediction efficiency in pan-cancer, and C-index of models in ACC, CESC, KIRP, LAML, LGG, MESO, PAAD, PRAD, SARC, and THCA were greater than 0.7 (labelled by blue); (C) ROC curves of ACC, CESC, KIRP, LAML, LGG, MESO, PAAD, PRAD, SARC, and THCA; (D) Kaplan-Meier survival curves of ACC, CESC, KIRP, LAML, LGG, MESO, PAAD, PRAD, SARC, and THCA.
Figure 3
Figure 3
IRGs-based prognosis verifying models in eight types of cancer. GEO cohorts were used to verify TCGA-based IRGs-based prognosis models in (A) ACC (n=132, GSE10927, GSE19750, GSE33371, GSE76019, GSE76021), in (B) CESC (n=300, GSE44001), in (C) KIRP (n=136, ICGC), in (D) LAML (n=553, GSE37642), in (E) LGG (n=970, mRNAseq_693, mRNAseq_325), in (F) PAAD (n=315, GSE21501, GSE28735, GSE57495, GSE62452), in (G) PRAD (n=248, GSE116918), and in (H) SARC (n=140, GSE215050).
Figure 4
Figure 4
Consensus-clustering-based ICD subgroup division. (A) Prognosis hazard ratio (HR) of ICD-related gene in pan-cancer, calculated by univariate cox regression in R (data from TCGA). (B, C) Expression feature map of ICD-related genes amongst ICD subgroups, and the expression differences of ICD-related genes. (D) Visualization of consensus clustering. (E) PCoA analysis of ICG subgroups; (F) Proportion characteristics of ICD subgroups in pan-cancer. (G) Proportion characteristics of pan-cancer in ICD subgroups. ****p value < 0.0001.
Figure 5
Figure 5
Phenotype features of ICD subgroups. Prognosis differences, including (A) overall survival (OS, p<0.001), (B) progression free interval (PFI, p<0.001), (C) disease free interval (DFI, p<0.001) and (D) disease free survival (DSS, p<0.001), amongst four ICD subgroups were calculated by 4-way log-rank. (E) Genomic instability was assessed by the level of (E) HOL, LST1, AI1, and HRD; (F) Immune score in ICD subgroups; (G) Immune cell infiltration (ICI) was predicted in CIBERSORT, and all of 20 types of immune cells in tumor filtration held significant differences amongst ICD subgroups. (H) Prognosis hazard ratio (HR) of immune cell infiltration in pan-cancer, which calculated by univariate cox regression in R. (I) T-cell exhaustion (TEX) score was calculated by ssGSEA based on GEPIA (TEX2) or literature (TEX) supplied TEX-related markers. (J) Firstly, different expression genes between ICD subgroups (p<0.05 and |logFc|>1.5) were identified, followed by upset function analysis to identify 408 genes which held different expression between any two ICD subgroups. Then, univariate cox regression was performed to identify prognosis-related genes. Next, 14 genes were identified as ICD-related cancer driver genes (ICD-TDGs). (K) GO and (L) KEGG analysis.
Figure 6
Figure 6
ICD-TDGs-based AI modeling identified ICD subgroups. (A) Randomly selecting 75% as the training cohort and 25% as testing cohort, followed by six machine learning functions (XGboost, Deep Learning, RandomForest, SVM, multi-logistics and KNN) to modeling ICD subgroups, amongst which (B) XGboost held best performance (training AUC=1.000, testing AUC=0.9666); (C) Prognosis differences between ICD subgroups modeled by XGboost (p=0.013), Deep Learning (p=0.031), RandomForest (p=0.024), SVM (p=0.046), multi-logistics (p=0.0025) and by KNN (P=0.00011). (D) ICD stratification in PCWAG data based on TCGA-based XGBoost model. (E) Gene expression feature and prognosis difference of breast cohort based on TCGA data. (F) Gene expression feature of ICD-TDGs and prognosis difference of ICD subgroups in GEO breast cancer cohort (n=408, GSE58812, GSE7390, GSE42918).
Figure 7
Figure 7
Genome-based and ICD-TDGs-based drug sensitivity prediction. (A) Drug sensitivity prediction, including epirubicin (EPI), cyclophosphamide (CTX), paclitaxel (PTX), docetaxel (DTX) and tamoxifen (TAM), in BRCA with TCGA data, amongst which green background represented genome-based drug sensitivity prediction while yellow background represented ICD-TDGs-based drug sensitivity prediction. (B) Drug sensitivity prediction in whole BRCA cohorts, in which data from GEO (GSE51561, GES20685, GSE20711, GSE25066, GSE29431, GSE613041); (C) Drug sensitivity prediction in TNBC cohorts, in which data from GEO (GSE18864, GES58812, GSE76124, GSE83937, GSE975001).
Figure 8
Figure 8
AI modeling identified drug sensitivity stratification in breast cancer. (A) AI modeling identified ICD subgroups were renamed as drug complete sensitivity (DCS, also named ICD4), drug partial sensitivity (DPS, also named ICD2), drug partial tolerance (DPT, also named ICD3), drug complete tolerance (DTT, also named ICD1). (B) Comprehensive therapy outcome in ICD subgroups, and NR mean no response, PR mean partial response, CR mean complete response; (C) Clinical trial therapy effects in ICD subgroups (data from GSE41988, n=279), and NR mean no response, PR mean partial response, CR mean complete response; (D) 22 independent breast cancer cohort from GEO database were merged into a 4037 samples cohort, followed by 14 ICD-TDGs-based AI modeling and genome-based drug prediction; (E) 14 ICD-TDGs-based AI modeling and 14-ICD-TDGs-based drug prediction (n=4037, GEO); (F) Breast cancer cohort from Kaplan-Meier Plottor was performed 14 ICD-TDGs-based AI modeling and drug prediction (n=2976).
Figure 9
Figure 9
The correlation between immune cell infiltration and drug sensitivity. (A) Differences of ICI amongst ICD subgroups, in which T cell CD8, T cell CD4 memory activity, Tregs, γδ T cell, NK cell activated, monocytes, macrophages M0, macrophages M1 and macrophages M2 held different infiltration proportion in BRCA (p<0.05) (data from TCGA, GEO cohort-4037 and GEO cohort-TNBC). (B) Pearson test identified T cell CD4 memory activity (am-CD4 T cell), T cell CD8 (CD8 T cell) and γδ T cell were negative correlated with drug score (p<0.05), while macrophages M0 (M0), NK cell activated (a-NK cell) and Tregs were positive correlated with drug score (p<0.05) (data from TCGA, GEO cohort-ALL and GEO cohort-TNBC). (C) Differences of ICI amongst ICD subgroups, in which CD8 T cell, am-CD4 T cell, γδ T cell and M0 held different infiltration proportion in BRCA (p<0.05) (data from GEO cohort-1 and cohort-2). (D) Pearson test identified CD8 T cell and γδ T cell were negative correlated with drug score (p<0.05), while M0 was positive correlated with drug score (p<0.05) (data from GEO cohort-1 [n=488] and GEO cohort-2 [n=1578]).
Figure 10
Figure 10
PTPRC was pivotal in CD8 T cell infiltration in BRCA. (A) Identifying both drug score related and immune cell infiltration related ICD-TDGs in four independent cohort (TCGA-BRCA, GEO cohort-4037, GEO cohort-TNBC, GEO cohort-1, GEO cohort-2), then identifying BIRC3, CCR7, CD79B, IKZF3 and PTPRC were the common feature genes in four data cohorts. All of those five genes were positively corelated to CD8 T cell and γδ T cell, while they were negatively corelated to M0. (B) Impact analysis in XGBoost Modeling; (C) GO analysis of PTPRC-related genes; (D) Molecular pathways of PTPRC-related genes (GeneMANIA: http://genemania.org); (E) Linear curve between PTPRC and markers of CD8+ T cells (CD8, CD3D, CD3E, CD3G); (F) Roles of the PTPRC expression level in prognosis of breast cancer with or without drug treatments.
Figure 11
Figure 11
PTPRC regulated CD8 T cell infiltration and TEX. (A) Local TNBC cohort was performed 14-ICD-TDGs-based drug sensitivity prediction, and the relationships between PTPRC and markers of CD8+ T cells, and between PTPRC and drug scores were explored; (B) Multiple immune inflorescence staining was performed in breast cancer tissues, amongst which pink represented IKZF3, green represented CD8, red represented PTPRC. And the results displayed the quantity of (C) IKZF3+ cells were not related with CD8+ T cells, while (D) PTPRC+ cells were positively related with CD8+ T cells (R=0.85, p=1.7e-5); TR-qPCR assays of siRNA experiments in TNBC cell lines, included (E) MBA-MD-453 and (F) MBA-MD-231; (G) Western blot assays displayed siRNA explements results, and sequence 1(SH1) and sequence-2 (SH2) were both efficient in decreased the intracellular expression level of PTPRC in TNBC cell lines; (H, I) siRNA and (J, K) recombination plasmid were applied to decrease the expression of PTPRC to explore the roles of PTPRC in regulating IL2/6 and PDL1. *p < 0.05; **p < 0.01; ***p < 0.001.
Figure 12
Figure 12
PTPRC regulated PTX sensitivity in TNBC. Decreasing of PTPRC by siRNA was followed by PTX treatment in MBA-MD-231 (A) and MBA-MD-453 (C), and viability was detected by CCK8. (B, D) Alive&death assay was performed to detect proportion of alive or dead cells with different treatments (orange means dead cells, while green means alive cells).
Figure 13
Figure 13
ICD-TDGs combined with clinical features to construct nomogram. (A) Multivariate cox regression identified BIRC3, CCR7, FTL3, IKZF3, PRKCB, PTPRC, and VAV1 to construct multi-gene riskscore; (B, C) Riskscore, clinical stage and age constructed nomogram; (D, E) AUC values of training cohort (TCGA-BRCA) and testing cohort (GEO20685); Calibrations of nomogram based on (F) TCGA data and (G) GEO data. *p < 0.05; **p < 0.01; ***p < 0.001.

References

    1. Swann JB, Smyth MJ. Immune surveillance of tumors. J Clin Invest. (2007) 117:1137–46. doi: 10.1172/JCI31405 - DOI - PMC - PubMed
    1. Zhou J, Wang G, Chen Y, Wang H, Hua Y, Cai Z. Immunogenic cell death in cancer therapy: present and emerging inducers. J Cell Mol Med (2019) 23:4854–65. doi: 10.1111/jcmm.14356 - DOI - PMC - PubMed
    1. Zhang B, Tang B, Lv J, Gao J, Qin L. Systematic analyses to explore immune gene sets-based signature in hepatocellular carcinoma, in which IGF2BP3 contributes to tumor progression. Clin Immunol (2022) 241:109073. doi: 10.1016/j.clim.2022.109073 - DOI - PubMed
    1. Fu Y, Liu S, Zeng S, Shen H. From bench to bed: the tumor immune microenvironment and current immunotherapeutic strategies for hepatocellular carcinoma. J Exp Clin Cancer Res (2019) 38:396. doi: 10.1186/s13046-019-1396-4 - DOI - PMC - PubMed
    1. Fucikova J, Kepp O, Kasikova L, Petroni G, Yamazaki T, Liu P, et al. . Detection of immunogenic cell death and its relevance for cancer therapy. Cell Death Dis (2020) 11:1013. doi: 10.1038/s41419-020-03221-2 - DOI - PMC - PubMed

Publication types

Substances