

Flared inflammatory episode transforms advanced myelodysplastic syndrome into aplastic pancytopenia: A case report and literature review
- PMID: 37388797
- PMCID: PMC10303598
- DOI: 10.12998/wjcc.v11.i17.4105
Flared inflammatory episode transforms advanced myelodysplastic syndrome into aplastic pancytopenia: A case report and literature review
Abstract
Background: Myelodysplastic syndrome (MDS) is a hematological neoplasm, and an increase in myeloblasts is representative of leukemic hematopoiesis in advanced MDS. Low-risk MDS usually exhibits deranged autoimmunity resembling that of aplastic anemia (AA), whereas advanced MDS is characterized by a phenotype of immune exhaustion. MDS can be normo/hyperplastic or hypoplastic. Generally, bone marrow cellularity and myeloblasts increase with disease progression. Transformation from advanced MDS to AA-like syndrome with leukemic cell regression has not previously been reported.
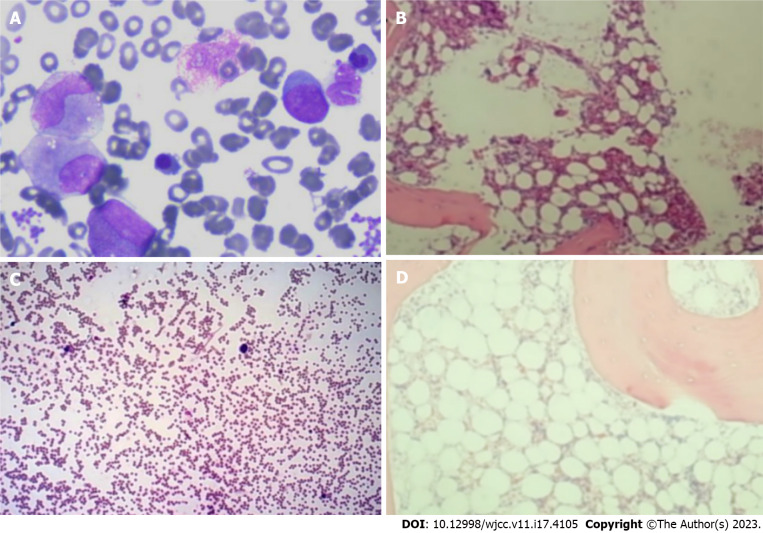
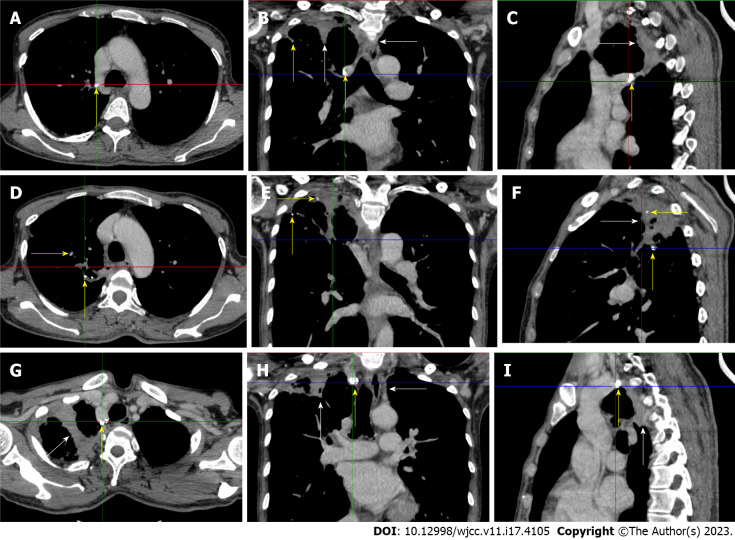
Case summary: A middle-aged Chinese woman had a 4-year history of leukocytopenia. Six months prior to admission, the patient developed gradually worsening fatigue and performance status. The leukocytopenia further progressed. She was diagnosed with MDS with excess blasts-2 based on increased bone marrow cellularity and an increased percentage of myeloblasts on marrow and blood smears, an increased percentage of cluster of differentiation (CD)34+CD33+ progenitors in immunotyping analysis, a normal karyotype in cytogenetic analysis, and the identification of somatic mutations in CBL, KMT2D and NF1 in molecular analysis. Initially, neutropenia was the predominant hematological abnormality, with mild anemia and thrombocytosis, and the degree of fatigue was far more severe than the degree of anemia. In the following months, the patient experienced several febrile episodes. Intravenous antibiotic treatments were able to control the febrile episodes, but the elevated inflammatory indices persisted. The hematological parameters dramatically fluctuated with the waxing and waning of the inflammatory episodes. With recurrent flares of the inflammatory condition, agranulocytosis and severe anemia developed, with mild thrombocytopenia. During the patient's hospitalization, computed tomography (CT) scans revealed the presence of extensive inflammatory lesions involving the lungs, mediastinum, pleura, gastrointestinal tract, peritoneum and urinary tract, with imaging features suggestive of the reactivation of disseminated tuberculosis. Reevaluation of the bone marrow smears revealed that the cellularity became hypoplastic, and the leukemic cells regressed, suggesting that both normal and leukemic hematopoiesis had been heavily suppressed. Immunological analysis of the bone marrow samples revealed a decreased percentage of CD34+ cells and an immunological signature resembling that of severe AA (SAA), confirming the regression of the leukemic cells by autoimmune-mediated attacks. The patient demonstrated resistance to multiple drugs, including antituberculotics, recombinant human granulocyte colony-stimulating factor, broad-spectrum antibiotics, voriconazole, ganciclovir, immune suppressants, eltrombopag and intravenous immunoglobulin, which further worsened the hematological injury and patient's performance status. The patient eventually died of overwhelming infection and multidrug resistance.
Conclusion: Advanced MDS can transform to aplastic cytopenia with leukemic cell regression and an immunological signature of SAA during inflammatory flare-ups.
Keywords: Antileukemic; Aplastic anemia; Case report; Inflammatory stress; Leukemic cell regression; Myelodysplastic syndrome.
©The Author(s) 2023. Published by Baishideng Publishing Group Inc. All rights reserved.
Conflict of interest statement
Conflict-of-interest statement: All the authors report no relevant conflicts of interest for this article.
Figures

Similar articles
-
When inflammatory stressors dramatically change, disease phenotypes may transform between autoimmune hematopoietic failure and myeloid neoplasms.Front Immunol. 2024 Feb 15;15:1339971. doi: 10.3389/fimmu.2024.1339971. eCollection 2024. Front Immunol. 2024. PMID: 38426096 Free PMC article. Review.
-
Tuberculosis-induced aplastic crisis and atypical lymphocyte expansion in advanced myelodysplastic syndrome: A case report and review of literature.World J Clin Cases. 2023 Jul 6;11(19):4713-4722. doi: 10.12998/wjcc.v11.i19.4713. World J Clin Cases. 2023. PMID: 37469724 Free PMC article.
-
Leukemic transformation during anti-tuberculosis treatment in aplastic anemia-paroxysmal nocturnal hemoglobinuria syndrome: A case report and review of literature.World J Clin Cases. 2023 Oct 6;11(28):6908-6919. doi: 10.12998/wjcc.v11.i28.6908. World J Clin Cases. 2023. PMID: 37901004 Free PMC article.
-
Physician Education: Myelodysplastic Syndrome.Oncologist. 1996;1(4):284-287. Oncologist. 1996. PMID: 10388004
-
Hypoplastic Myelodysplastic Syndromes: Just an Overlap Syndrome?Cancers (Basel). 2021 Jan 3;13(1):132. doi: 10.3390/cancers13010132. Cancers (Basel). 2021. PMID: 33401595 Free PMC article. Review.
Cited by
-
When inflammatory stressors dramatically change, disease phenotypes may transform between autoimmune hematopoietic failure and myeloid neoplasms.Front Immunol. 2024 Feb 15;15:1339971. doi: 10.3389/fimmu.2024.1339971. eCollection 2024. Front Immunol. 2024. PMID: 38426096 Free PMC article. Review.
References
-
- Li H, Hu F, Gale RP, Sekeres MA, Liang Y. Myelodysplastic syndromes. Nat Rev Dis Primers. 2022;8:74. - PubMed
-
- Giudice V, Selleri C. Aplastic anemia: Pathophysiology. Semin Hematol. 2022;59:13–20. - PubMed
-
- Shallis RM, Ahmad R, Zeidan AM. Aplastic anemia: Etiology, molecular pathogenesis, and emerging concepts. Eur J Haematol. 2018;101:711–720. - PubMed
Publication types
LinkOut - more resources
Full Text Sources
Research Materials
Miscellaneous
