. 2023 May 23;3(6):100332.
doi: 10.1016/j.xgen.2023.100332. eCollection 2023 Jun 14.

Performance and accuracy evaluation of reference panels for genotype imputation in sub-Saharan African populations

Affiliations

Performance and accuracy evaluation of reference panels for genotype imputation in sub-Saharan African populations

Dhriti Sengupta et al. Cell Genom. .

Abstract

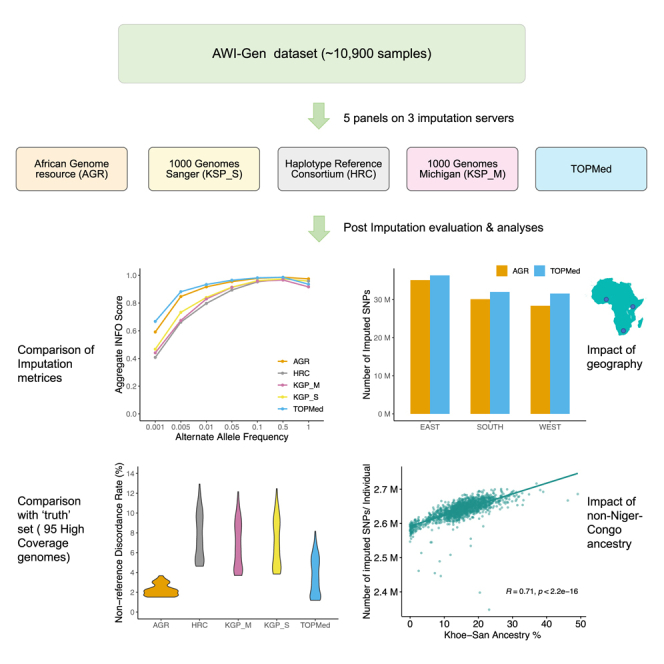
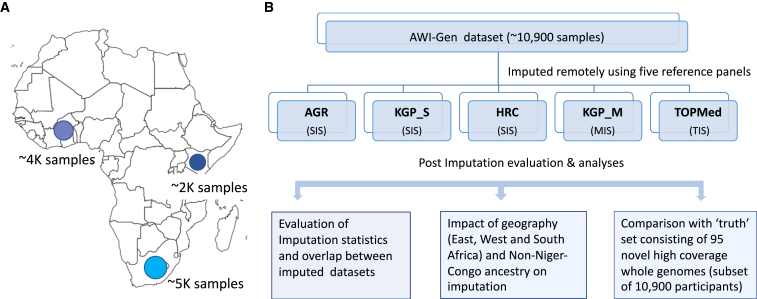
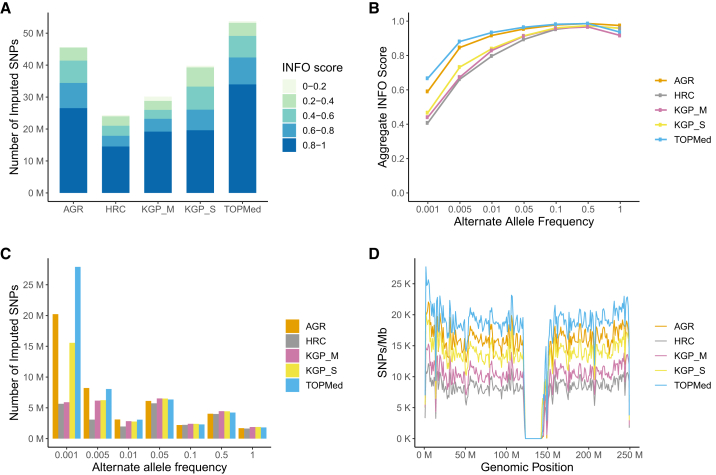
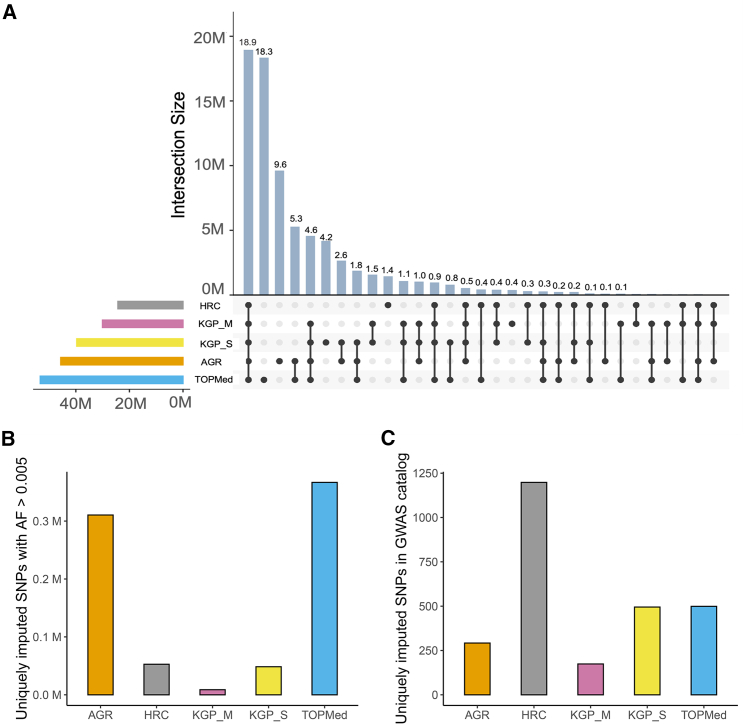
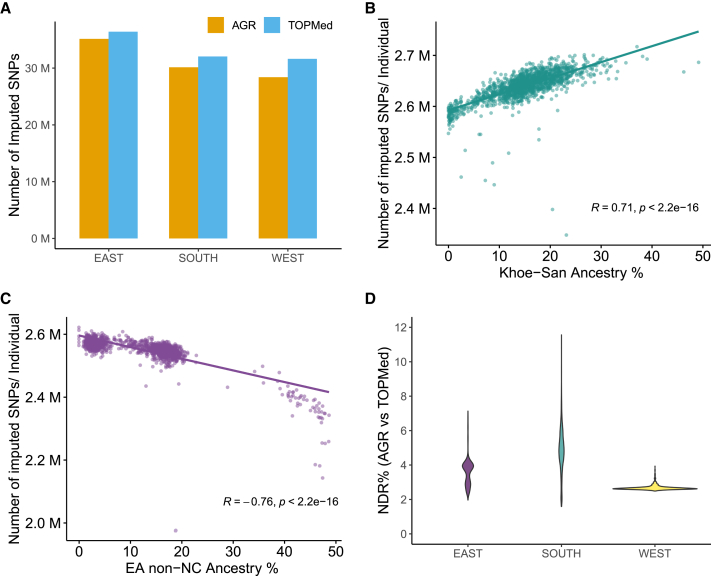
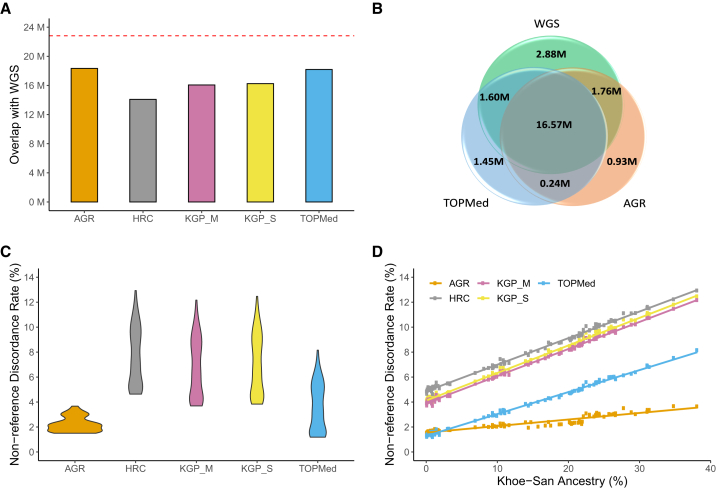
Based on evaluations of imputation performed on a genotype dataset consisting of about 11,000 sub-Saharan African (SSA) participants, we show Trans-Omics for Precision Medicine (TOPMed) and the African Genome Resource (AGR) to be currently the best panels for imputing SSA datasets. We report notable differences in the number of single-nucleotide polymorphisms (SNPs) that are imputed by different panels in datasets from East, West, and South Africa. Comparisons with a subset of 95 SSA high-coverage whole-genome sequences (WGSs) show that despite being about 20-fold smaller, the AGR imputed dataset has higher concordance with the WGSs. Moreover, the level of concordance between imputed and WGS datasets was strongly influenced by the extent of Khoe-San ancestry in a genome, highlighting the need for integration of not only geographically but also ancestrally diverse WGS data in reference panels for further improvement in imputation of SSA datasets. Approaches that integrate imputed data from different panels could also lead to better imputation.

Keywords: AGR; Africa; GWAS; TOPMed; imputation; imputation accuracy; non-reference discordance rate; reference panel; whole-genome sequence.


Conflict of interest statement

The authors declare no competing interests.

Figures

None
Graphical abstract
Figure 1
Figure 1
Summary of the AWI-Gen dataset and study schema (A) The participants from the AWI-Gen cohort are sampled from different regions across Africa—Kenya (East), Ghana and Burkina Faso (West), and South Africa (South). Numbers below the circles on the map show approximate sample sizes. (B) The schematic representation of the study design summarizing the main steps implemented to compare the datasets imputed using the five widely used reference panels: AGR, African Genome Resource hosted at the Sanger Imputation Server (SIS); KGP_S, 1000 Genomes Project hosted at the SIS; HRC, Haplo-type Reference Consortium hosted at the SIS; KGP_M, 1000 Genomes Project hosted at the Michigan Imputation Server (MIS); TOPMed, hosted at the TOPMed Imputation Server (TIS).
Figure 2
Figure 2
Evaluation of the AWI-Gen dataset imputed by the five reference panels (A) Total number of SNPs imputed by different panels and their distribution across all R2 or INFO score bins. (B) Average INFO score (or R2) across allele frequency bins. (C) Number of imputed SNPs across allele frequency bins. (D) SNP density per Mb for chromosome 1, related to Figure S1. All evaluations are based on 10,903 individuals. AGR, African Genome Resource hosted at the SIS; KGP_S, 1000 Genomes Project hosted at the SIS; HRC, Haplo-type Reference Consortium hosted at the SIS; KGP_M, 1000 Genomes Project hosted at the MIS; TOPMed, hosted at the TIS.
Figure 3
Figure 3
Overlap between SNPs imputed by the five reference panels (A) UpSet plot showing panel-specific and shared SNPs between the imputed datasets. (B) SNPs with allele frequency (AF) >0.005 that were imputed uniquely by each panel. (C) SNPs reported in GWAS catalog that were imputed uniquely by each panel. All the evaluations are based on 10,903 individuals. AGR, African Genome Resource hosted at the SIS; KGP_S, 1000 Genomes Project hosted at the SIS; HRC, Haplo-type Reference Consortium hosted at the SIS; KGP_M, 1000 Genomes Project hosted at the MIS; TOPMed, hosted at the TIS.
Figure 4
Figure 4
Impact of geography and non-Niger-Congo ancestry gene flow on imputation (A) Total number of imputed SNPs in samples from East, West, and South Africa by TOPMed and AGR. (B) Correlation between the number of SNPs imputed per individual by the AGR and the level of Khoe-San ancestry in South African participants. The regression line, along with correlation coefficient (R) and p value (Pearson correlation), is shown. (C) Inverse correlation between the number of SNPs imputed per individual by AGR and the level of East African non-Niger-Congo (EA non-NC) ancestry (Afro-Asiatic, Nilo-Saharan, or Eurasian) in the EA participants. The regression line, along with correlation coefficient (R) and p value (Pearson correlation), is shown. The ancestry proportions were inferred using ADMIXTURE (see Figure S5). Ancestry-based variation for the dataset imputed using the TOPMed panel is shown in Figure S6. (D) Violin plot comparing the distribution of non-reference discordance rate (NDR) between genotypes imputed using AGR vs. TOPMed in the East, West, and South African populations. Each regional subset (i.e., East, West, and South African populations) consist of ∼2,000 participants. The NDR is almost constant across the dataset for West African participants, while the NDR shows substantial variation among the South African participants. Panel codes: AGR, African Genome Resource hosted at the SIS; TOPMed, hosted at the TIS.
Figure 5
Figure 5
Comparison of imputed genotypes and genotypes inferred using WGS data (A) Number of sites that were shared by the imputed and WGS datasets for the 95 individuals. The red line on top shows the number of SNPs in the WGS data. (B) Venn diagram showing the overlap of SNPs between the WGSs and datasets imputed using AGR and TOPMed panels. (C) Violin plot summarizing the distribution of NDR for the five panels in the 95 individuals. (D) Correlation between the overall genotype discordance (estimated by NDR) and the level of Khoe-San ancestry in the five imputed datasets. The regression line for each panel is shown in a different color. The inclusion of the representative Khoe-San population probably leads to a much lower discordance and a gentler slope in the AGR compared with other panels. AGR, African Genome Resource hosted at the SIS; KGP_S, 1000 Genomes Project hosted at the SIS; HRC, Haplo-type Reference Consortium hosted at the SIS; KGP_M, 1000 Genomes Project hosted at the MIS; TOPMed, hosted at the TIS.

References

    1. Das S., Abecasis G.R., Browning B.L. Genotype imputation from large reference panels. Annu. Rev. Genomics Hum. Genet. 2018;19:73–96. - PubMed
    1. 1000 Genomes Project Consortium. Auton A., Brooks L.D., Durbin R.M., Garrison E.P., Kang H.M., Korbel J.O., Marchini J.L., McCarthy S., McVean G.A., et al. A global reference for human genetic variation. Nature. 2015;526:68–74. - PMC - PubMed
    1. McCarthy S., Das S., Kretzschmar W., Delaneau O., Wood A.R., Teumer A., Kang H.M., Fuchsberger C., Danecek P., Sharp K., et al. A reference panel of 64,976 haplotypes for genotype imputation. Nat. Genet. 2016;48:1279–1283. - PMC - PubMed
    1. Taliun D., Harris D.N., Kessler M.D., Carlson J., Szpiech Z.A., Torres R., Taliun S.A.G., Corvelo A., Gogarten S.M., Kang H.M., et al. Sequencing of 53,831 diverse genomes from the NHLBI TOPMed Program. Nature. 2021;590:290–299. - PMC - PubMed
    1. Gurdasani D., Carstensen T., Fatumo S., Chen G., Franklin C.S., Prado-Martinez J., Bouman H., Abascal F., Haber M., Tachmazidou I., et al. Uganda genome resource enables insights into population history and genomic discovery in Africa. Cell. 2019;179:984–1002.e36. - PMC - PubMed