. 2023 Apr 11;3(6):100298.
doi: 10.1016/j.xgen.2023.100298. eCollection 2023 Jun 14.

A multi-omics atlas of the human retina at single-cell resolution

Affiliations

A multi-omics atlas of the human retina at single-cell resolution

Qingnan Liang et al. Cell Genom. .

Abstract

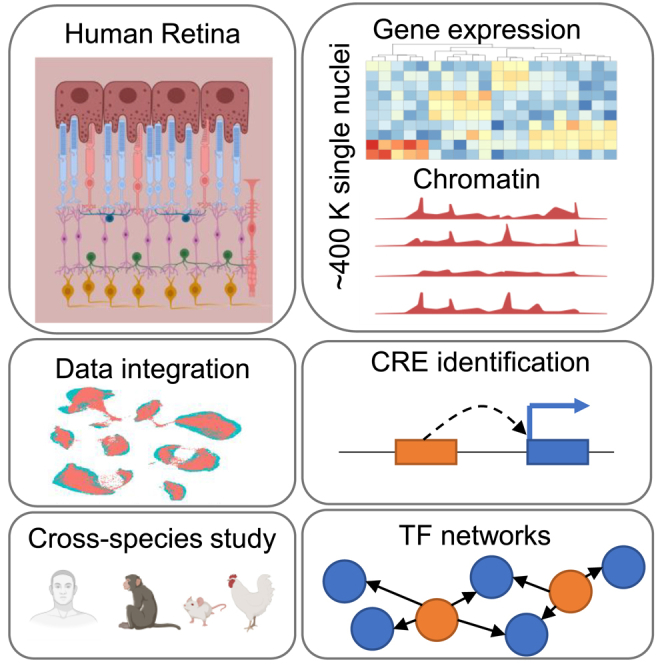
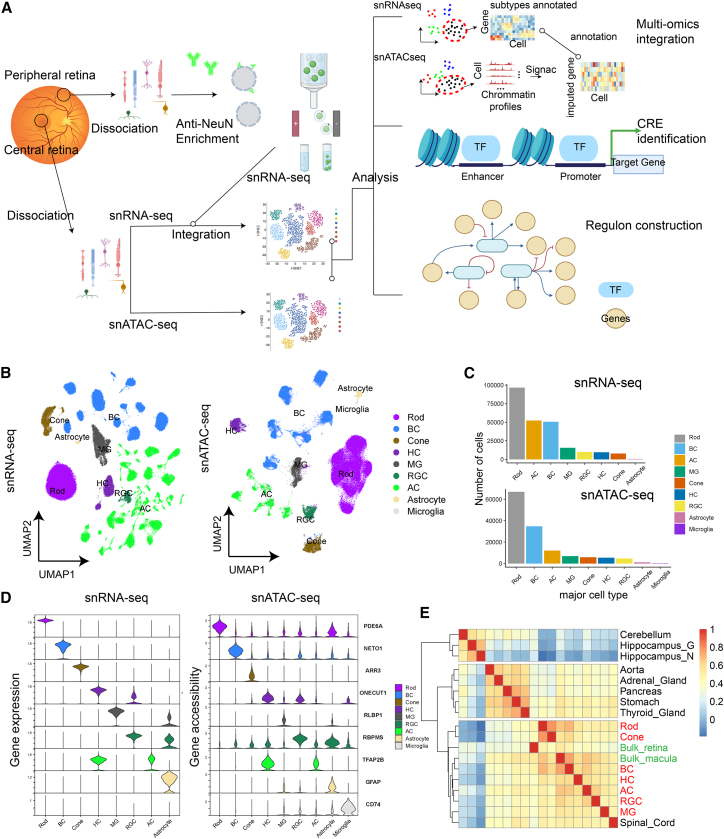
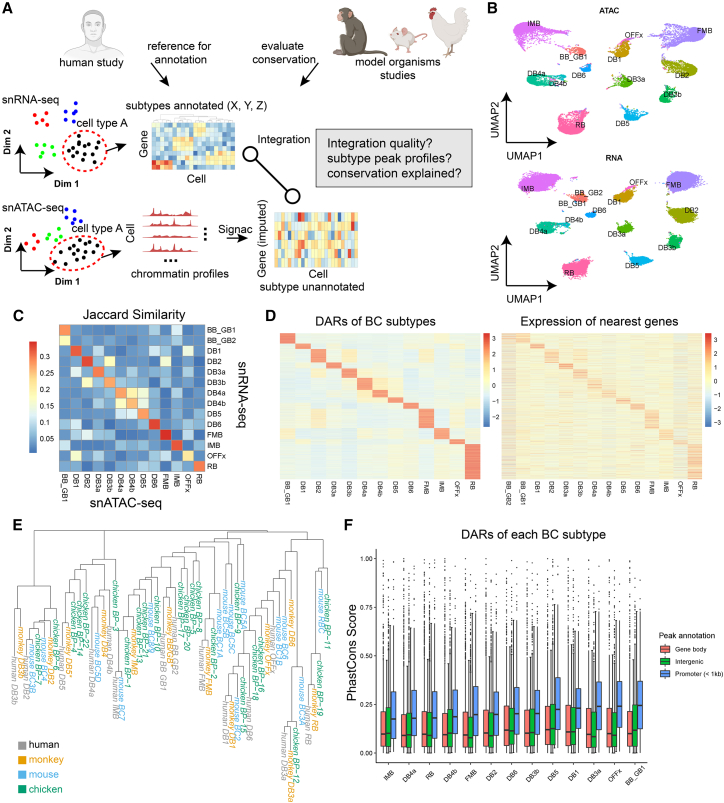
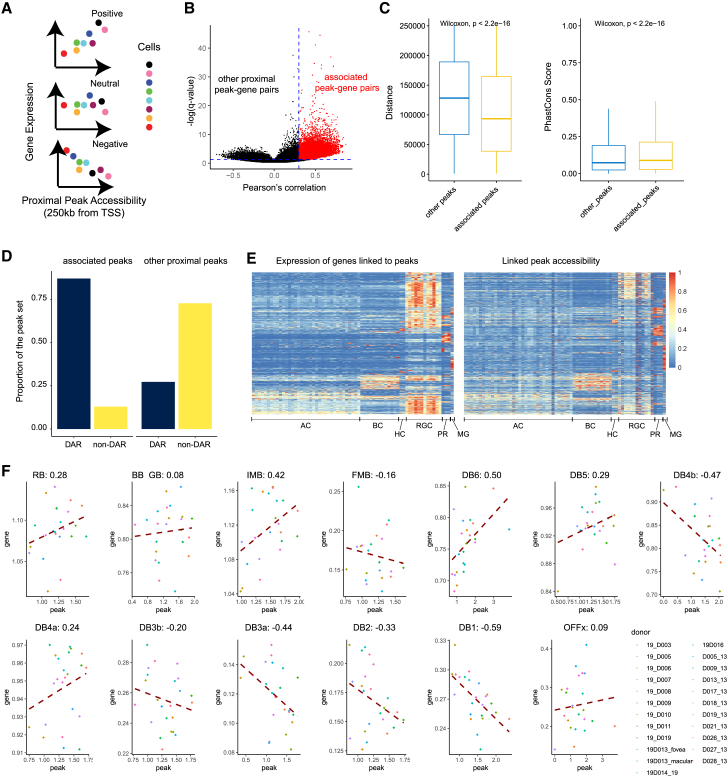
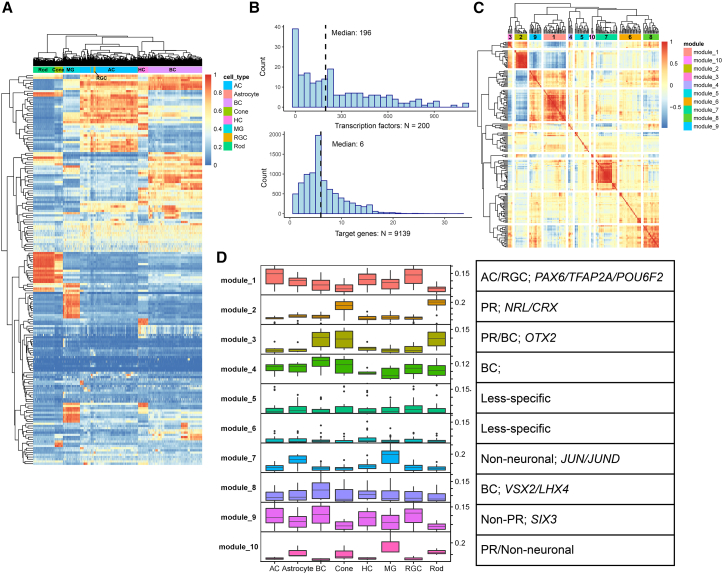
Cell classes in the human retina are highly heterogeneous with their abundance varying by several orders of magnitude. Here, we generated and integrated a multi-omics single-cell atlas of the adult human retina, including more than 250,000 nuclei for single-nuclei RNA-seq and 137,000 nuclei for single-nuclei ATAC-seq. Cross-species comparison of the retina atlas among human, monkey, mice, and chicken revealed relatively conserved and non-conserved types. Interestingly, the overall cell heterogeneity in primate retina decreases compared with that of rodent and chicken retina. Through integrative analysis, we identified 35,000 distal cis-element-gene pairs, constructed transcription factor (TF)-target regulons for more than 200 TFs, and partitioned the TFs into distinct co-active modules. We also revealed the heterogeneity of the cis-element-gene relationships in different cell types, even from the same class. Taken together, we present a comprehensive single-cell multi-omics atlas of the human retina as a resource that enables systematic molecular characterization at individual cell-type resolution.

Keywords: cross-species analysis; gene regulation; human retina; single-cell multi-omics.


Conflict of interest statement

The authors declare no competing interests.

Figures

None
Graphical abstract
Figure 1
Figure 1
Overview of the single-cell multi-omics atlas of human adult retina (A) The study design of this work. The retina samples were first split into the central and peripheral parts and rare cell enrichment was performed for peripheral retina. The snRNA-seq and snATAC-seq data were first processed separately and then integrated for analysis. (B) Two-dimensional embeddings (UMAP) for snRNA-seq (left) and snATAC-seq (right) data. Each data point represents a cell, and the color represents the annotated cell class. (C) The number of each cell class from the snRNA-seq (top) and snATAC-seq (bottom). (D) The gene expression and gene accessibility of reported retinal cell class marker genes in the snRNA-seq and snATAC-seq data. (E) Heatmap of the correlation between the open chromatin profiles of each retinal cell class and those of other human tissues.
Figure 2
Figure 2
Classification and multi-omics integration of retinal cell types (A) The analysis strategy to perform classification and multi-omics integration of retinal cell types. We perform sub-clustering solely using snRNA-seq data first and leverage published single-cell RNA-seq data of human or model organisms to assist the annotation of the cell types. We then annotate the snATAC-seq data using the annotated snRNA-seq data as the reference. (B) Two-dimensional embeddings (UMAP) for bipolar cells of the ATAC (top) and RNA (bottom) modality. (C) Heatmap representing the similarity between the differentially expressed genes and the differentially accessible genes from each bipolar cell type. (D) Demonstration of the consistency between the differentially accessible regions (DARs, left) and their nearest genes (right) among bipolar cell types. (E) Phylogenetic tree representing the overall similarity of bipolar cell types among four species: human (gray), monkey (yellow), mouse (blue), and chicken (green). (F) Boxplot showing the PhastCons score of DARs of each bipolar cell type. The DARs were partitioned to “gene body,” “intergenic,” or “promoter” before the visualization. The center line of the boxplot shows the median of the data; the box limits show the upper and lower quartiles; the whiskers show 1.5 times interquartile ranges.
Figure 3
Figure 3
Identification of putative enhancers by linking peak to genes (A) Demonstration of the idea of correlating the gene expression with the proximal peak accessibility. When observing the relationship between a peak and a gene among cells, it is possible that they are positively, negatively, or neutrally correlated. (B) Volcano plot showing the overall distribution of peak-gene links in two dimensions: their Pearson’s correlation coefficient and negative log-transformed q-values (p values with false discovery rate correction). Red data points highlight the links we considered as putative enhancers. (C) Boxplot showing the comparison between the putative enhancers and other proximal peaks on their distance to linked gene and sequence conservation. Wilcoxon tests were performed to evaluate the difference between the groups. The center line of the boxplot shows the median of the data; the box limits show the upper and lower quartiles; the whiskers show 1.5 times interquartile ranges. (D) Bar plot showing the comparison between the putative enhancers and other proximal peaks on their overlapping with major cell class DARs. (E) Heatmap showing the relative expression of genes linked to peaks and their linked genes across different cell types. The gene expression level and peak accessibility level were both normalized between 0 and 1. (F) The peak-gene correlation between chr12:6959945-6962406 and GNB3 in all bipolar cell types. For each panel, each data point represents a donor and the red dashed-line represents the linear fit of the correlation between the peak and the gene. The Pearson’s correlation coefficients were labeled on each panel.
Figure 4
Figure 4
Inference of TF activity and annotation of TF modules (A) Heatmap representing the TF activities (row) for each meta cell (column). The TF activities were first calculated using the AUCell framework and then normalized between 0 and 1. (B) Basic metrics of the TF-target regulons. The upper and bottom panels showed the distribution of number of targets per TF and numbers of TF regulators per target. Median values are labeled. (C) Heatmap depicting the TF-TF correlations. Hierarchical clustering was first made, and modules were detected by cutting the tree to K groups (K = 10 here). (D) The activity of TFs in each module in each cell class. The TF modules were then annotated based on the observed specificity of the module. Previously studied TFs are also listed. The center line of the boxplot shows the median of the data; the box limits show the upper and lower quartiles; the whiskers show 1.5 times interquartile ranges.

References

    1. Masland R.H. The neuronal organization of the retina. Neuron. 2012;76:266–280. doi: 10.1016/j.neuron.2012.10.002. - DOI - PMC - PubMed
    1. Kolb H. Webvision; 2012. Gross anatomy of the eye.http://webvision.med.utah.edu/book/part-i-foundations/gross-anatomy-of-t... - PubMed
    1. Baden T., Euler T., Berens P. Understanding the retinal basis of vision across species. Nat. Rev. Neurosci. 2019;21:5–20. doi: 10.1038/s41583-019-0242-1. - DOI - PubMed
    1. Hoon M., Okawa H., Della Santina L., Wong R.O.L. Functional architecture of the retina: development and disease. Prog. Retin. Eye Res. 2014;42:44–84. doi: 10.1016/J.PRETEYERES.2014.06.003. - DOI - PMC - PubMed
    1. Peng Y.R., Shekhar K., Yan W., Herrmann D., Sappington A., Bryman G.S., van Zyl T., Do M.T.H., Regev A., Sanes J.R. Molecular classification and comparative taxonomics of foveal and peripheral cells in primate retina. Cell. 2019;176:1222–1237.e22. doi: 10.1016/j.cell.2019.01.004. - DOI - PMC - PubMed