. 2023 Jun 14:14:1198390.
doi: 10.3389/fphys.2023.1198390. eCollection 2023.

Physical inactivity induces insulin resistance in plantaris muscle through protein tyrosine phosphatase 1B activation in mice

Affiliations

Physical inactivity induces insulin resistance in plantaris muscle through protein tyrosine phosphatase 1B activation in mice

Saori Kakehi et al. Front Physiol. .

Abstract

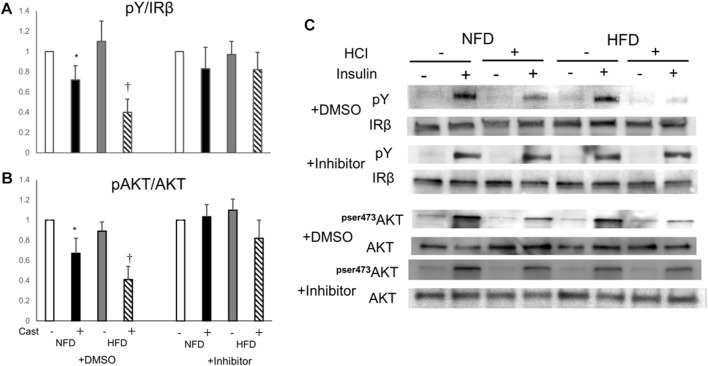
Inactivity causes insulin resistance in skeletal muscle and exacerbates various lifestyle-related diseases. We previously found that 24-h hindlimb cast immobilization (HCI) of the predominantly slow-twitch soleus muscle increased intramyocellular diacylglycerol (IMDG) and insulin resistance by activation of lipin1, and HCI after a high-fat diet (HFD) further aggravated insulin resistance. Here, we investigated the effects of HCI on the fast-twitch-predominant plantaris muscle. HCI reduced the insulin sensitivity of plantaris muscle by approximately 30%, and HCI following HFD dramatically reduced insulin sensitivity by approximately 70% without significant changes in the amount of IMDG. Insulin-stimulated phosphorylation levels of insulin receptor (IR), IR substrate-1, and Akt were reduced in parallel with the decrease in insulin sensitivity. Furthermore, tyrosine phosphatase 1B (PTP1B), a protein known to inhibit insulin action by dephosphorylating IR, was activated, and PTP1B inhibition canceled HCI-induced insulin resistance. In conclusion, HCI causes insulin resistance in the fast-twitch-predominant plantaris muscle as well as in the slow-twitch-predominant soleus muscle, and HFD potentiates these effects in both muscle types. However, the mechanism differed between soleus and plantaris muscles, since insulin resistance was mediated by the PTP1B inhibition at IR in plantaris muscle.

Keywords: PTP1B; high fat diet; insulin resistance; physical inactivity; skeletal muscle.


Conflict of interest statement

The authors declare that the research was conducted in the absence of any commercial or financial relationships that could be construed as a potential conflict of interest.

Figures

FIGURE 1
FIGURE 1
Changes in ex vivo insulin-induced 2-DOG uptake and lipid composition after HCI and HFD in plantaris muscle. (A) Changes in insulin-induced 2-DOG uptake (Δ2-DOG). ∗NFD with HCI vs NFD without HCI (p = 0.041) and HFD without HCI (p = 0.044). †HFD with HCI vs NFD without HCI (p = 0.02) and HFD without HCI (p = 0.023) and NFD with HCI (p = 0.046). (B)Total TG ∗HFD without HCI vs NFD without HCI (p = 0.022) and NFD with HCI (p = 0.027), HFD with HCI vs NFD without HCI (p = 0.029) and NFD with HCI (p = 0.03)., (C)DG, and (D)ceramide content in plantaris muscle after each treatment. Data are shown as the means ± SD of eight mice per group. (A–D) Data are expressed relative to control groups (NFD without HCI: white bar; NFD with HCI: black bar; HFD without HCI: Gy bar; HFD with HCI: striped bar). p values were determined by ANOVA followed by Tukey multiple comparison tests.
FIGURE 2
FIGURE 2
Changes in insulin signal transduction by HCI and HFD in plantaris muscle. (A) Quantification of insulin-induced tyrosine phosphorylation of IR relative to IR protein. ∗NFD with HCI vs NFD without HCI (p = 0.028) and HFD without HCI (p = 0.045). †HFD with HCI vs NFD without HCI (p = 0.02) and HFD without HCI (p = 0.038) and NFD with HCI (p = 0.043). (B) Quantification of insulin-induced tyrosine phosphorylation of IRS1 relative to IRS1 protein. ∗NFD with HCI vs NFD without HCI (p = 0.03) and HFD without HCI (p = 0.042). †HFD with HCI vs NFD without HCI (p = 0.013) and HFD without HCI (p = 0.048) and NFD with HCI (p = 0.038). (C) Quantification of insulin-induced phosphorylation of Akt at Ser478 relative to Akt protein. ∗NFD with HCI vs NFD without HCI (p = 0.019) and HFD without HCI (p = 0.031). †HFD with HCI vs NFD without HCI (p = 0.008) and HFD without HCI (p = 0.012) and NFD with HCI (p = 0.03). (D) Representative immunoblots of insulin-induced insulin signaling proteins. Data are shown as the means ± SD of 8–10 mice per group. (A–C) Data are expressed relative to control groups (NFD without HCI: white bar; NFD with HCI: black bar; HFD without HCI: Gy bar; HFD with HCI: striped bar). p values were determined ANOVA followed by Tukey multiple comparison tests.
FIGURE 3
FIGURE 3
The effects of HCI and HFD on IRS1 phosphorylation level in plantaris muscle. (A) Quantification of Ser307 phosphorylation in IRS1 ∗HFD without HCI vs NFD without HCI (p = 0.01) and NFD with HCI (p = 0.018), HFD with HCI vs NFD without HCI (p = 0.02) and NFD with HCI (p = 0.022) (B) Quantification of Ser636/639 phosphorylation in IRS1 ∗NFD with HCI vs NFD without HCI (p = 0.022) and HFD without HCI (p = 0.024), HFD with HCI vs NFD without HCI (p = 0.025) and HFD without HCI (p = 0.03) (C) Quantification of Ser1101 phosphorylation in IRS1∗NFD with HCI vs NFD without HCI (p = 0.023) and HFD without HCI (p = 0.04), HFD with HCI vs NFD without HCI (p = 0.025) and HFD without HCI (p = 0.03) (D) Representative immunoblots of IRS1 proteins. Data are shown as the means ± SD of six mice per group. (A–C) Data are expressed relative to control groups (NFD without HCI: white bar; NFD with HCI: black bar; HFD without HCI: gray bar; HFD with HCI: striped bar). p values were determined by ANOVA followed by Tukey multiple comparison tests.
FIGURE 4
FIGURE 4
Involvement of PTP1B in the effects of HFD and HCI in plantaris muscle. (A) Quantification of PTP1B mRNA levels relative to TBP mRNA. ∗HFD with HCI vs NFD without HCI (p = 0.011) and NFD with HCI (p = 0.024) and HFD without HCI (p = 0.026) (B) Representative immunoblots and quantitation of PTP1B proteins immunoprecipitated with IRβ. Quantification of PTP1B relative to IRβ protein. ∗HFD with HCI vs NFD without HCI (p = 0.013) and NFD with HCI (p = 0.024) and HFD without HCI (p = 0.031), †NFD with HCI vs NFD without HCI (p = 0.041) and HFD without HCI vs NFD without HCI (p = 0.044) (C) PTP1B activity. ∗HFD with HCI vs NFD without HCI (p = 0.01) and NFD with HCI (p = 0.034) and HFD without HCI (p = 0.037), †NFD with HCI vs NFD without HCI (p = 0.033) (D) Quantification of TNFα mRNA levels relative to TBP mRNA. Data are expressed relative to control groups. #NFD with HCI vs NFD without HCI (p = 0.008) and HFD without HCI (p = 0.01), and HFD with HCI vs NFD without HCI (p = 0.012) and HFD without HCI (p = 0.026) (A–D) Data are shown as the means ± SD of 8–15 mice per group (NFD without HCI: white bar; NFD with HCI: black bar; HFD without HCI: Gy bar, HFD with HCI: striped bar). p values were determined by ANOVA followed by Tukey multiple comparison tests.
FIGURE 5
FIGURE 5
Effects of PTP1B inhibition on insulin signaling suppression caused by HFD and HCI in plantaris muscle. PTP1B inhibition was performed by preincubating 10 μM PTP1B cell-permeable inhibitor with dissected plantaris muscle for 30 min at 37°C. (A) Quantification of insulin-induced tyrosine phosphorylation of IR relative to IR protein. ∗NFD with HCI vs NFD without HCI (p = 0.036) and HFD without HCI (p = 0.041). †HFD with HCI vs NFD without HCI (p = 0.014) and HFD without HCI (p = 0.037) and NFD with HCI (p = 0.043). (B) Quantification of insulin-induced phosphorylation of Akt at Ser478 relative to Akt protein. ∗NFD with HCI vs NFD without HCI (p = 0.033) and HFD without HCI (p = 0.04). †HFD with HCI vs NFD without HCI (p = 0.021) and HFD without HCI (p = 0.031) and NFD with HCI (p = 0.049). (C) Representative immunoblots of insulin-induced insulin signaling proteins. (A, B) Data are expressed relative to control groups. Data are shown as the means ± SD of 8–15 mice per group (NFD without HCI: white bar; NFD with HCI: black bar; HFD without HCI: Gy bar, HFD with HCI: striped bar). p values were determined by ANOVA followed by Tukey multiple comparison tests.

References

    1. Andersen J. N., Elson A., Lammers R., Romer J., Clausen J. T., Moller K. B., et al. (2001). Comparative study of protein tyrosine phosphatase-epsilon isoforms: Membrane localization confers specificity in cellular signalling. Biochem. J. 354, 581–590. 10.1042/0264-6021:3540581 - DOI - PMC - PubMed
    1. Defronzo R. A., Gunnarsson R., Bjorkman O., Olsson M., Wahren J. (1985). Effects of insulin on peripheral and splanchnic glucose metabolism in noninsulin-dependent (type II) diabetes mellitus. J. Clin. Invest. 76, 149–155. 10.1172/JCI111938 - DOI - PMC - PubMed
    1. Defronzo R. A. (2004). Pathogenesis of type 2 diabetes mellitus. Med. Clin. North Am. 88, 787–835. ix. 10.1016/j.mcna.2004.04.013 - DOI - PubMed
    1. Delibegovic M., Bence K. K., Mody N., Hong E. G., Ko H. J., Kim J. K., et al. (2007). Improved glucose homeostasis in mice with muscle-specific deletion of protein-tyrosine phosphatase 1B. Mol. Cell Biol. 27, 7727–7734. 10.1128/MCB.00959-07 - DOI - PMC - PubMed
    1. Dunstan D. W., Salmon J., Owen N., Armstrong T., Zimmet P. Z., Welborn T. A., et al. (2005). Associations of TV viewing and physical activity with the metabolic syndrome in Australian adults. Diabetologia 48, 2254–2261. 10.1007/s00125-005-1963-4 - DOI - PubMed