. 2023 Jun 14:17:1067098.
doi: 10.3389/fnins.2023.1067098. eCollection 2023.

In Type 2 Diabetes Mellitus, normalization of hemoglobin A1c accompanies reduced sensitivity to pressure at the sternum

Affiliations

In Type 2 Diabetes Mellitus, normalization of hemoglobin A1c accompanies reduced sensitivity to pressure at the sternum

Jens Faber et al. Front Neurosci. .

Abstract

Background: The autonomic nervous system (ANS) maintains glucose homeostasis. While higher than normal glucose levels stimulate the ANS toward reduction, previous findings suggest an association between sensitivity to, or pain from, pressure at the chest bone (pressure or pain sensitivity, PPS) and activity of the ANS. A recent randomized controlled trial (RCT) of type 2 diabetes (T2DM) suggested that addition of an experimental, non-pharmacological intervention more effectively than conventional treatment lowered the levels of both PPS and HbA1c.

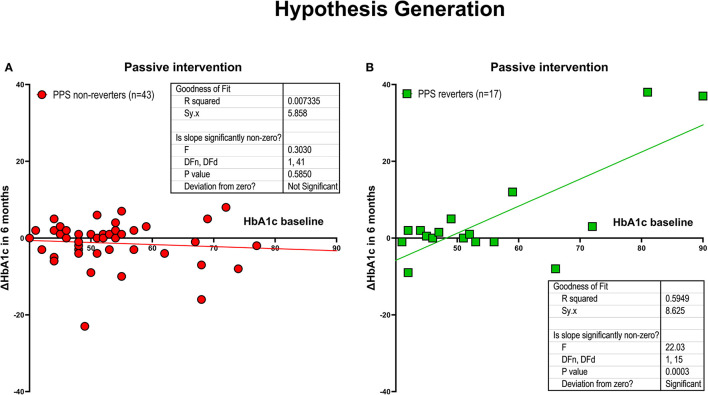
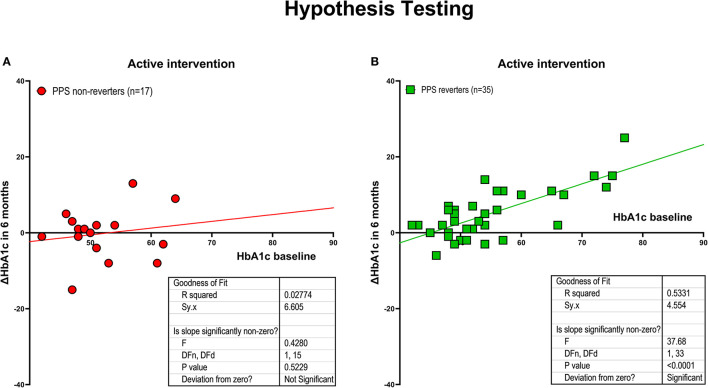
Materials and analyses: We tested the null hypothesis that conventional treatment (n = 60) would reveal no association between baseline HbA1c and normalization of HbA1c in 6 months, related to change of PPS. We compared the changes of HbA1c in PPS reverters who experienced a minimum reduction of 15 units of PPS and in PPS non-reverters who experienced no reduction. Depending on the result, we tested the association in a second group of participants with addition of the experimental program (n = 52).

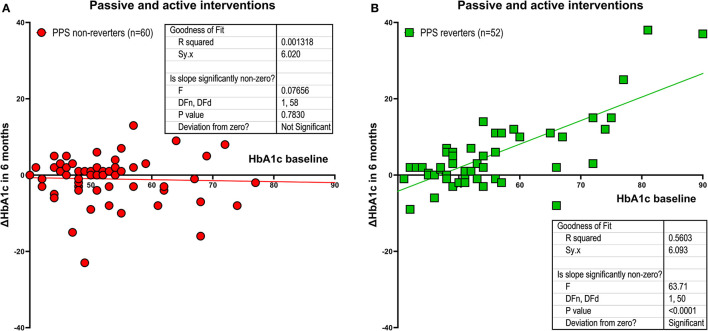
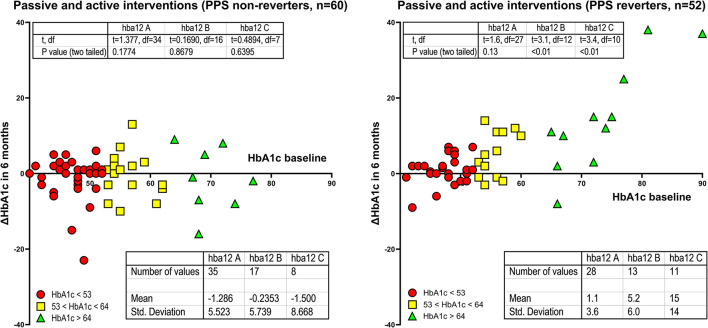
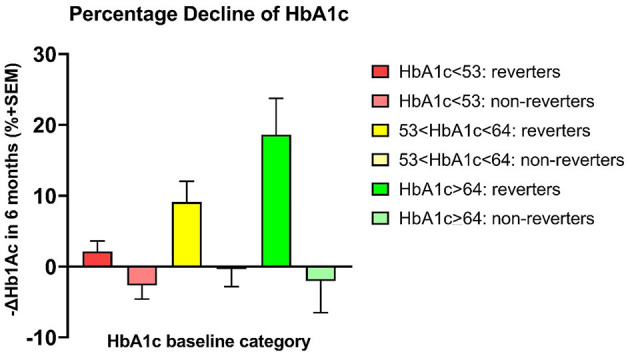
Results: In the conventional group, PPS reverters experienced normalization of HbA1c that corrected the basal increase, thus disproving the null hypothesis. With the addition of the experimental program, PPS reverters experienced similar reduction. The reduction of HbA1c among reverters averaged 0.62 mmol/mol per mmol/mol increase of baseline HbA1c (P < 0.0001 compared to non-reverters). For baseline HbA1c ≥ 64 mmol/mol, reverters averaged 22% reduction of HbA1c (P < 0.01).

Conclusion: In consecutive analyses of two different populations of individuals with T2DM, we demonstrated that the higher the baseline HbA1c, the greater the reduction of HbA1c but only in individuals with a concomitant reduction of sensitivity to PPS, suggesting a homeostatic effect of the autonomic nervous system on glucose metabolism. As such, ANS function, measured as PPS, is an objective measure of HbA1c homeostasis. This observation may be of great clinical importance.

Keywords: autonomic nervous system dysfunction; energy homoeostasis; glucose homeostasis; glucose metabolism; glycated hemoglobin (HbA1c); homeostasis; pressure pain sensitivity; type 2 diabetes.


Conflict of interest statement

SB is a shareholder in the company that holds the patent for the PPS measurement device. He did not participate in participant selection, examinations, or evaluation of the examinations. The remaining authors declare that the research was conducted in the absence of any commercial or financial relationships that could be construed as a potential conflict of interest.

Figures

Figure 1
Figure 1
Hypothesis generation. Intervention effect measured as the relation between changes in HbA1c after 6 months of conventional treatment and the baseline HbA1c for individuals randomized to the conventional treatment group. The participants included individuals who experienced a predefined minimum reduction of PPS ≥ 15 after the intervention period (i.e., PPS reverters; N = 17) and individuals who did not experience this reduction (PPS non-reverters; N = 43). (A) PPS non-reverters; (B) PPS reverters (between-group difference significant at P < 0.0001). Regarding HbA1c change depicted on the y-axis, a positive value reflects a reduction in HbA1c.
Figure 2
Figure 2
Hypothesis testing. Intervention effect measured as the relation between changes in HbA1c after 6 months of intervention and baseline HbA1c, for individuals randomized to active treatment group, including individuals who experienced a predefined minimum reduction of PPS ≥ 15 during the intervention period (i.e., PPS reverters; N = 35), and individuals without this reduction (PPS non-reverters; N = 17). (A) PPS non-reverters. (B) PPS reverters (between-group difference significant at P < 0.003). Regarding HbA1c change depicted on the y-axis, a positive value reflects a reduction in HbA1c.
Figure 3
Figure 3
Combined groups. Intervention effect measured as the relation between changes in HbA1c after 6 months of intervention and baseline HbA1c with experimental and conventional treatment group members pooled, including individuals with a predefined minimum reduction of PPS ≥ 15 at the end of the intervention period (i.e., PPS reverters; N = 52), and individuals without this reduction (PPS non-reverters; N = 60). (A) shows PPS non-reverters. (B) shows PPS reverters (between-group difference signifcant at P < 0.0001). Regarding HbA1c change depicted on the y-axis, a positive value reflects a reduction in HbA1c.
Figure 4
Figure 4
Stratification of baseline HbA1c values into three groups. PPS reverter and PPS non-reverter analyses of HbA1c changes in units of mmol/mol. Differences in mean HbAc1 as change after 6 months of intervention in units of mmol/mol for three levels of baseline HbA1c values. Reverters and non-reverters represented by different colors as shown. Regarding HbA1c change depicted on the y-axis, a positive value reflects a reduction in HbA1c.
Figure 5
Figure 5
Percentage declines of HbA1c. PPS reverters vs. PPS non-reverters by analysis of percentage HbA1c changes. Differences in mean HbAc1 (mmol/mol before minus after 6 months of intervention) for three sets of patients with a predefined incremental increase in baseline HbA1c between sets.

Similar articles

Cited by

References

    1. Adeghate E., Lotfy M., D'souza C., Alseiari S. M., Alsaadi A. A., Qahtan S. A. (2020). Hypocretin/orexin modulates body weight and the metabolism of glucose and insulin. Diab. Metab. Res. Rev. 36, e3229. 10.1002/dmrr.3229 - DOI - PubMed
    1. Arendt-Nielsen L., Yarnitsky D. (2009). Experimental and clinical applications of quantitative sensory testing applied to skin, muscles and viscera. J. Pain. 10, 556–572. 10.1016/j.jpain.2009.02.002 - DOI - PubMed
    1. Arrigoni E., Chee M. J. S., Fuller P. M. (2019). To eat or to sleep: That is a lateral hypothalamic question. Neuropharmacology 154, 34–49. 10.1016/j.neuropharm.2018.11.017 - DOI - PubMed
    1. Baer L. B. M. (2010). “Understanding Rating Scales and Assessment Instruments,” in Handbook of clinicla rating scales and assessment in psychiatry and mental health (New York: Humana Press; ). 10.1007/978-1-59745-387-5 - DOI
    1. Ballegaard S., Muteki T., Harada H., Ueda N., Tsuda H., Tayama F., et al. . (1993). Modulatory effect of acupuncture on the cardiovascular system: a cross-over study. Acupunct. Electrother. Res. 18, 103–115. 10.3727/036012993816357548 - DOI - PubMed