. 2023 Apr 6:1:370-380.
doi: 10.1038/s44221-023-00057-w.

National hydrologic connectivity classification links wetlands with stream water quality

Affiliations

National hydrologic connectivity classification links wetlands with stream water quality

Scott G Leibowitz et al. Nat Water. .

Abstract

Wetland hydrologic connections to downstream waters influence stream water quality. However, no systematic approach for characterizing this connectivity exists. Here using physical principles, we categorized conterminous US freshwater wetlands into four hydrologic connectivity classes based on stream contact and flowpath depth to the nearest stream: riparian, non-riparian shallow, non-riparian mid-depth and non-riparian deep. These classes were heterogeneously distributed over the conterminous United States; for example, riparian dominated the south-eastern and Gulf coasts, while non-riparian deep dominated the Upper Midwest and High Plains. Analysis of a national stream dataset indicated acidification and organic matter brownification increased with connectivity. Eutrophication and sedimentation decreased with wetland area but did not respond to connectivity. This classification advances our mechanistic understanding of wetland influences on water quality nationally and could be applied globally.


Conflict of interest statement

Competing interests The authors declare no competing interests.

Figures

Fig. 1 |
Fig. 1 |. Wetland hydrologic connectivity classification.
a, Four hydrologic connectivity classes: Riparian wetlands have an outlet within one 30 m pixel from a stream and bidirectional flows. The three non-riparian classes are greater than one pixel from a stream and all have unidirectional flows. NRShw have permeable and poorly drained soils on the flowpath between the wetland and downstream water. Owing to poor drainage, subsurface flows are shallow and surface flows can occur relatively frequently through saturation excess overland flow. NRMid have permeable and well-drained soils on the flowpath. Owing to good drainage, subsurface flows are deeper (mid-depth), but surface flows can occur occasionally through infiltration excess overland flow. NRDeep have impermeable soils on the flowpath. Non-channelized surface flows can occur when the wetland basin is filled with water and additional water input causes the wetland to either spill over or merge into downstream waters, but this is limited to rare and episodic flooding events. Water transport is more common via deep subsurface flowpaths from the bottom of the wetland to downstream waters. Note that depth in the non-riparian class name refers to flowpath and not wetland depth. b, Flow chart summarizing classification of wetland hydrologic connectivity classes. Note wetlands are defined on the basis of 2011 NLCD classes 90 (woody wetland) and 95 (emergent herbaceous wetland); however, woody versus emergent herbaceous type is not incorporated into the resulting classification. For details, see Methods.
Fig. 2 |
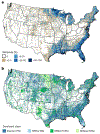
Fig. 2 |. Wetland characteristics of stream catchments across the CONUS.
a, Wetlands as a per cent of total land cover within the NHDPlusV2 catchment. b, Dominant wetland hydrologic connectivity class within NHDPlusV2 catchments (parenthetical values in key indicate per cent of catchments across the CONUS dominated by that particular connectivity class).
Fig. 3 |
Fig. 3 |. Relationships between four groups of stream constituents and wetland hydrologic connectivity based on standardized population mean regression slopes from linear mixed effects models.
ad, Mean slope represents the standardized relationship between the constituent and wetland connectivity class averaged across all regions. A filled (dark) circle indicates that the regression slope is significantly different than zero, that is, the regression slope plus or minus the confidence interval (two times the standard error of the slope estimate) does not overlap with zero; points represented by an open (light) circle are not significantly different than zero (Supplementary Table 3). Wetland connectivity for the four classes is NRDeep < NRMid < NRShw < Riparian. For details on the modelling approach, see Methods. Dashed line represents zero intercept. Acidification (a): cond (n = 1,764), Ca (n = 1,787), Mg (n = 1,787), Al (n = 1,180), pH (n = 1,764) and ANC (n = 1,788). Brownification (b): DOC (n = 1,788) and colour (n = 1,786). Eutrophication (c): NO3 (n = 1,338). Sedimentation (d): turb (n = 1,764) and TSS (n = 1,694).

References

    1. Ghermandi A, van den Bergh JCJM, Brander LM, de Groot HLF & Nunes PALD Values of natural and human-made wetlands: a meta-analysis. Water Resour. Res 46, W12516 (2010).
    1. Evenson GR, Golden HE, Lane CR, McLaughlin DL & D’Amico E Depressional wetlands affect watershed hydrological, biogeochemical, and ecological functions. Ecol. Appl 28, 953–966 (2018). - PMC - PubMed
    1. Lane CR, Leibowitz SG, Autrey BC, LeDuc SD & Alexander LC Hydrological, physical, and chemical functions and connectivity of non-floodplain wetlands to downstream waters: a review. J. Am. Water Resour. Assoc 54, 346–371 (2018). - PMC - PubMed
    1. Bousquin J & Hychka K A geospatial assessment of flood vulnerability reduction by freshwater wetlands—a benefit indicators approach. Front. Environ. Sci 7, 54 (2019). - PMC - PubMed
    1. Comer P et al. Biodiversity values of geographically isolated wetlands in the United States NatureServe; https://www.natureserve.org/sites/default/files/biodiversity_values_of_g... (2005).

LinkOut - more resources